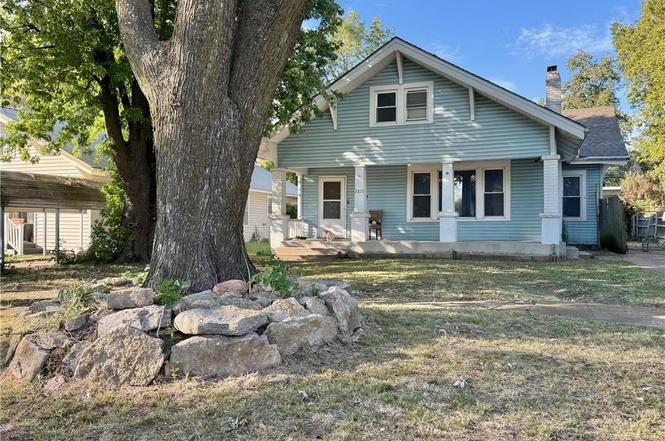
2815 Washington Ave · Parsons, KS
Flood risk 1/10 · Minimal
- FEMA flood zone
- X (unshaded)
- Chance of flooding over 30 yrs
- 0.0%
- Est. flood insurance / yr
- $507 – $1,088
Fire risk 4/10 · Minor
- Est. fire insurance / yr
- $1,154 – $2,142
Heat risk 5/10 · Moderate
- Hot days now (above 108°F)
- 7 days/yr
- Hot days in 30 yrs
- 19 days/yr
Wind risk 2/10 · Minimal
- Chance of severe wind over 30 yrs
- 2.0%
Air-quality risk 2/10 · Minimal
- Unhealthy air days now
- 1 days/yr
- Unhealthy air days in 30 yrs
- 1 days/yr
Risk factors via First Street. Map © Google.
Why this score? — see what drove the B+ grade
The composite is a weighted blend of 9 inputs, each scored 0–100. Each bar is that input's sub-score; the figure is the points it added to the 100-point composite (weight × sub-score).
- Cash flow +30.0/30.0
- ARV discount +15.0/15.0
- 1% rule +10.0/10.0
- DSCR +10.0/10.0
- Livability +3.5/5.0
- Rent growth +2.5/5.0
- Condition / age +2.5/5.0
- Schools +2.0/10.0
- Appreciation +0.0/10.0
$52,500
🖨 Deal sheet 📄 Offer letter ✓ Due diligence
Listing remarks MLS
Lots of space with beautiful arts & crafts style construction and natural woodwork. Four full bedrooms plus an office or dressing area. Wood burning fireplace in living room. Efficient kitchen with nice oak cabinets all with pull out drawers and shelves. Quiet 4th ward location.
Key facts
- Eating area
- Bonus room
- Dining room
Tags
Neighborhood map
What this means for you Summary
Snapshot
- This is a 3-bed/1.5-bath single-family listed at $52k.
Deal economics
- At list price, monthly cash flow is $516 ($6k/yr) — positive.
- The deal already cash-flows at list — no discount required.
- Meets the 1% rule at list price ($1k rent vs $52k).
- Recommended offer: $46k (12.0% below list) — sets the bar for market timing.
- Cap rate 18.1% vs local median 4.6% in Parsons — top-decile yield for the area; either an underpriced asset or a hidden risk that comps aren't pricing in. Stress-test before assuming the spread holds.
Location & tenants
- Location reads 70/100 on livability (#164 in KS) — a middle-class / working-renter tenant base. Strengths: cost of living A+, housing A+, health & safety A+; Watch: employment D, schools F, crime F.
- Parsons (town): math 21% / reading 28% proficiency, ranked #143 of 169 in KS (top 85%) — low school quality limits family demand, transient renter base, plan for 1-2y turnover.
- Market conditions: 43 active listings in the ZIP; 1 units permitted in Labette County in 2024 (0 in 5+ unit buildings).
Forward outlook
- Local home prices are declining (-3.0%/yr); year-one equity from $363 of loan paydown is wiped out by about $2k of value loss. Plan a longer hold.
- Labette County population projected at -24% by 2050 — secular population decline; favor cash flow + early exit over multi-decade hold.
- At projected returns (-3.0% appreciation + 3.0% rent growth), your $15k cash investment doubles in ~3 years — after that, you're playing with house money.
Negotiation context
- It's been on market 179 days — a 12% lower offer ($46k) is reasonable based on typical stale-listing flexibility.
- 3 sale attempts since 24y ago; this cycle's ask has dropped $37k (42%) from the opening price — seller is motivated, your offer sets the floor, not the list.
Risks & watch-outs
- Watch-outs: built in 1900 — expect roof / HVAC / electrical / plumbing capex.
- Climate carrying-cost: extreme-heat days projected 7→19/yr by 2055 (HVAC capex compounding) — expect insurance premiums to compound above CPI over the hold.
Questions for the listing agent
- It's been on market 179 days. Have you received any prior offers? Is the seller open to a 12% concession, seller financing, or rate buy-down credit?
- Built in 1900 — when were the roof, HVAC, electrical panel, plumbing, and water heater last replaced?
- Why hasn't it sold? Are there any deal-killer items the seller is aware of (foundation, flood, title, zoning, code violations)?
- Is there a deadline driving the sale (1031 exchange, divorce, estate, relocation)? That informs how much negotiation room exists.
- Schools are F-rated, which usually means shorter tenancies and higher turnover. Who's the typical renter profile here, and what's been the actual vacancy rate?
- Crime grade is F in this area — have there been break-ins, vandalism, or insurance claims at this property in the last 3 years? What carrier currently insures it and at what premium?
- What's the average days-on-market for RENTAL listings here right now (not sales)? A rising rental-DOM trend means longer vacancies and softer asking-rent achievability than the comps imply.
- What's the recent tenant-quality profile in this submarket — average credit score on applications, eviction rate, late-payment / NSF rate, and stable-employment percentage? A property-management company in the area should have these aggregated.
- How much new for-sale + rental construction is in the pipeline within 1–3 miles? Heavy new supply typically softens prices + rents 12–24 months out; constrained supply supports both.
Investment metrics
- 1% rule
- 2.12% ✓
- Cap rate
- 18.08%
- Cash-on-cash
- 42.09%
- DSCR
- 2.87
- GRM
- 3.9
CMA / ARV
- ARV (on-the-fly)
- $101,716
- Comps found
- 12
Show comp detail 12 sales within ~0.75 mi
| Address | Dist | Beds/Ba | Sqft | Sold | Price | $/sf | Match |
|---|---|---|---|---|---|---|---|
| 2823 Crawford Ave | 0.07mi | 2/1.0 (-1) | 1,832 (+6%) | 2mo | $73,000 | $40 | 78 |
| 2408 Crawford Ave | 0.36mi | 3/3.0 | 1,739 (+1%) | 1mo | $185,000 | $106 | 75 |
| 2430 Broadway Ave | 0.35mi | 4/1.0 (+1) | 1,690 (-2%) | 5mo | $119,000 | $70 | 69 |
| 2411 Crawford Ave | 0.37mi | 3/1.0 | 1,636 (-5%) | 9mo | $89,900 | $55 | 65 |
| 3105 Appleton Ave | 0.53mi | 3/2.0 | 1,746 (+1%) | 9mo | $134,900 | $77 | 64 |
| 2214 Crawford Ave | 0.53mi | 3/2.0 | 1,749 (+2%) | 11mo | $115,000 | $66 | 61 |
| 2726 Stevens Ave | 0.20mi | 4/2.0 (+1) | 1,486 (-14%) | 3mo | $92,500 | $62 | 58 |
| 2530 Crawford Ave | 0.23mi | 3/1.0 | 1,918 (+11%) | 13mo | $68,900 | $36 | 58 |
| 411 Katy Ave | 0.22mi | 3/1.5 | 1,552 (-10%) | 18mo | $69,500 | $45 | 58 |
| 2501 Broadway Ave | 0.32mi | 4/1.5 (+1) | 1,578 (-8%) | 13mo | $74,900 | $47 | 55 |
| 2330 Clark Ave | 0.42mi | 3/1.0 | 1,577 (-8%) | 14mo | $34,900 | $22 | 53 |
| 2317 Washington Ave | 0.43mi | 4/2.0 (+1) | 1,622 (-6%) | 21mo | $95,900 | $59 | 46 |
Match score weights: distance 35% · size 25% · config 20% · recency 20%. Top-matched comps best support the ARV.
Projected returns pro-forma
-3.0% appreciation · 3.0% rent growth · sell at horizon
- IRR
- 38.8%
- Equity multiple
- 2.66×
- Total profit
- $24,345
- Equity at exit
- $7,828
- IRR
- 45.2%
- Equity multiple
- 5.32×
- Total profit
- $63,548
- Equity at exit
- $4,539
Cash invested: $14,700 (down + closing). Projections, not guarantees.
Landlord ↔ Tenant lean methodology
- Overall (STATE)
- 83 Strongly Landlord-Friendly
- State Kansas
- 83 Strongly Landlord-Friendly · R+10
- County
- — inherits STATE
- City
- — inherits STATE
ZIP-level market 67357
- Home prices YoY
- -20.4%
- Active inventory
- 43
- Price-to-rent
- 3.9×
Monthly cashflow live
- Estimated rent
- $1,112 medium interval (Pro) →
- Mortgage (P&I)
- −$275
- Tax est. 1.5%
- −$66 /mo · $788/yr
- Insurance
- −$22
- HOA
- −$0
- Vacancy / Maint / Mgmt
- −$233
- Net cashflow
- $516
Break-even live
UW: 25.0% down · 7.5% · 30yr · 1.5% tax · 5.0% vac · 8.0% maint · 8.0% mgmt
Financing live
Cash to close
- Down payment
- $13,125
- Closing costs
- $1,575
- Reserves months
- —
- Total cash needed
- —
Loan-product check · same deal, 3 products live
Conventional
25% down · 7.5% · 30yr
- Down + closing
- —
- Monthly P&I
- —
- Monthly cashflow
- —
- DSCR
- —
- Eligible?
- —
Personal DTI + credit; lowest rate.
DSCR
20% down · 8.5% · 30yr
- Down + closing
- —
- Monthly P&I
- —
- Monthly cashflow
- —
- DSCR
- —
- Eligible?
- —
No personal income docs; deal must DSCR.
Hard money
10% down · 12.0% · 12mo
- Down + closing
- —
- Monthly P&I
- —
- Monthly cashflow
- —
- DSCR
- —
- Eligible?
- —
Short-term bridge; refi at stabilization.
Listing history 11 events
-
2026-04-07status Pending
-
2026-02-24price $52,500
-
2026-01-08status Active
-
2025-12-31historical
-
2025-11-07price $74,900
-
2025-10-15price $79,900
-
2025-10-02$89,900 Active
-
2002-06-28soldstatus 285-char remark
Show marketing remark (285 chars)
Lots of space with beautiful arts & crafts style construction and natural woodwork. Four full bedrooms plus an office or dressing area. Wood burning fireplace in living room. Efficient kitchen with nice oak cabinets all with pull out drawers and shelves. Quiet 4th ward location.
-
2002-06-01soldstatus $53,000
-
2002-05-30$56,000 285-char remark
Show marketing remark (285 chars)
Lots of space with beautiful arts & crafts style construction and natural woodwork. Four full bedrooms plus an office or dressing area. Wood burning fireplace in living room. Efficient kitchen with nice oak cabinets all with pull out drawers and shelves. Quiet 4th ward location.
-
1997-07-01soldstatus $48,500
ⓘ Source: listings_history table (triggers on properties + properties_extension) + one-shot
backfill from property_details.listing_events for pre-trigger history.
Climate risk First Street
- Flood 1/10 Low FEMA zone X (unshaded) · 0% chance over 30 yrs
- Wildfire 4/10 Moderate
- Heat 5/10 Major 7 d/yr ≥108°F today · 19 d/yr by 30 yrs out
- Wind 2/10 Low 2% chance of damaging wind over 30 yrs
- Air quality 2/10 Low 1 unhealthy d/yr today · 1 by 30 yrs out
Nearby sold comps map
Loading sold comps map…
Walkable amenities ~0.75 mi
Loading nearby amenities…
Taxation est. · year 1
- Rental income
- $13,342
- − Mortgage interest
- −$2,941
- − Property taxes
- −$788
- − Insurance
- −$262
- − Repairs & maintenance
- −$1,067
- − Management
- −$1,067
- − Depreciation
- −$1,527
- Taxable income
- $5,689
- Est. tax owed @ 24.0%
- −$1,365
- After-tax cash flow
- $4,821/yr
For passive investors: Depreciation is non-cash, so a rental often shows a tax loss while cash-flowing — sheltering income. Rental losses are passive: they offset passive income freely, and up to $25,000/yr can offset ordinary (W-2) income if you actively participate and your MAGI is under $100k (phasing out to $0 by $150k); unused losses carry forward. On sale, claimed depreciation is recaptured at up to 25%, and gains may owe capital-gains tax (a 1031 exchange can defer both). Figures are a year-1 estimate at your 24.0% rate — not tax advice; consult a CPA.
Schools (NCES district)
- District
- Parsons
- NCES district ID
- 2010560
- Math proficiency
- 21% ▼ -7.00%
- Reading proficiency
- 28% ▼ -3.00%
- Median HH income
- $37,868
- Composite
- 20.46/100
- National rank
- #8576
- State rank
- #143 of 169 in KS
Livability — Parsons
- Score
- 70/100
- State rank
- #164
- US rank
- #7726
Category grades
Schools grade is shown separately in the Schools card above.
Census & demographics
- Census place
- Parsons, KS
- City population
- 11,786
- Population (ZIP)
- 11,786
Population outlook (Labette County) Hauer SSP2
- Today (2025)
- 19,413 people
- By 2030
- 18,552 · -4.4%
- By 2040
- 16,701 · -14.0%
- By 2050
- 14,832 · -23.6%
- By 2075
- 11,046 · -43.1%
- By 2100
- 8,020 · -58.7%
Race, ethnicity, and origin ACS 2023
- Neighborhood character
- Predominantly White (81%)
- Race & ethnicity
- White 81% Two or more races 7% Hispanic / Latino 7% Black 5%
- Hispanic origin (detail)
- Mexican 5% Puerto Rican 1%
- Common ancestry
- Slovak 2% Lithuanian 2% Italian 1%
- Foreign-born
- 0%
- Languages at home
- 98% English-only · Spanish 1% German/W. Germanic 1%
Political lean MEDSL · Labette
- 2024 margin
- Solid R (+38.2) · D 30.1% · R 68.3% · Other 1.6%
- 2008→2024 swing
- -25.3pp toward R · 2008: -12.9pp · 2024: -38.2pp
- All cycles
- 2024: R+38.2 2020: R+36.0 2016: R+37.9 2012: R+20.2 2008: R+12.9
Not yet ingested
- Civics
- —
Market trends
- HPI YoY
- ▼ -37.97%
- Current HPI
- 147.8259
- Rent YoY
- —
- Metro
- —
- State GDP YoY
- —
- F500 in state
- 0
Price history
+8.2% since first listed11 events — show timeline
- 2026-04-07 Pending — Heartland MLS as Distributed by MLS Grid
- 2026-02-24 Price Changed $52,500 Heartland MLS as Distributed by MLS Grid
- 2026-01-08 Relisted — Heartland MLS as Distributed by MLS Grid
- 2025-12-31 Listing Removed — Heartland MLS as Distributed by MLS Grid
- 2025-11-07 Price Changed $74,900 Heartland MLS as Distributed by MLS Grid
- 2025-10-15 Price Changed $79,900 Heartland MLS as Distributed by MLS Grid
- 2025-10-02 Listed $89,900 Heartland MLS as Distributed by MLS Grid
- 2002-06-28 Sold (MLS) — Heartland MLS as Distributed by MLS Grid
- 2002-06-01 Sold (Public Records) $53,000 Public Records
- 2002-05-30 Listed $56,000 Heartland MLS as Distributed by MLS Grid
- 1997-07-01 Sold (Public Records) $48,500 Public Records
Cash-flow waterfall
monthlySold comps — $/sqft
last 12 mo · ≤1 miLoading sold comps…