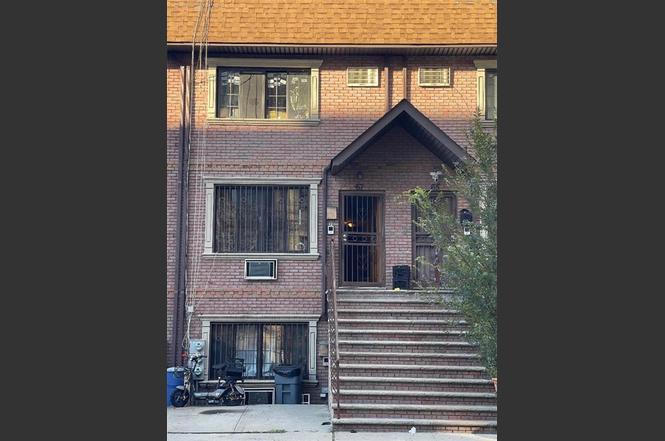
 Duplex
67 W 164th St · New York, NY
Flood risk 1/10 · Minimal
- FEMA flood zone
- X (unshaded)
- Chance of flooding over 30 yrs
- 0.0%
- Est. flood insurance / yr
- $507 – $1,088
Fire risk 1/10 · Minimal
- Est. fire insurance / yr
- $691 – $1,283
Heat risk 6/10 · Moderate
- Hot days now (above 99°F)
- 7 days/yr
- Hot days in 30 yrs
- 15 days/yr
Wind risk 6/10 · Moderate
- Chance of severe wind over 30 yrs
- 27.0%
Air-quality risk 4/10 · Minor
- Unhealthy air days now
- 5 days/yr
- Unhealthy air days in 30 yrs
- 6 days/yr
Risk factors via First Street. Map © Google.
Why this score? — see what drove the C- grade
The composite is a weighted blend of 9 inputs, each scored 0–100. Each bar is that input's sub-score; the figure is the points it added to the 100-point composite (weight × sub-score).
- Cash flow +16.5/30.0
- Appreciation +6.8/10.0
- ARV discount +5.3/15.0
- DSCR +5.1/10.0
- Schools +5.0/10.0
- Livability +3.8/5.0
- 1% rule +3.7/10.0
- Rent growth +2.5/5.0
- Condition / age +2.5/5.0
$945,000
🖨 Deal sheet 📄 Offer letter ✓ Due diligence
Multi-family units
County records classify this as Multi-Family (2-4 Unit). Listing-text estimate: 2 units. confirmed
Listing remarks
Huge 2 Family 3 Story Brick Rental Property with carport Near Yankee Stadium. First floor apartment has 2 Bathrooms and two bedrooms with a living/dining room open floor design. Second apartment is a 3 Bedroom Duplex with two and a half bathrooms with a living/dining room open floor design Cellar has two Boilers and two Hot Water Tanks. This property presents an excellent opportunity for rental income, especially given its prime location near Yankee Stadium. The two separate duplex units allow for flexibility in renting out each unit to different tenants, maximizing potential earnings. Additionally, the private driveway and modern amenities such as granite countertops and hardwood floors
Key facts
- Open floor design
- Private driveway
- Cellar
Tags
Property features AI
Finance
- Financial info: Financing options: exchange considered, bank mortgage, or cash; Two-unit multi-family property (both units month-to-month)
Exterior
- Parking: Carport with space for 1 vehicle
- Utilities: Electric: 110V with circuit breakers; Hot water from boiler; Gas supply for heating
- Home design: Attached building; Residential property; Building footprint approximately 986 sq ft; Building dimensions about 58.00 x 17.00; Zoning: R7-1
- Construction: Block and brick construction; Brick exterior; Asphalt/tar flat roof; Poured concrete foundation
- Exterior features: Front yard; Back yard
Interior
- Kitchen: Includes refrigerator and stove
- Bedrooms: Unit 1 (1st floor): 2 bedrooms; Unit 2 (2nd floor): 3 bedrooms
- Flooring: Ceramic floors; Hardwood floors
- Bathrooms: Total full bathrooms: 4; Total half bathrooms: 1; Unit 1: 2 full bathrooms; Unit 2: 2 full bathrooms and 1 half bathroom
- Heating & cooling: Gas heating; Baseboard and hot water heat delivery; 110V electrical with circuit breakers
- Interior features: Cellar (partial, unfinished); Refrigerator; Stove; Ceramic and hardwood floors; No central air units
- Laundry & utility: Hot water coil in boiler
Neighborhood map
What this means for you Summary
Snapshot
- This is a 2 × 2-bed/2.8-bath units multifamily listed at $945k.
Deal economics
- At list price, monthly cash flow is $562 ($7k/yr) — positive. Per door: $281/mo.
- The deal already cash-flows at list — no discount required.
- To meet the 1% rule (rent ≥ 1% of price), the offer needs to be $824k (12.8% below list).
- Recommended offer: $824k (12.8% below list) — sets the bar for 1% rule.
- Cap rate 7.0% vs local median 2.6% in New York — top-decile yield for the area; either an underpriced asset or a hidden risk that comps aren't pricing in. Stress-test before assuming the spread holds.
Location & tenants
- Location reads 75/100 on livability (#268 in NY, #4,188 nationally) — a middle-class / working-renter tenant base. Strengths: amenities A+, commute A+, health & safety A; Watch: crime F, cost of living F.
- Market conditions: 41 active listings in the ZIP; lower-income renter base — watch delinquency; 6,929 units permitted in Bronx County in 2024 (6,829 in 5+ unit buildings).
- At $8,240/mo this rent would consume 239% of the median local household income ($41k/yr) (locally 10080% of renters already pay >50% of income on rent) — very limited rent-growth headroom before tenants either downsize or default.
Forward outlook
- In year one you build about $40k of equity ($7k loan paydown + $33k appreciation (3.5% local appreciation)).
- Bronx County population projected at +21% by 2050 — long-run rental-demand tailwind backs the buy-and-hold thesis.
- At projected returns (3.5% appreciation + 3.0% rent growth), your $265k cash investment doubles in ~5 years — after that, you're playing with house money.
- By year 2, paydown + projected appreciation supports a ~$64k cash-out refi (75% LTV) — recoverable capital for the next deal without selling this one.
Negotiation context
- It's been on market 296 days — a 12% lower offer ($832k) is reasonable based on typical stale-listing flexibility.
- 4 sale attempts since 15y ago with the ask held roughly flat each time — persistent listings suggest the price (not the market) is what's stuck; bring a comps-based counter.
- Current owner paid $545k; list at $945k implies a 73% gain — meaningful room to come down on a strong offer.
Risks & watch-outs
- Climate carrying-cost: major wind risk, 27% chance of damaging wind over 30y; extreme-heat days projected 7→15/yr by 2055 (HVAC capex compounding) — expect insurance premiums to compound above CPI over the hold.
Questions for the listing agent
- It's been on market 296 days. Have you received any prior offers? Is the seller open to a 13% concession, seller financing, or rate buy-down credit?
- Can we see the unit-by-unit rent roll, current vacancy, and any below-market leases? What's the average tenancy length?
- What capital expenditures (roof, boiler, parking lot, exteriors) have been made in the last 5 years, and what's planned in the next 2?
- Why hasn't it sold? Are there any deal-killer items the seller is aware of (foundation, flood, title, zoning, code violations)?
- Is there a deadline driving the sale (1031 exchange, divorce, estate, relocation)? That informs how much negotiation room exists.
- Schools are B-rated — typically a magnet for longer-tenancy family renters. What's the average tenant stay here, and is there a school-zone premium baked into asking?
- Crime grade is F in this area — have there been break-ins, vandalism, or insurance claims at this property in the last 3 years? What carrier currently insures it and at what premium?
- What's the average days-on-market for RENTAL listings here right now (not sales)? A rising rental-DOM trend means longer vacancies and softer asking-rent achievability than the comps imply.
- What's the recent tenant-quality profile in this submarket — average credit score on applications, eviction rate, late-payment / NSF rate, and stable-employment percentage? A property-management company in the area should have these aggregated.
- How much new apartment / multifamily construction is in the pipeline within 1–3 miles? Heavy new supply (>2% of stock underway) typically softens rents 12–24 months out; light construction supports rent growth.
Investment metrics
- 1% rule
- 0.87% ✗
- Cap rate
- 7.01%
- Cash-on-cash
- 2.55%
- DSCR
- 1.11
- GRM
- 9.6
CMA / ARV
- ARV (on-the-fly)
- $901,790
- Comps found
- 1
Show comp detail 1 sale within ~0.75 mi
| Address | Dist | Beds/Ba | Sqft | Sold | Price | $/sf | Match |
|---|---|---|---|---|---|---|---|
| 1389 Shakespeare Ave | 0.72mi | 5/4.0 (+1) | 2,583 (-11%) | 1mo | $800,000 | $310 | 35 |
Match score weights: distance 35% · size 25% · config 20% · recency 20%. Top-matched comps best support the ARV.
Projected returns pro-forma
3.51% appreciation · 3.0% rent growth · sell at horizon
- IRR
- 11.2%
- Equity multiple
- 1.66×
- Total profit
- $175,138
- Equity at exit
- $452,316
- IRR
- 13.1%
- Equity multiple
- 3.05×
- Total profit
- $541,936
- Equity at exit
- $719,171
Cash invested: $264,600 (down + closing). Projections, not guarantees.
Landlord ↔ Tenant lean methodology
- Overall (CITY)
- 0 Strongly Tenant-Friendly
- State New York
- 15 Strongly Tenant-Friendly · D+10
- County
- — inherits STATE
- City New York
- 0 Strongly Tenant-Friendly · D+34
ZIP-level market 10452
- Home prices YoY
- 2.4%
- Active inventory
- 41
- Price-to-rent
- 19.1×
Monthly cashflow live
- Estimated rent
- $8,240 medium interval (Pro) →
- Mortgage (P&I)
- −$4,956
- Tax from tax record
- −$598 /mo · $7,182/yr
- Insurance
- −$394
- HOA
- −$0
- Vacancy / Maint / Mgmt
- −$1,730
- Net cashflow
- $562
Break-even live
2-unit breakdown (identical units grouped — click to expand)
| Units | Beds | Baths | Est. rent |
|---|---|---|---|
| 2× units | 2 | 2.8 | $8,240 |
| #1 | 2 | 2.8 | $4,120 |
| #2 | 2 | 2.8 | $4,120 |
| Total (2 units) | $8,240 | ||
UW: 25.0% down · 7.5% · 30yr · 1.5% tax · 5.0% vac · 8.0% maint · 8.0% mgmt
Financing live
Cash to close
- Down payment
- $236,250
- Closing costs
- $28,350
- Reserves months
- —
- Total cash needed
- —
Loan-product check · same deal, 3 products live
Conventional
25% down · 7.5% · 30yr
- Down + closing
- —
- Monthly P&I
- —
- Monthly cashflow
- —
- DSCR
- —
- Eligible?
- —
Personal DTI + credit; lowest rate.
DSCR
20% down · 8.5% · 30yr
- Down + closing
- —
- Monthly P&I
- —
- Monthly cashflow
- —
- DSCR
- —
- Eligible?
- —
No personal income docs; deal must DSCR.
Hard money
10% down · 12.0% · 12mo
- Down + closing
- —
- Monthly P&I
- —
- Monthly cashflow
- —
- DSCR
- —
- Eligible?
- —
Short-term bridge; refi at stabilization.
Listing history 18 events
-
2026-06-18days on market $945,000 Active 296 DOM
-
2026-06-17days on market $945,000 Active 295 DOM
-
2026-06-15days on market $945,000 Active 293 DOM
-
2026-06-13days on market $945,000 Active 291 DOM
-
2026-06-10days on market $945,000 Active 287 DOM
-
2026-06-08days on market $945,000 Active 286 DOM
-
2026-06-03days on market $945,000 Active 281 DOM
-
2026-06-01days on market $945,000 Active 279 DOM
-
2026-05-31days on market $945,000 Active 278 DOM
-
2026-01-06price $945,000
-
2025-08-26$950,000 Active
-
2013-07-09soldstatus $544,763
-
2012-03-10historical
-
2012-03-10historical
-
2012-01-10
-
2012-01-10$499,000
-
2011-12-25historical
-
2011-10-21
ⓘ Source: listings_history table (triggers on properties + properties_extension) + one-shot
backfill from property_details.listing_events for pre-trigger history.
Tax reassessment forecast NY · Partial reset (capped growth)
- Current annual tax
- $7,182 · $598/mo
- Projected year-2 tax
- $11,576 · $965/mo
- Expected delta
- +$4,394/yr (+$366/mo · 61.2%)
ⓘ Screening estimate from a state-policy table — verify with the county assessor before closing.
Climate risk First Street
- Flood 1/10 Low FEMA zone X (unshaded) · 0% chance over 30 yrs
- Wildfire 1/10 Low
- Heat 6/10 Major 7 d/yr ≥99°F today · 15 d/yr by 30 yrs out
- Wind 6/10 Major 27% chance of damaging wind over 30 yrs
- Air quality 4/10 Moderate 5 unhealthy d/yr today · 6 by 30 yrs out
Nearby sold comps map
Loading sold comps map…
Walkable amenities ~0.75 mi
Loading nearby amenities…
Taxation est. · year 1
- Rental income
- $98,880
- − Mortgage interest
- −$52,935
- − Property taxes
- −$7,182
- − Insurance
- −$4,725
- − Repairs & maintenance
- −$7,910
- − Management
- −$7,910
- − Depreciation
- −$27,491
- Taxable loss
- −$9,273
- Est. tax savings @ 24.0%
- +$2,226
- After-tax cash flow
- $8,966/yr
For passive investors: Depreciation is non-cash, so a rental often shows a tax loss while cash-flowing — sheltering income. Rental losses are passive: they offset passive income freely, and up to $25,000/yr can offset ordinary (W-2) income if you actively participate and your MAGI is under $100k (phasing out to $0 by $150k); unused losses carry forward. On sale, claimed depreciation is recaptured at up to 25%, and gains may owe capital-gains tax (a 1031 exchange can defer both). Figures are a year-1 estimate at your 24.0% rate — not tax advice; consult a CPA.
Schools (NCES district)
No district data.
Livability — New York
- Score
- 75/100
- State rank
- #268
- US rank
- #4188
Category grades
Schools grade is shown separately in the Schools card above.
Census & demographics
- Census place
- New York, NY
- County
- Bronx County · 1,197,324 people
- City population
- 7,731,280
- Metro
- New York-Newark-Jersey City, NY-NJ-PA
- Population (ZIP)
- 75,682
- Household income
- $41,288
- Rent vs Own
- Severe rent burden
- 10080.0
Population outlook (Bronx County) Hauer SSP2
- Today (2025)
- 1,607,353 people
- By 2030
- 1,681,852 · +4.6%
- By 2040
- 1,824,421 · +13.5%
- By 2050
- 1,945,470 · +21.0%
- By 2075
- 2,187,887 · +36.1%
- By 2100
- 2,244,136 · +39.6%
Race, ethnicity, and origin ACS 2023
- Neighborhood character
- Predominantly Hispanic (65%)
- Race & ethnicity
- Hispanic / Latino 65% Black 28% Two or more races 14% White 3%
- Hispanic origin (detail)
- Mexican 8% Puerto Rican 15% Dominican 34%
- Foreign-born
- 37% · Canada
- Languages at home
- 32% English-only · Spanish 58% French/Haitian/Cajun 2% Other Indo-European 1%
Political lean MEDSL · Bronx
- 2024 margin
- Solid D (+45.4) · D 72.7% · R 27.3%
- 2008→2024 swing
- -32.3pp toward R · 2008: 77.8pp · 2024: 45.4pp
- All cycles
- 2024: D+45.4 2020: D+67.6 2016: D+79.1 2012: D+82.9 2008: D+77.8
Not yet ingested
- Civics
- —
Market trends
- HPI YoY
- ▲ 3.51%
- Current HPI
- 153.1372
- Rent YoY
- —
- Metro
- New York-Newark-Jersey City, NY-NJ-PA
- State GDP YoY
- ▲ 2.60%
- F500 in state
- 92
Industry mix (Fortune 500 HQ in NY)
| Industry | F500 HQs | Revenue |
|---|---|---|
| Financial Services | 10 | $950B |
|
||
| Consumer Goods | 9 | $162B |
|
||
| Insurance | 4 | $225B |
|
||
| Telecommunications | 2 | $144B |
|
||
| Pharmaceuticals | 2 | $112B |
|
||
| Media / Entertainment | 2 | $69B |
|
||
Price history
+89.4% since first listed9 events — show timeline
- 2026-01-06 Price Changed $945,000 BNYMLS
- 2025-08-26 Listed $950,000 BNYMLS
- 2013-07-09 Sold (Public Records) $544,763 Public Records
- 2012-03-10 Listing Removed — OneKey® MLS as Distributed by MLS Grid
- 2012-03-10 Delisted — HGMLS
- 2012-01-10 Listed $499,000 OneKey® MLS as Distributed by MLS Grid
- 2012-01-10 Listed — HGMLS
- 2011-12-25 Delisted — HGMLS
- 2011-10-21 Listed — HGMLS
Property tax history
+3.7%/yrLatest (2025): $7,182 · +6.0% YoY. Source: county tax records.
Cash-flow waterfall
monthlySold comps — $/sqft
last 12 mo · ≤1 miLoading sold comps…