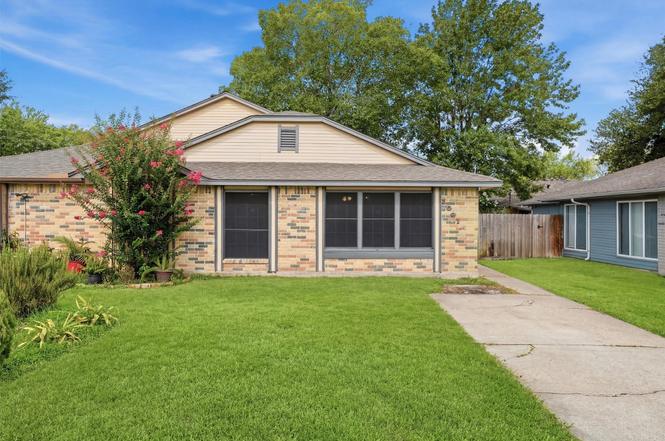
10015 Ridgecoral Dr · Houston, TX
Flood risk 5/10 · Moderate
- FEMA flood zone
- X (unshaded)
- Chance of flooding over 30 yrs
- 0.66%
- Est. flood insurance / yr
- $507 – $1,088
Fire risk 3/10 · Minor
- Est. fire insurance / yr
- $1,222 – $2,270
Heat risk 9/10 · Severe
- Hot days now (above 110°F)
- 7 days/yr
- Hot days in 30 yrs
- 24 days/yr
Wind risk 9/10 · Severe
- Chance of severe wind over 30 yrs
- 99.0%
Air-quality risk 3/10 · Minor
- Unhealthy air days now
- 3 days/yr
- Unhealthy air days in 30 yrs
- 4 days/yr
Risk factors via First Street. Map © Google.
Why this score? — see what drove the B- grade
The composite is a weighted blend of 9 inputs, each scored 0–100. Each bar is that input's sub-score; the figure is the points it added to the 100-point composite (weight × sub-score).
- Cash flow +26.2/30.0
- ARV discount +13.1/15.0
- DSCR +8.9/10.0
- 1% rule +7.7/10.0
- Livability +3.7/5.0
- Rent growth +2.5/5.0
- Condition / age +2.5/5.0
- Schools +1.5/10.0
- Appreciation +0.0/10.0
$135,000
🖨 Deal sheet 📄 Offer letter ✓ Due diligence
Listing remarks MLS
This is a duplex. Only one side of the duplex is for sell. With a nice backyard, this two bedrooms, one full bath , nicely sized family room and a nice breakfast. The kitchen is a nice size as well. has home is ready for it's new occupants. Please schedule your tour today!
Key facts
- Minutes from i-45
- 3,014 sq ft lot
- Built 1983
Tags
Property features AI
Finance
- Other: Lease not considered
- HOA & community: Ridgepoint Community Association with an annual fee of $180; Community curbs
Exterior
- Parking: No parking specified
- Security: Smoke detectors
- Utilities: Public water; Public sewer
- Home design: Residential property; Faces east; Built in 1983; Slab foundation
- Construction: Brick and cement siding construction; Composition roof; Built in 1983
- Exterior features: Private yard; Porch; Fenced backyard; Concrete road access; Subdivision setting
Interior
- Kitchen: Dishwasher; Free-standing range; Gas oven; Gas range; Microwave; Garbage disposal
- Bedrooms: Primary bedroom on the first floor (approx. 10 x 12); Second bedroom on the first floor (approx. 10 x 10); Two total rooms
- Flooring: Carpet; Tile
- Bathrooms: One full bathroom
- Heating & cooling: Central heating (gas); Central electric air conditioning; Programmable thermostat
- Interior features: Breakfast bar; Double vanity; Granite counters; Kitchen and family room combo; Tub with shower; Ceiling fans; Kitchen and dining combo; Programmable thermostat
Neighborhood map
What this means for you Summary
Snapshot
- This is a 2-bed/1.0-bath single-family listed at $135k.
Deal economics
- At list price, monthly cash flow is $345 ($4k/yr) — positive.
- The deal already cash-flows at list — no discount required.
- Meets the 1% rule at list price ($2k rent vs $135k).
- Cap rate 9.4% vs local median 3.2% in Houston — top-decile yield for the area; either an underpriced asset or a hidden risk that comps aren't pricing in. Stress-test before assuming the spread holds.
Location & tenants
- Location reads 74/100 on livability (#184 in TX, #4,771 nationally) — a middle-class / working-renter tenant base. Strengths: amenities A+, cost of living A+, housing A+; Watch: crime F.
- Aldine ISD (suburban): math 16% / reading 21% proficiency, ranked #790 of 826 in TX (top 96%) — low school quality limits family demand, transient renter base, plan for 1-2y turnover; 79% free/reduced lunch — lower-income household profile, screen leases tightly.
- Zoned schools: Stovall Middle (math 20% / reading 25%, grade F, #1,341 of 1,662 statewide, top 82%, 961 students, 95% FRL); Aldine H S (math 15% / reading 20%, grade F, #1,451 of 1,632 statewide, top 89%, 2,663 students, 94% FRL) — zoned schools average 95% FRL vs 79% district-wide (15 pts higher); higher-poverty schools than district average — tighter screening recommended.
- Market conditions: 52 active listings in the ZIP; 3 comparable units currently listed for rent nearby; rentals at typical pace (median 24d on market — plan ~3-4 weeks tenant-placement turnaround); 29,883 units permitted in Harris County in 2024 (8,621 in 5+ unit buildings).
- This rent runs 36% of the median local income ($57k/yr) — at the standard rent-burdened threshold; future hikes will face affordability resistance.
Forward outlook
- Local home prices are declining (-3.0%/yr); year-one equity from $933 of loan paydown is wiped out by about $4k of value loss. Plan a longer hold.
- Harris County population projected at +47% by 2050 — long-run rental-demand tailwind backs the buy-and-hold thesis.
- At projected returns (-3.0% appreciation + 3.0% rent growth), your $38k cash investment doubles in ~10 years — after that, you're playing with house money.
Negotiation context
- Only 2 days on market — expect competitive offers; lowballing is unlikely to land.
- 3 sale attempts since 3y ago with the ask held roughly flat each time — persistent listings suggest the price (not the market) is what's stuck; bring a comps-based counter.
Risks & watch-outs
- Climate carrying-cost: moderate flood risk; severe wind risk, 99% chance of damaging wind over 30y; extreme-heat days projected 7→24/yr by 2055 (HVAC capex compounding) — expect insurance premiums to compound above CPI over the hold.
Questions for the listing agent
- What does the HOA fee cover, when was the last increase, and are there any pending special assessments or reserve-fund shortfalls?
- Is there a deadline driving the sale (1031 exchange, divorce, estate, relocation)? That informs how much negotiation room exists.
- Schools are D-rated, which usually means shorter tenancies and higher turnover. Who's the typical renter profile here, and what's been the actual vacancy rate?
- Crime grade is F in this area — have there been break-ins, vandalism, or insurance claims at this property in the last 3 years? What carrier currently insures it and at what premium?
- What's the average days-on-market for RENTAL listings here right now (not sales)? A rising rental-DOM trend means longer vacancies and softer asking-rent achievability than the comps imply.
- What's the recent tenant-quality profile in this submarket — average credit score on applications, eviction rate, late-payment / NSF rate, and stable-employment percentage? A property-management company in the area should have these aggregated.
- How much new for-sale + rental construction is in the pipeline within 1–3 miles? Heavy new supply typically softens prices + rents 12–24 months out; constrained supply supports both.
Investment metrics
- 1% rule
- 1.27% ✓
- Cap rate
- 9.36%
- Cash-on-cash
- 10.94%
- DSCR
- 1.49
- GRM
- 6.6
CMA / ARV
- ARV (on-the-fly)
- $154,212
- Comps found
- 3
Show comp detail 3 sales within ~0.75 mi
| Address | Dist | Beds/Ba | Sqft | Sold | Price | $/sf | Match |
|---|---|---|---|---|---|---|---|
| 10003 Ridgecoral Dr | 0.03mi | 2/1.0 | 852 (0%) | 15mo | $145,000 | $170 | 86 |
| 10012 Sharpton Dr | 0.18mi | 3/2.0 (+1) | 829 (-3%) | 14mo | $149,900 | $181 | 66 |
| 1107 Progreso Dr | 0.59mi | 3/1.5 (+1) | 969 (+14%) | 17mo | $212,000 | $219 | 28 |
Match score weights: distance 35% · size 25% · config 20% · recency 20%. Top-matched comps best support the ARV.
Projected returns pro-forma
-3.0% appreciation · 3.0% rent growth · sell at horizon
- IRR
- 0.1%
- Equity multiple
- 1.00×
- Total profit
- $146
- Equity at exit
- $20,129
- IRR
- 9.8%
- Equity multiple
- 1.76×
- Total profit
- $28,687
- Equity at exit
- $11,672
Cash invested: $37,800 (down + closing). Projections, not guarantees.
Landlord ↔ Tenant lean methodology
- Overall (STATE)
- 87 Strongly Landlord-Friendly
- State Texas
- 87 Strongly Landlord-Friendly · R+5
- County
- — inherits STATE
- City
- — inherits STATE
ZIP-level market 77038
- Home prices YoY
- -20.0%
- Active inventory
- 52
- Price-to-rent
- 6.6×
Monthly cashflow live
- Estimated rent
- $1,715 medium interval (Pro) →
- Mortgage (P&I)
- −$708
- Tax from tax record
- −$231 /mo · $2,770/yr
- Insurance
- −$56
- HOA
- −$15
- Vacancy / Maint / Mgmt
- −$360
- Net cashflow
- $345
Break-even live
UW: 25.0% down · 7.5% · 30yr · 1.5% tax · 5.0% vac · 8.0% maint · 8.0% mgmt
Financing live
Cash to close
- Down payment
- $33,750
- Closing costs
- $4,050
- Reserves months
- —
- Total cash needed
- —
Loan-product check · same deal, 3 products live
Conventional
25% down · 7.5% · 30yr
- Down + closing
- —
- Monthly P&I
- —
- Monthly cashflow
- —
- DSCR
- —
- Eligible?
- —
Personal DTI + credit; lowest rate.
DSCR
20% down · 8.5% · 30yr
- Down + closing
- —
- Monthly P&I
- —
- Monthly cashflow
- —
- DSCR
- —
- Eligible?
- —
No personal income docs; deal must DSCR.
Hard money
10% down · 12.0% · 12mo
- Down + closing
- —
- Monthly P&I
- —
- Monthly cashflow
- —
- DSCR
- —
- Eligible?
- —
Short-term bridge; refi at stabilization.
Rent comps 3 comps
| Address | Beds | Baths | Sqft | Rent | $/sqft | DOM | Units | Dist |
|---|---|---|---|---|---|---|---|---|
| 1330 Blue Bell Rd Houston, TX | 2.0–3.0 | 1.0–2.0 | 1418 | $1,200 | $0.85 | 2d | 6 | 0.70mi |
| 9750 Deer Trail Dr Houston, TX | 2.0 | 2.0 | 1000 | $1,800 | $1.80 | 24d | 1 | 0.89mi |
| 9750 Deer Trail Dr Houston, TX | 3.0 | 2.0 | 1050 | $2,200 | $2.10 | 43d | 1 | 0.89mi |
HOA detail
- Monthly dues
- $15 · $180/yr
Listing history 3 events
-
2026-06-18days on market $135,000 Active 2 DOM
-
2026-06-16remarks 546-char remark
-
2026-06-16$135,000 Active 1 DOM
ⓘ Source: listings_history table (triggers on properties + properties_extension) + one-shot
backfill from property_details.listing_events for pre-trigger history.
Tax reassessment forecast TX · Resets to sale price
- Current annual tax
- $2,770 · $231/mo
- Projected year-2 tax
- $2,770 · $231/mo
- Expected delta
- $0/yr ($0/mo · 0.0%)
ⓘ Screening estimate from a state-policy table — verify with the county assessor before closing.
Climate risk First Street
- Flood 5/10 Major FEMA zone X (unshaded) · 66% chance over 30 yrs
- Wildfire 3/10 Moderate
- Heat 9/10 Extreme 7 d/yr ≥110°F today · 24 d/yr by 30 yrs out
- Wind 9/10 Extreme 99% chance of damaging wind over 30 yrs
- Air quality 3/10 Moderate 3 unhealthy d/yr today · 4 by 30 yrs out
Nearby sold comps map
Loading sold comps map…
Walkable amenities ~0.75 mi
Loading nearby amenities…
Taxation est. · year 1
- Rental income
- $20,577
- − Mortgage interest
- −$7,562
- − Property taxes
- −$2,770
- − Insurance
- −$675
- − Repairs & maintenance
- −$1,646
- − Management
- −$1,646
- − HOA
- −$180
- − Depreciation
- −$3,927
- Taxable income
- $2,170
- Est. tax owed @ 24.0%
- −$521
- After-tax cash flow
- $3,614/yr
For passive investors: Depreciation is non-cash, so a rental often shows a tax loss while cash-flowing — sheltering income. Rental losses are passive: they offset passive income freely, and up to $25,000/yr can offset ordinary (W-2) income if you actively participate and your MAGI is under $100k (phasing out to $0 by $150k); unused losses carry forward. On sale, claimed depreciation is recaptured at up to 25%, and gains may owe capital-gains tax (a 1031 exchange can defer both). Figures are a year-1 estimate at your 24.0% rate — not tax advice; consult a CPA.
Schools (NCES district)
- District
- Aldine ISD
- NCES district ID
- 4807710
- Math proficiency
- 16% ▼ -23.00%
- Reading proficiency
- 21% ▼ -11.00%
- Median HH income
- $37,081
- Composite
- 15.42/100
- National rank
- #9317
- State rank
- #790 of 826 in TX
Livability — Houston
- Score
- 74/100
- State rank
- #184
- US rank
- #4771
Category grades
Schools grade is shown separately in the Schools card above.
Census & demographics
- County
- Harris County · 4,702,590 people
- City population
- 3,226,434
- Metro
- Houston-The Woodlands-Sugar Land, TX
- Population (ZIP)
- 32,637
- Household income
- $57,232
- Rent vs Own
- Severe rent burden
- 1038.0
Population outlook (Harris County) Hauer SSP2
- Today (2025)
- 5,571,493 people
- By 2030
- 6,089,821 · +9.3%
- By 2040
- 7,142,806 · +28.2%
- By 2050
- 8,185,864 · +46.9%
- By 2075
- 10,574,329 · +89.8%
- By 2100
- 12,109,958 · +117.4%
Race, ethnicity, and origin ACS 2023
- Neighborhood character
- Predominantly Hispanic (70%)
- Race & ethnicity
- Hispanic / Latino 70% Two or more races 23% Black 21% Asian 4% White 3%
- Hispanic origin (detail)
- Mexican 52% Puerto Rican 1% Cuban 1%
- Foreign-born
- 36% · Canada, Vietnam
- Languages at home
- 32% English-only · Spanish 64% Vietnamese 3% Other Asian/Pacific 1%
Political lean MEDSL · Harris
- 2024 margin
- Lean D (+5.5) · D 52.0% · R 46.4% · Other 1.6%
- 2008→2024 swing
- +3.9pp toward D · 2008: 1.6pp · 2024: 5.5pp
- All cycles
- 2024: D+5.5 2020: D+13.3 2016: D+12.4 2012: D+0.1 2008: D+1.6
Not yet ingested
- Civics
- —
Market trends
- HPI YoY
- ▼ -69.18%
- Current HPI
- 277.0068
- Rent YoY
- —
- Metro
- Houston-The Woodlands-Sugar Land, TX
- State GDP YoY
- ▲ 3.95%
- F500 in state
- 110
Industry mix (Fortune 500 HQ in TX)
| Industry | F500 HQs | Revenue |
|---|---|---|
| Energy | 16 | $1,198B |
|
||
| Technology | 5 | $198B |
|
||
| Engineering / Construction | 4 | $72B |
|
||
| Energy Services | 3 | $60B |
|
||
| Utilities | 3 | $41B |
|
||
| Healthcare | 2 | $330B |
|
||
Price history
+8.0% since first listed8 events — show timeline
- 2026-06-16 Listed $135,000 HARMLS
- 2023-02-21 Sold (MLS) — HARMLS
- 2023-02-04 Pending — HARMLS
- 2023-01-27 Listing Removed — HARMLS
- 2023-01-27 Listed $125,000 HARMLS
- 2023-01-12 Listed $125,000 HARMLS
- 2022-12-23 Coming Soon — HARMLS
- 1988-05-08 Sold (Public Records) — Public Records
Property tax history
+9.6%/yrLatest (2025): $2,770 · +13.4% YoY. Source: county tax records.
Cash-flow waterfall
monthlySold comps — $/sqft
last 12 mo · ≤1 miLoading sold comps…