1008 W Castillo Ave · Belen, NM
Flood risk 1/10 · Minimal
- FEMA flood zone
- X (shaded)
- Chance of flooding over 30 yrs
- 0.0%
- Est. flood insurance / yr
- $507 – $1,088
Fire risk 5/10 · Moderate
- Est. fire insurance / yr
- $706 – $1,312
Heat risk 5/10 · Moderate
- Hot days now (above 99°F)
- 7 days/yr
- Hot days in 30 yrs
- 19 days/yr
Wind risk 1/10 · Minimal
- Chance of severe wind over 30 yrs
- —
Air-quality risk 1/10 · Minimal
- Unhealthy air days now
- 0 days/yr
- Unhealthy air days in 30 yrs
- 0 days/yr
Risk factors via First Street. Map © Google.
Why this score? — see what drove the D grade
The composite is a weighted blend of 9 inputs, each scored 0–100. Each bar is that input's sub-score; the figure is the points it added to the 100-point composite (weight × sub-score).
- ARV discount +13.0/15.0
- Cash flow +12.0/30.0
- DSCR +3.6/10.0
- Livability +3.2/5.0
- 1% rule +2.7/10.0
- Rent growth +2.5/5.0
- Condition / age +2.5/5.0
- Schools +2.3/10.0
- Appreciation +0.0/10.0
$170,000
🖨 Deal sheet 📄 Offer letter ✓ Due diligence
Listing remarks
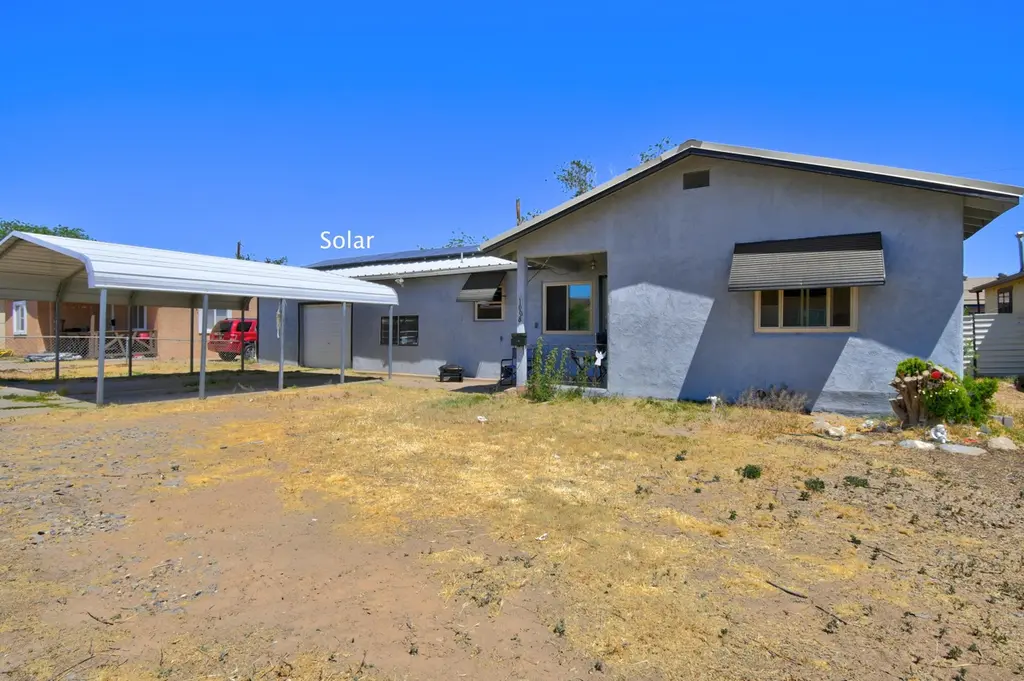
Packed with potential and recent improvements, including fresh paint throughout, some new windows, and solar to help keep costs low. The possible unfinished third bedroom or flex space offers an additional 268 sq ft not included in the listed square footage, giving buyers extra room and versatility for a variety of needs. A wonderful opportunity to make this space your own!
Key facts
- Fresh paint
- Solar
- Flex space
Tags
Property features AI
Finance
- Other: Solar energy generation
Exterior
- Parking: Attached garage (1 car); Carport (1 car)
- Utilities: Electricity connected; Natural gas connected; Public water; Public sewer
- Home design: Single-story home; Faces south; Resale property; R-1 zoning
- Construction: Block and stucco construction; Metal roof; Slab foundation; Built as existing (builder unknown)
- Exterior features: No additional exterior amenities listed; Paved road access
Interior
- Bedrooms: Space for 3 bedrooms (possible layout)
- Flooring: Wood floors
- Bathrooms: 1 full bathroom
- Heating & cooling: Wall furnace heating; Evaporative cooling
- Interior features: Double-pane insulated windows; Main-level primary bedroom
- Laundry & utility: Electric dryer hookup
Neighborhood map
What this means for you Summary
Snapshot
- This is a 2-bed/1.0-bath other listed at $170k.
Deal economics
- At list price, monthly cash flow is $-39 ($-467/yr) — negative.
- To cash-flow at today's rent, offer at most $163k (4.0% below list).
- To meet the 1% rule (rent ≥ 1% of price), the offer needs to be $130k (23.3% below list).
- Recommended offer: $130k (23.3% below list) — sets the bar for 1% rule.
- Cap rate 6.0% vs local median 3.5% in Belen — top-decile yield for the area; either an underpriced asset or a hidden risk that comps aren't pricing in. Stress-test before assuming the spread holds.
Location & tenants
- Location reads 63/100 on livability (#72 in NM) — a middle-class / working-renter tenant base. Strengths: cost of living A+, housing A, health & safety B; Watch: commute D, schools F, crime F.
- Belen Consolidated Schools (other): math 19% / reading 28% proficiency, ranked #50 of 95 in NM (top 53%) — low school quality limits family demand, transient renter base, plan for 1-2y turnover; 83% free/reduced lunch — lower-income household profile, screen leases tightly.
- Market conditions: 426 active listings in the ZIP; 3 comparable units currently listed for rent nearby; rentals at typical pace (median 19d on market — plan ~3-4 weeks tenant-placement turnaround); 303 units permitted in Valencia County in 2024 (0 in 5+ unit buildings).
- This rent runs 30% of the median local income ($52k/yr) — at the standard rent-burdened threshold; future hikes will face affordability resistance.
Forward outlook
- Local home prices are declining (-3.0%/yr); year-one equity from $1k of loan paydown is wiped out by about $5k of value loss. Plan a longer hold.
- Valencia County population projected at -14% by 2050 — secular population decline; favor cash flow + early exit over multi-decade hold.
Negotiation context
- It's been on market 23 days — a 2% lower offer ($167k) is reasonable based on typical stale-listing flexibility.
- 4 sale attempts since 11y ago with the ask held roughly flat each time — persistent listings suggest the price (not the market) is what's stuck; bring a comps-based counter.
Risks & watch-outs
- Watch-outs: built in 1950 — expect roof / HVAC / electrical / plumbing capex.
- Climate carrying-cost: moderate wildfire risk; extreme-heat days projected 7→19/yr by 2055 (HVAC capex compounding) — expect insurance premiums to compound above CPI over the hold.
Questions for the listing agent
- What do current leases actually rent for vs. the listed asking? Can we see a recent rent roll and the last 12 months of T-12 income?
- Built in 1950 — when were the roof, HVAC, electrical panel, plumbing, and water heater last replaced?
- Is there a deadline driving the sale (1031 exchange, divorce, estate, relocation)? That informs how much negotiation room exists.
- Schools are F-rated, which usually means shorter tenancies and higher turnover. Who's the typical renter profile here, and what's been the actual vacancy rate?
- Crime grade is F in this area — have there been break-ins, vandalism, or insurance claims at this property in the last 3 years? What carrier currently insures it and at what premium?
- The area grade is low — what's the realistic commute time and amenity access for the typical tenant pool here? Any planned neighborhood developments (good or bad) we should know about?
- What's the average days-on-market for RENTAL listings here right now (not sales)? A rising rental-DOM trend means longer vacancies and softer asking-rent achievability than the comps imply.
- What's the recent tenant-quality profile in this submarket — average credit score on applications, eviction rate, late-payment / NSF rate, and stable-employment percentage? A property-management company in the area should have these aggregated.
- How much new for-sale + rental construction is in the pipeline within 1–3 miles? Heavy new supply typically softens prices + rents 12–24 months out; constrained supply supports both.
Investment metrics
- 1% rule
- 0.77% ✗
- Cap rate
- 6.02%
- Cash-on-cash
- -0.98%
- DSCR
- 0.96
- GRM
- 10.9
CMA / ARV
- ARV (median comp)
- $193,657
- List price
- $170,000
- Delta
- -12.22%
- Verdict
- UNDERPRICED
- Comps
- 11 within 1.0 mi
Projected returns pro-forma
-3.0% appreciation · 3.0% rent growth · sell at horizon
- IRR
- -18.0%
- Equity multiple
- 0.37×
- Total profit
- $-30,071
- Equity at exit
- $25,348
- IRR
- -10.2%
- Equity multiple
- 0.38×
- Total profit
- $-29,562
- Equity at exit
- $14,698
Cash invested: $47,600 (down + closing). Projections, not guarantees.
Landlord ↔ Tenant lean methodology
- Overall (STATE)
- 55 Moderately Landlord-Leaning
- State New Mexico
- 55 Moderately Landlord-Leaning · D+3
- County
- — inherits STATE
- City
- — inherits STATE
ZIP-level market 87002
- Home prices YoY
- -19.0%
- Active inventory
- 426
- Price-to-rent
- 10.9×
Monthly cashflow live
- Estimated rent
- $1,303 medium interval (Pro) →
- Mortgage (P&I)
- −$891
- Tax from tax record
- −$106 /mo · $1,273/yr
- Insurance
- −$71
- HOA
- −$0
- Vacancy / Maint / Mgmt
- −$274
- Net cashflow
- $-39
Break-even live
UW: 25.0% down · 7.5% · 30yr · 1.5% tax · 5.0% vac · 8.0% maint · 8.0% mgmt
Financing live
Cash to close
- Down payment
- $42,500
- Closing costs
- $5,100
- Reserves months
- —
- Total cash needed
- —
Loan-product check · same deal, 3 products live
Conventional
25% down · 7.5% · 30yr
- Down + closing
- —
- Monthly P&I
- —
- Monthly cashflow
- —
- DSCR
- —
- Eligible?
- —
Personal DTI + credit; lowest rate.
DSCR
20% down · 8.5% · 30yr
- Down + closing
- —
- Monthly P&I
- —
- Monthly cashflow
- —
- DSCR
- —
- Eligible?
- —
No personal income docs; deal must DSCR.
Hard money
10% down · 12.0% · 12mo
- Down + closing
- —
- Monthly P&I
- —
- Monthly cashflow
- —
- DSCR
- —
- Eligible?
- —
Short-term bridge; refi at stabilization.
Rent comps 3 comps
| Address | Beds | Baths | Sqft | Rent | $/sqft | DOM | Units | Dist |
|---|---|---|---|---|---|---|---|---|
| 502 Laura Ct Belen, NM | 3.0 | 1.0 | 1060 | $1,600 | $1.51 | 43d | 1 | 0.38mi |
| 1111 Camino del Llano Belen, NM | 2.0 | 1.0 | 800 | $1,200 | $1.50 | 19d | 1 | 0.39mi |
| 530 Gabaldon Rd Unit B Belen, NM | 1.0 | 1.0 | 816 | $900 | $1.10 | 1d | 1 | 1.25mi |
Listing history 16 events
-
2026-06-07statusdays on market $170,000 Pending 23 DOM
-
2026-06-03days on market $170,000 Active 21 DOM
-
2026-06-02days on market $170,000 Active 20 DOM
-
2026-06-01days on market $170,000 Active 19 DOM
-
2026-05-31days on market $170,000 Active 18 DOM
-
2026-03-18$170,000 Active 376-char remark
-
2020-08-06soldstatus
-
2020-05-31status Pending
-
2020-05-03$75,000 Active
-
2015-08-11soldstatus
-
2015-07-13historical
-
2015-06-10status Active
-
2015-06-02historical
-
2015-05-27price $42,500
-
2015-05-13$46,900 Active
-
1999-06-28soldstatus
ⓘ Source: listings_history table (triggers on properties + properties_extension) + one-shot
backfill from property_details.listing_events for pre-trigger history.
Tax reassessment forecast NM · Resets to sale price
- Current annual tax
- $1,273 · $106/mo
- Projected year-2 tax
- $1,360 · $113/mo
- Expected delta
- +$87/yr (+$7/mo · 6.8%)
ⓘ Screening estimate from a state-policy table — verify with the county assessor before closing.
Climate risk First Street
- Flood 1/10 Low FEMA zone X (shaded) · 0% chance over 30 yrs
- Wildfire 5/10 Major
- Heat 5/10 Major 7 d/yr ≥99°F today · 19 d/yr by 30 yrs out
- Wind 1/10 Low
- Air quality 1/10 Low 0 unhealthy d/yr today · 0 by 30 yrs out
Nearby sold comps map
Loading sold comps map…
Walkable amenities ~0.75 mi
Loading nearby amenities…
Taxation est. · year 1
- Rental income
- $15,638
- − Mortgage interest
- −$9,523
- − Property taxes
- −$1,273
- − Insurance
- −$850
- − Repairs & maintenance
- −$1,251
- − Management
- −$1,251
- − Depreciation
- −$4,945
- Taxable loss
- −$3,455
- Est. tax savings @ 24.0%
- +$829
- After-tax cash flow
- $362/yr
For passive investors: Depreciation is non-cash, so a rental often shows a tax loss while cash-flowing — sheltering income. Rental losses are passive: they offset passive income freely, and up to $25,000/yr can offset ordinary (W-2) income if you actively participate and your MAGI is under $100k (phasing out to $0 by $150k); unused losses carry forward. On sale, claimed depreciation is recaptured at up to 25%, and gains may owe capital-gains tax (a 1031 exchange can defer both). Figures are a year-1 estimate at your 24.0% rate — not tax advice; consult a CPA.
Schools (NCES district)
- District
- Belen Consolidated Schools
- NCES district ID
- 3500180
- Math proficiency
- 19% —
- Reading proficiency
- 28% —
- Median HH income
- $38,445
- Composite
- 22.79/100
- National rank
- #13408
- State rank
- #50 of 95 in NM
Livability — Belen
- Score
- 63/100
- State rank
- #72
- US rank
- #14908
Category grades
Schools grade is shown separately in the Schools card above.
Census & demographics
- Census place
- Belen, NM
- County
- Valencia County · 68,779 people
- City population
- 21,265
- Metro
- Albuquerque, NM
- Population (ZIP)
- 21,265
- Household income
- $51,961
- Rent vs Own
- Severe rent burden
- 318.0
Population outlook (Valencia County) Hauer SSP2
- Today (2025)
- 73,788 people
- By 2030
- 72,101 · -2.3%
- By 2040
- 67,930 · -7.9%
- By 2050
- 63,191 · -14.4%
- By 2075
- 53,644 · -27.3%
- By 2100
- 40,882 · -44.6%
Race, ethnicity, and origin ACS 2023
- Neighborhood character
- Majority Hispanic (63%)
- Race & ethnicity
- Hispanic / Latino 63% White 31% Two or more races 28% Black 1%
- Hispanic origin (detail)
- Mexican 38%
- Common ancestry
- Slovak 2% Lithuanian 1% Iranian 1%
- Foreign-born
- 9% · Canada, Vietnam
- Languages at home
- 73% English-only · Spanish 27%
Political lean MEDSL · Valencia
- 2024 margin
- R (+16.4) · D 40.9% · R 57.3% · Other 1.8%
- 2008→2024 swing
- -24.1pp toward R · 2008: 7.7pp · 2024: -16.4pp
- All cycles
- 2024: R+16.4 2020: R+9.6 2016: R+8.7 2012: D+2.5 2008: D+7.7
Not yet ingested
- Civics
- —
Market trends
- HPI YoY
- ▼ -51.62%
- Current HPI
- 219.5581
- Rent YoY
- —
- Metro
- Albuquerque, NM
- State GDP YoY
- —
- F500 in state
- 0
Price history
+262.5% since first listed12 events — show timeline
- 2026-06-05 Pending — Southwest MLS
- 2026-03-18 Listed $170,000 Southwest MLS
- 2020-08-06 Sold (Public Records) — Public Records
- 2020-05-31 Pending — Southwest MLS
- 2020-05-03 Listed $75,000 Southwest MLS
- 2015-08-11 Sold (Public Records) — Public Records
- 2015-07-13 Delisted — Southwest MLS
- 2015-06-10 Relisted — Southwest MLS
- 2015-06-02 Delisted — Southwest MLS
- 2015-05-27 Price Changed $42,500 Southwest MLS
- 2015-05-13 Listed $46,900 Southwest MLS
- 1999-06-28 Sold (Public Records) — Public Records
Property tax history
+7.2%/yrLatest (2025): $1,273 · +25.5% YoY. Source: county tax records.
Cash-flow waterfall
monthlySold comps — $/sqft
last 12 mo · ≤1 miLoading sold comps…