 Duplex
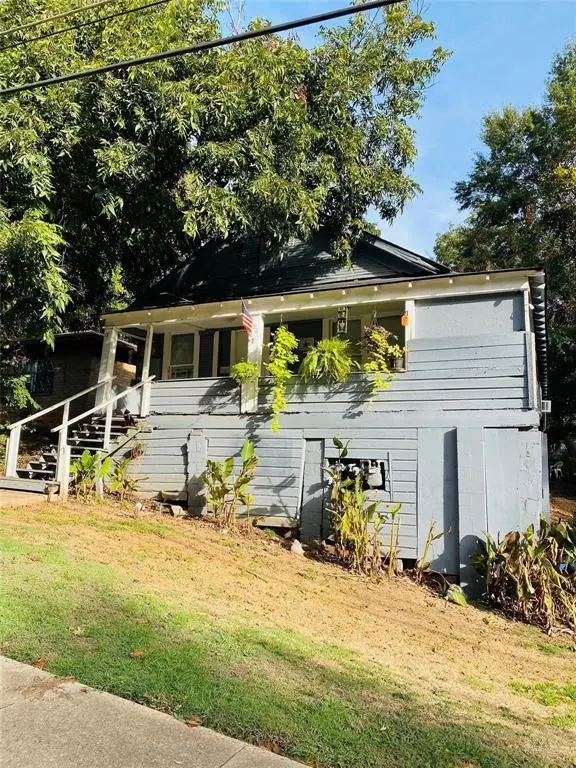
1726 Murphy St · Shreveport, LA
Flood risk 1/10 · Minimal
- FEMA flood zone
- X (unshaded)
- Chance of flooding over 30 yrs
- 0.0%
- Est. flood insurance / yr
- $507 – $1,088
Fire risk 1/10 · Minimal
- Est. fire insurance / yr
- $1,269 – $2,357
Heat risk 7/10 · Major
- Hot days now (above 110°F)
- 7 days/yr
- Hot days in 30 yrs
- 22 days/yr
Wind risk 6/10 · Moderate
- Chance of severe wind over 30 yrs
- 66.0%
Air-quality risk 2/10 · Minimal
- Unhealthy air days now
- 1 days/yr
- Unhealthy air days in 30 yrs
- 1 days/yr
Risk factors via First Street. Map © Google.
Why this score? — see what drove the D+ grade
The composite is a weighted blend of 9 inputs, each scored 0–100. Each bar is that input's sub-score; the figure is the points it added to the 100-point composite (weight × sub-score).
- Cash flow +15.0/30.0
- ARV discount +6.5/15.0
- 1% rule +5.0/10.0
- DSCR +5.0/10.0
- Appreciation +4.9/10.0
- Livability +3.0/5.0
- Rent growth +2.5/5.0
- Condition / age +2.5/5.0
- Schools +2.2/10.0
$33,000
🖨 Deal sheet 📄 Offer letter ✓ Due diligence
Multi-family units
County records classify this as Multi-Family (2-4 Unit). Listing-text estimate: 2 units. confirmed
Listing remarks MLS
REDUCED!! Duplex for sale! If you are looking to purchase investment properties for the first time or add to your portfolio you've got to look into this one! Call today for more info!
Key facts
- 4,922 sq ft lot
- 2 parking spots
- Built 1950
Neighborhood map
What this means for you Summary
Snapshot
- This is a 2 × 2-bed/2.0-bath units multifamily listed at $33k.
Deal economics
- At list price, monthly cash flow is $960 ($12k/yr) — positive. Per door: $480/mo.
- The deal already cash-flows at list — no discount required.
- Meets the 1% rule at list price ($1k rent vs $33k).
- Recommended offer: $29k (12.0% below list) — sets the bar for market timing.
- Cap rate 41.2% vs local median 5.7% in Shreveport — top-decile yield for the area; either an underpriced asset or a hidden risk that comps aren't pricing in. Stress-test before assuming the spread holds.
Location & tenants
- Location reads 59/100 on livability (#270 in LA) — a working-class tenant base; expect higher turnover. Strengths: cost of living A+, housing A; Watch: schools D+, crime F, amenities F.
- Caddo Parish (urban): math 21% / reading 32% proficiency, ranked #53 of 98 in LA (top 54%) — low school quality limits family demand, transient renter base, plan for 1-2y turnover; 64% free/reduced lunch — lower-income household profile, screen leases tightly.
- Market conditions: 69 active listings in the ZIP; 7 comparable units currently listed for rent nearby; rentals lingering (median 44d on market — plan ~5-8 weeks vacancy on turnover, expect pricing pressure); 57% of comp listings sitting > 30 days — soft ceiling on asking rent; 221 units permitted in Caddo Parish in 2024 (0 in 5+ unit buildings).
Forward outlook
- In year one you build about $173 of equity ($228 loan paydown + $-55 appreciation (-0.2% local appreciation)).
- Caddo County population projected at -15% by 2050 — secular population decline; favor cash flow + early exit over multi-decade hold.
- At projected returns (-0.2% appreciation + 3.0% rent growth), your $9k cash investment doubles in ~1 year — after that, you're playing with house money.
Negotiation context
- It's been on market 359 days — a 12% lower offer ($29k) is reasonable based on typical stale-listing flexibility.
- 7 sale attempts since 3y ago; this cycle's ask has dropped $5k (13%) from the opening price — seller is motivated, your offer sets the floor, not the list.
Risks & watch-outs
- Watch-outs: built in 1950 — expect roof / HVAC / electrical / plumbing capex.
- Climate carrying-cost: major wind risk, 66% chance of damaging wind over 30y; extreme-heat days projected 7→22/yr by 2055 (HVAC capex compounding) — expect insurance premiums to compound above CPI over the hold.
Questions for the listing agent
- It's been on market 359 days. Have you received any prior offers? Is the seller open to a 12% concession, seller financing, or rate buy-down credit?
- Can we see the unit-by-unit rent roll, current vacancy, and any below-market leases? What's the average tenancy length?
- What capital expenditures (roof, boiler, parking lot, exteriors) have been made in the last 5 years, and what's planned in the next 2?
- Built in 1950 — when were the roof, HVAC, electrical panel, plumbing, and water heater last replaced?
- Why hasn't it sold? Are there any deal-killer items the seller is aware of (foundation, flood, title, zoning, code violations)?
- Is there a deadline driving the sale (1031 exchange, divorce, estate, relocation)? That informs how much negotiation room exists.
- Schools are D-rated, which usually means shorter tenancies and higher turnover. Who's the typical renter profile here, and what's been the actual vacancy rate?
- Crime grade is F in this area — have there been break-ins, vandalism, or insurance claims at this property in the last 3 years? What carrier currently insures it and at what premium?
- The area grade is low — what's the realistic commute time and amenity access for the typical tenant pool here? Any planned neighborhood developments (good or bad) we should know about?
- What's the average days-on-market for RENTAL listings here right now (not sales)? A rising rental-DOM trend means longer vacancies and softer asking-rent achievability than the comps imply.
- What's the recent tenant-quality profile in this submarket — average credit score on applications, eviction rate, late-payment / NSF rate, and stable-employment percentage? A property-management company in the area should have these aggregated.
- How much new apartment / multifamily construction is in the pipeline within 1–3 miles? Heavy new supply (>2% of stock underway) typically softens rents 12–24 months out; light construction supports rent growth.
Investment metrics
- 1% rule
- 4.52% ✓
- Cap rate
- 41.20%
- Cash-on-cash
- 124.65%
- DSCR
- 6.55
- GRM
- 1.8
CMA / ARV
- ARV (median comp)
- $32,297
- List price
- $33,000
- Delta
- 2.18%
- Verdict
- FAIR
- Comps
- 2 within 1.0 mi
Projected returns pro-forma
-0.17% appreciation · 3.0% rent growth · sell at horizon
- IRR
- —
- Equity multiple
- 7.49×
- Total profit
- $59,926
- Equity at exit
- $9,310
- IRR
- —
- Equity multiple
- 15.61×
- Total profit
- $135,006
- Equity at exit
- $10,976
Cash invested: $9,240 (down + closing). Projections, not guarantees.
Landlord ↔ Tenant lean methodology
- Overall (STATE)
- 90 Strongly Landlord-Friendly
- State Louisiana
- 90 Strongly Landlord-Friendly · R+12
- County
- — inherits STATE
- City
- — inherits STATE
ZIP-level market 71103
- Home prices YoY
- -0.6%
- Active inventory
- 69
- Price-to-rent
- 3.7×
Monthly cashflow live
- Estimated rent
- $1,490 high interval (Pro) →
- Mortgage (P&I)
- −$173
- Tax from tax record
- −$30 /mo · $366/yr
- Insurance
- −$14
- HOA
- −$0
- Vacancy / Maint / Mgmt
- −$313
- Net cashflow
- $960
Break-even live
2-unit breakdown (identical units grouped — click to expand)
| Units | Beds | Baths | Est. rent |
|---|---|---|---|
| 2× units | 2 | 2 | $1,490 |
| #1 | 2 | 2 | $745 |
| #2 | 2 | 2 | $745 |
| Total (2 units) | $1,490 | ||
UW: 25.0% down · 7.5% · 30yr · 1.5% tax · 5.0% vac · 8.0% maint · 8.0% mgmt
Financing live
Cash to close
- Down payment
- $8,250
- Closing costs
- $990
- Reserves months
- —
- Total cash needed
- —
Loan-product check · same deal, 3 products live
Conventional
25% down · 7.5% · 30yr
- Down + closing
- —
- Monthly P&I
- —
- Monthly cashflow
- —
- DSCR
- —
- Eligible?
- —
Personal DTI + credit; lowest rate.
DSCR
20% down · 8.5% · 30yr
- Down + closing
- —
- Monthly P&I
- —
- Monthly cashflow
- —
- DSCR
- —
- Eligible?
- —
No personal income docs; deal must DSCR.
Hard money
10% down · 12.0% · 12mo
- Down + closing
- —
- Monthly P&I
- —
- Monthly cashflow
- —
- DSCR
- —
- Eligible?
- —
Short-term bridge; refi at stabilization.
Rent comps 7 comps
| Address | Beds | Baths | Sqft | Rent | $/sqft | DOM | Units | Dist |
|---|---|---|---|---|---|---|---|---|
| 2042 Laurel St Shreveport, LA | 3.0 | 1.0 | 1100 | $800 | $0.73 | 43d | 1 | 0.50mi |
| 1719 Lakeshore Dr Shreveport, LA | 3.0 | 1.5 | 1200 | $950 | $0.79 | 43d | 1 | 0.56mi |
| 1818 Perrin St Shreveport, LA | 3.0 | 1.5 | 1129 | $895 | $0.79 | 43d | 1 | 0.71mi |
| 1928 Alston St Shreveport, LA | 3.0 | 2.0 | 1100 | $750 | $0.68 | 43d | 1 | 0.93mi |
| 2811 Samford Ave Shreveport, LA | 3.0 | 1.0 | 1612 | $850 | $0.53 | 13d | 1 | 1.19mi |
| 2134 Queens Hwy Shreveport, LA | 3.0 | 1.5 | 1374 | $1,475 | $1.07 | 20d | 1 | 1.38mi |
| 2222 Carleton St Shreveport, LA | 3.0 | 2.0 | 1800 | $750 | $0.42 | 13d | 1 | 1.49mi |
Listing history 34 events
-
2026-06-18days on market $33,000 Active 359 DOM
-
2026-06-17days on market $33,000 Active 358 DOM
-
2026-06-16days on market $33,000 Active 357 DOM
-
2026-06-15days on market $33,000 Active 356 DOM
-
2026-06-14days on market $33,000 Active 354 DOM
-
2026-06-13days on market $33,000 Active 353 DOM
-
2026-06-10days on market $33,000 Active 351 DOM
-
2026-06-09days on market $33,000 Active 350 DOM
-
2026-06-08days on market $33,000 Active 349 DOM
-
2026-06-07days on market $33,000 Active 348 DOM
-
2026-06-05days on market $33,000 Active 345 DOM
-
2026-06-03days on market $33,000 Active 344 DOM
-
2026-06-02days on market $33,000 Active 343 DOM
-
2026-06-01days on market $33,000 Active 342 DOM
-
2026-05-31days on market $33,000 Active 341 DOM
-
2026-05-30days on market $33,000 Active 340 DOM
-
2026-03-10price $33,000 184-char remark
Show marketing remark (184 chars)
REDUCED!! Duplex for sale! If you are looking to purchase investment properties for the first time or add to your portfolio you've got to look into this one! Call today for more info!
-
2025-06-23$38,000 Active 184-char remark
Show marketing remark (184 chars)
REDUCED!! Duplex for sale! If you are looking to purchase investment properties for the first time or add to your portfolio you've got to look into this one! Call today for more info!
-
2025-06-11historical
-
2025-02-07$39,900 Active
-
2025-02-06historical
-
2024-12-10$39,900 Active
-
2024-11-30historical
-
2024-06-17price $49,900
-
2024-05-31$54,900 Active
-
2024-04-24historical
-
2024-04-10historical $500
-
2024-03-13$500
-
2023-11-24historical $500
-
2023-11-04$500
-
2023-10-26$54,900 Active
-
2020-06-22soldstatus $60,000
-
2018-11-19soldstatus $119,900
-
1984-05-11soldstatus
ⓘ Source: listings_history table (triggers on properties + properties_extension) + one-shot
backfill from property_details.listing_events for pre-trigger history.
Tax reassessment forecast LA · Resets to sale price
- Current annual tax
- $366 · $30/mo
- Projected year-2 tax
- $366 · $30/mo
- Expected delta
- $0/yr ($0/mo · 0.0%)
ⓘ Screening estimate from a state-policy table — verify with the county assessor before closing.
Climate risk First Street
- Flood 1/10 Low FEMA zone X (unshaded) · 0% chance over 30 yrs
- Wildfire 1/10 Low
- Heat 7/10 Severe 7 d/yr ≥110°F today · 22 d/yr by 30 yrs out
- Wind 6/10 Major 66% chance of damaging wind over 30 yrs
- Air quality 2/10 Low 1 unhealthy d/yr today · 1 by 30 yrs out
Nearby sold comps map
Loading sold comps map…
Walkable amenities ~0.75 mi
Loading nearby amenities…
Taxation est. · year 1
- Rental income
- $17,880
- − Mortgage interest
- −$1,849
- − Property taxes
- −$366
- − Insurance
- −$165
- − Repairs & maintenance
- −$1,430
- − Management
- −$1,430
- − Depreciation
- −$960
- Taxable income
- $11,680
- Est. tax owed @ 24.0%
- −$2,803
- After-tax cash flow
- $8,715/yr
For passive investors: Depreciation is non-cash, so a rental often shows a tax loss while cash-flowing — sheltering income. Rental losses are passive: they offset passive income freely, and up to $25,000/yr can offset ordinary (W-2) income if you actively participate and your MAGI is under $100k (phasing out to $0 by $150k); unused losses carry forward. On sale, claimed depreciation is recaptured at up to 25%, and gains may owe capital-gains tax (a 1031 exchange can defer both). Figures are a year-1 estimate at your 24.0% rate — not tax advice; consult a CPA.
Schools (NCES district)
- District
- Caddo Parish
- NCES district ID
- 2200300
- Math proficiency
- 21% ▼ -33.00%
- Reading proficiency
- 32% ▼ -30.00%
- Median HH income
- $39,227
- Composite
- 22.23/100
- National rank
- #8148
- State rank
- #53 of 98 in LA
Livability — Shreveport
- Score
- 59/100
- State rank
- #270
- US rank
- #19730
Category grades
Schools grade is shown separately in the Schools card above.
Census & demographics
- Census place
- Shreveport, LA
- City population
- 164,123
- Population (ZIP)
- 6,142
Population outlook (Caddo County) Hauer SSP2
- Today (2025)
- 243,190 people
- By 2030
- 237,231 · -2.5%
- By 2040
- 222,502 · -8.5%
- By 2050
- 206,516 · -15.1%
- By 2075
- 165,706 · -31.9%
- By 2100
- 122,262 · -49.7%
Race, ethnicity, and origin ACS 2023
- Neighborhood character
- Predominantly Black (81%)
- Race & ethnicity
- Black 81% White 17% Hispanic / Latino 1%
- Common ancestry
- Slovak 3% Hispanic 1%
- Languages at home
- 99% English-only · Spanish 1%
Political lean MEDSL · Caddo
- 2024 margin
- Toss-up / Even · D 51.6% · R 47.0% · Other 1.4%
- 2008→2024 swing
- +1.6pp toward D · 2008: 3.0pp · 2024: 4.6pp
- All cycles
- 2024: D+4.6 2020: D+6.8 2016: D+4.2 2012: D+4.9 2008: D+3.0
Not yet ingested
- Civics
- —
Market trends
- HPI YoY
- ▼ -0.17%
- Current HPI
- 26.3904
- Rent YoY
- —
- Metro
- —
- State GDP YoY
- ▲ 3.29%
- F500 in state
- 10
Industry mix (Fortune 500 HQ in LA)
| Industry | F500 HQs | Revenue |
|---|---|---|
| Telecommunications | 2 | $23B |
|
||
| Utilities | 1 | $12B |
|
||
| Wholesale / Distribution | 1 | $5B |
|
||
| Advertising | 1 | $2B |
|
||
Price history
-72.5% since first listed18 events — show timeline
- 2026-03-10 Price Changed $33,000 NTREIS
- 2025-06-23 Listed $38,000 NTREIS
- 2025-06-11 Listing Removed — NTREIS
- 2025-02-07 Listed $39,900 NTREIS
- 2025-02-06 Listing Removed — NTREIS
- 2024-12-10 Listed $39,900 NTREIS
- 2024-11-30 Listing Removed — NTREIS
- 2024-06-17 Price Changed $49,900 NTREIS
- 2024-05-31 Listed $54,900 NTREIS
- 2024-04-24 Listing Removed — NTREIS
- 2024-04-10 Rental Removed $500 APPFOLIO
- 2024-03-13 Listed for Rent $500 APPFOLIO
- 2023-11-24 Rental Removed $500 APPFOLIO
- 2023-11-04 Listed for Rent $500 APPFOLIO
- 2023-10-26 Listed $54,900 NTREIS
- 2020-06-22 Sold (Public Records) $60,000 Public Records
- 2018-11-19 Sold (Public Records) $119,900 Public Records
- 1984-05-11 Sold (Public Records) — Public Records
Property tax history
-0.1%/yrLatest (2025): $366 · +0.4% YoY. Source: county tax records.
Cash-flow waterfall
monthlySold comps — $/sqft
last 12 mo · ≤1 miLoading sold comps…