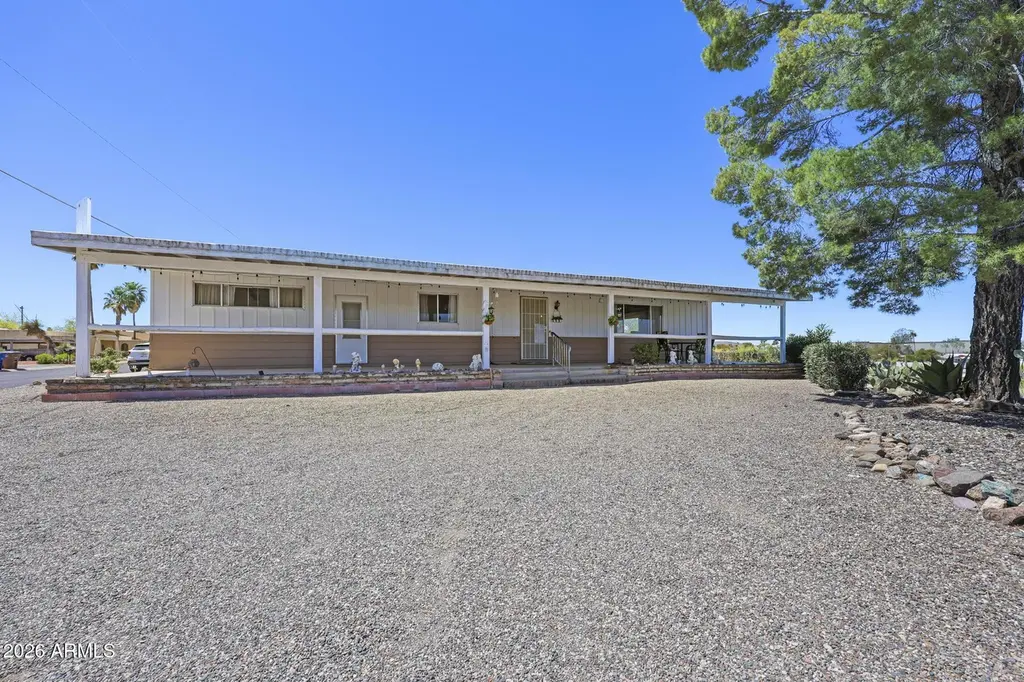
1855 W Wickenburg Way #136 · Wickenburg, AZ
Flood risk 1/10 · Minimal
- FEMA flood zone
- X (shaded)
- Chance of flooding over 30 yrs
- 0.0%
- Est. flood insurance / yr
- $507 – $1,088
Fire risk 5/10 · Moderate
- Est. fire insurance / yr
- $610 – $1,132
Heat risk 8/10 · Major
- Hot days now (above 109°F)
- 5 days/yr
- Hot days in 30 yrs
- 11 days/yr
Wind risk 1/10 · Minimal
- Chance of severe wind over 30 yrs
- —
Air-quality risk 1/10 · Minimal
- Unhealthy air days now
- 0 days/yr
- Unhealthy air days in 30 yrs
- 0 days/yr
Risk factors via First Street. Map © Google.
Why this score? — see what drove the B grade
The composite is a weighted blend of 9 inputs, each scored 0–100. Each bar is that input's sub-score; the figure is the points it added to the 100-point composite (weight × sub-score).
- Cash flow +30.0/30.0
- 1% rule +10.0/10.0
- DSCR +10.0/10.0
- ARV discount +7.5/15.0
- Condition / age +3.8/5.0
- Livability +3.5/5.0
- Schools +2.9/10.0
- Rent growth +2.5/5.0
- Appreciation +0.0/10.0
$75,000
🖨 Deal sheet 📄 Offer letter ✓ Due diligence
Listing remarks MLS
Charming Updated Home on Double Lot with Panoramic Views! Welcome to this well-maintained 3-bedroom, 2-bath home located in desirable Country Club Acres, situated on two spacious lots offering extra room, privacy, and endless possibilities. This home has been thoughtfully updated with fresh interior paint, a brand-new roof (2024), and new appliances, making it move-in ready. Inside, you'll find vaulted ceilings that create an open, airy feel throughout the living space. Step outside and enjoy breathtaking panoramic views, perfect for relaxing or entertaining. The property also features a carport for convenient covered parking and a storage shed for all your tools and extras. There is plenty of space to expand, garden, or simply enjoy the peaceful surroundings.
Key facts
- Updated
- Double lot
- Panoramic views
Tags
Neighborhood map
What this means for you Summary
Snapshot
- This is a 3-bed/2.0-bath manufactured listed at $75k. Condition is rated good.
Deal economics
- At list price, monthly cash flow is $1k ($14k/yr) — positive.
- The deal already cash-flows at list — no discount required.
- Meets the 1% rule at list price ($2k rent vs $75k).
- Recommended offer: $70k (6.0% below list) — sets the bar for market timing.
- Cap rate 25.0% vs local median 3.0% in Wickenburg — top-decile yield for the area; either an underpriced asset or a hidden risk that comps aren't pricing in. Stress-test before assuming the spread holds.
Location & tenants
- Location reads 70/100 on livability (#41 in AZ) — a middle-class / working-renter tenant base. Strengths: crime A+, housing A+, cost of living A-; Watch: schools D+, amenities F, commute F.
- Wickenburg Unified District (4236) (rural): math 33% / reading 35% proficiency, ranked #92 of 249 in AZ (top 37%) — families likely to look elsewhere, expect single-tenant / working-renter base with shorter leases.
- Market conditions: 378 active listings in the ZIP; 14 comparable units currently listed for rent nearby; rentals at typical pace (median 22d on market — plan ~3-4 weeks tenant-placement turnaround); 36,011 units permitted in Maricopa County in 2024 (12,801 in 5+ unit buildings).
- This rent runs 37% of the median local income ($69k/yr) — at the standard rent-burdened threshold; future hikes will face affordability resistance.
Forward outlook
- Local home prices are declining (-3.0%/yr); year-one equity from $519 of loan paydown is wiped out by about $2k of value loss. Plan a longer hold.
- Maricopa County population projected at +38% by 2050 — long-run rental-demand tailwind backs the buy-and-hold thesis.
- At projected returns (-3.0% appreciation + 3.0% rent growth), your $21k cash investment doubles in ~2 years — after that, you're playing with house money.
Negotiation context
- It's been on market 63 days — a 6% lower offer ($70k) is reasonable based on typical stale-listing flexibility.
Risks & watch-outs
- Climate carrying-cost: moderate wildfire risk; extreme-heat days projected 5→11/yr by 2055 (HVAC capex compounding) — expect insurance premiums to compound above CPI over the hold.
Questions for the listing agent
- It's been on market 63 days. Have you received any prior offers? Is the seller open to a 6% concession, seller financing, or rate buy-down credit?
- Built in 1971 — when were the roof, HVAC, electrical panel, plumbing, and water heater last replaced?
- Why hasn't it sold? Are there any deal-killer items the seller is aware of (foundation, flood, title, zoning, code violations)?
- Is there a deadline driving the sale (1031 exchange, divorce, estate, relocation)? That informs how much negotiation room exists.
- Schools are D-rated, which usually means shorter tenancies and higher turnover. Who's the typical renter profile here, and what's been the actual vacancy rate?
- What's the average days-on-market for RENTAL listings here right now (not sales)? A rising rental-DOM trend means longer vacancies and softer asking-rent achievability than the comps imply.
- What's the recent tenant-quality profile in this submarket — average credit score on applications, eviction rate, late-payment / NSF rate, and stable-employment percentage? A property-management company in the area should have these aggregated.
- How much new for-sale + rental construction is in the pipeline within 1–3 miles? Heavy new supply typically softens prices + rents 12–24 months out; constrained supply supports both.
Investment metrics
- 1% rule
- 2.85% ✓
- Cap rate
- 25.02%
- Cash-on-cash
- 66.89%
- DSCR
- 3.98
- GRM
- 2.9
CMA / ARV
- ARV (median comp)
- $201,301
- List price
- $75,000
- Delta
- -62.74%
- Verdict
- UNDERPRICED
- Comps
- 2 within 1.0 mi
Show comp detail 2 sales within ~0.75 mi
| Address | Dist | Beds/Ba | Sqft | Sold | Price | $/sf | Match |
|---|---|---|---|---|---|---|---|
| 725 W Smoketree Rd | 0.30mi | 2/2.0 (-1) | 1,568 (+4%) | 4mo | $210,000 | $134 | 71 |
| 2050 W Smoketree Dr | 0.34mi | 2/2.0 (-1) | 1,345 (-11%) | 23mo | $235,000 | $175 | 42 |
Match score weights: distance 35% · size 25% · config 20% · recency 20%. Top-matched comps best support the ARV.
Projected returns pro-forma
-3.0% appreciation · 3.0% rent growth · sell at horizon
- IRR
- 66.2%
- Equity multiple
- 3.97×
- Total profit
- $62,433
- Equity at exit
- $11,183
- IRR
- 70.5%
- Equity multiple
- 8.17×
- Total profit
- $150,496
- Equity at exit
- $6,485
Cash invested: $21,000 (down + closing). Projections, not guarantees.
Landlord ↔ Tenant lean methodology
- Overall (STATE)
- 87 Strongly Landlord-Friendly
- State Arizona
- 87 Strongly Landlord-Friendly · R+3
- County
- — inherits STATE
- City
- — inherits STATE
ZIP-level market 85390
- Home prices YoY
- -17.4%
- Active inventory
- 378
- Price-to-rent
- 2.9×
Monthly cashflow live
- Estimated rent
- $2,138 high interval (Pro) →
- Mortgage (P&I)
- −$393
- Tax est. 1.5%
- −$94 /mo · $1,125/yr
- Insurance
- −$31
- HOA
- −$0
- Vacancy / Maint / Mgmt
- −$449
- Net cashflow
- $1,171
Break-even live
UW: 25.0% down · 7.5% · 30yr · 1.5% tax · 5.0% vac · 8.0% maint · 8.0% mgmt
Financing live
Cash to close
- Down payment
- $18,750
- Closing costs
- $2,250
- Reserves months
- —
- Total cash needed
- —
Loan-product check · same deal, 3 products live
Conventional
25% down · 7.5% · 30yr
- Down + closing
- —
- Monthly P&I
- —
- Monthly cashflow
- —
- DSCR
- —
- Eligible?
- —
Personal DTI + credit; lowest rate.
DSCR
20% down · 8.5% · 30yr
- Down + closing
- —
- Monthly P&I
- —
- Monthly cashflow
- —
- DSCR
- —
- Eligible?
- —
No personal income docs; deal must DSCR.
Hard money
10% down · 12.0% · 12mo
- Down + closing
- —
- Monthly P&I
- —
- Monthly cashflow
- —
- DSCR
- —
- Eligible?
- —
Short-term bridge; refi at stabilization.
Rent comps 14 comps
| Address | Beds | Baths | Sqft | Rent | $/sqft | DOM | Units | Dist |
|---|---|---|---|---|---|---|---|---|
| 2110 W Terrace Dr Wickenburg, AZ | 3.0 | 2.0 | 1358 | $1,600 | $1.18 | 24d | 1 | 0.43mi |
| 2159 W Terrace Dr Wickenburg, AZ | 3.0 | 2.0 | 1304 | $2,100 | $1.61 | 43d | 1 | 0.49mi |
| 1240 Ocotillo Dr Wickenburg, AZ | 3.0 | 2.0 | 1720 | $4,500 | $2.62 | 22d | 1 | 0.96mi |
| 1240 Ocotillo Dr Wickenburg, AZ | 3.0 | 2.0 | 1720 | $4,500 | $2.62 | 10d | 1 | 0.96mi |
| 1845 Yance Dr Wickenburg, AZ | 4.0 | 2.0 | 1741 | $1,995 | $1.15 | 43d | 1 | 1.15mi |
| 1830 Yance Dr Wickenburg, AZ | 4.0 | 2.0 | 1741 | $1,835 | $1.05 | 12d | 1 | 1.18mi |
| 1850 Yance Dr Wickenburg, AZ | 4.0 | 2.0 | 1815 | $1,830 | $1.01 | 5d | 1 | 1.18mi |
| 1820 Yance Dr Wickenburg, AZ | 4.0 | 2.0 | 1815 | $1,830 | $1.01 | 22d | 1 | 1.18mi |
| 1800 Yance Dr Wickenburg, AZ | 4.0 | 2.0 | 1741 | $1,825 | $1.05 | 12d | 1 | 1.19mi |
| 1790 Yance Dr Wickenburg, AZ | 4.0 | 2.0 | 1815 | $1,815 | $1.00 | 22d | 1 | 1.19mi |
| 1780 Yance Dr Wickenburg, AZ | 3.0 | 2.0 | 1619 | $1,725 | $1.07 | 12d | 1 | 1.20mi |
| 895 Jubal Ln Wickenburg, AZ | 4.0 | 2.0 | 1815 | $3,500 | $1.93 | 43d | 1 | 1.28mi |
| 900 W Hermosa Dr Wickenburg, AZ | 3.0 | 2.0 | 1737 | $3,000 | $1.73 | 43d | 1 | 1.29mi |
| 640 Atchison Cir Wickenburg, AZ | 3.0 | 2.0 | 1611 | $3,500 | $2.17 | 43d | 1 | 1.39mi |
Listing history 15 events
-
2026-06-18days on market $75,000 Active 63 DOM
-
2026-06-17days on market $75,000 Active 62 DOM
-
2026-06-16days on market $75,000 Active 61 DOM
-
2026-06-15days on market $75,000 Active 60 DOM
-
2026-06-13days on market $75,000 Active 58 DOM
-
2026-06-13days on market $75,000 Active 57 DOM
-
2026-06-09days on market $75,000 Active 54 DOM
-
2026-06-08days on market $75,000 Active 53 DOM
-
2026-06-07days on market $75,000 Active 52 DOM
-
2026-06-04days on market $75,000 Active 49 DOM
-
2026-06-03days on market $75,000 Active 48 DOM
-
2026-06-02days on market $75,000 Active 47 DOM
-
2026-06-01days on market $75,000 Active 46 DOM
-
2026-05-31days on market $75,000 Active 45 DOM
-
2026-04-14$75,000 Active 782-char remark
Show marketing remark (782 chars)
Charming Updated Home on Double Lot with Panoramic Views! Welcome to this well-maintained 3-bedroom, 2-bath home located in desirable Country Club Acres, situated on two spacious lots offering extra room, privacy, and endless possibilities. This home has been thoughtfully updated with fresh interior paint, a brand-new roof (2024), and new appliances, making it move-in ready. Inside, you'll find vaulted ceilings that create an open, airy feel throughout the living space. Step outside and enjoy breathtaking panoramic views, perfect for relaxing or entertaining. The property also features a carport for convenient covered parking and a storage shed for all your tools and extras. There is plenty of space to expand, garden, or simply enjoy the peaceful surroundings.
ⓘ Source: listings_history table (triggers on properties + properties_extension) + one-shot
backfill from property_details.listing_events for pre-trigger history.
Climate risk First Street
- Flood 1/10 Low FEMA zone X (shaded) · 0% chance over 30 yrs
- Wildfire 5/10 Major
- Heat 8/10 Severe 5 d/yr ≥109°F today · 11 d/yr by 30 yrs out
- Wind 1/10 Low
- Air quality 1/10 Low 0 unhealthy d/yr today · 0 by 30 yrs out
Nearby sold comps map
Loading sold comps map…
Walkable amenities ~0.75 mi
Loading nearby amenities…
Taxation est. · year 1
- Rental income
- $25,654
- − Mortgage interest
- −$4,201
- − Property taxes
- −$1,125
- − Insurance
- −$375
- − Repairs & maintenance
- −$2,052
- − Management
- −$2,052
- − Depreciation
- −$2,182
- Taxable income
- $13,666
- Est. tax owed @ 24.0%
- −$3,280
- After-tax cash flow
- $10,767/yr
For passive investors: Depreciation is non-cash, so a rental often shows a tax loss while cash-flowing — sheltering income. Rental losses are passive: they offset passive income freely, and up to $25,000/yr can offset ordinary (W-2) income if you actively participate and your MAGI is under $100k (phasing out to $0 by $150k); unused losses carry forward. On sale, claimed depreciation is recaptured at up to 25%, and gains may owe capital-gains tax (a 1031 exchange can defer both). Figures are a year-1 estimate at your 24.0% rate — not tax advice; consult a CPA.
Condition & rehab AI · 12 photos
This well-maintained, updated home on a double lot offers a good condition with fresh paint, new roof, and updated appliances, making it move-in ready.
Value-add opportunities
- Resale Paint exterior siding — Enhances curb appeal
- Resale Replace gutters — Improves home's appearance and functionality
- Both Replace flooring — Fresh flooring improves both resale and rental value
Renovation cost estimate screening
Value-add ROI direction
- Resale Paint exterior siding — Enhances curb appeal ↑
- Resale Replace gutters — Improves home's appearance and functionality ↑
- Both Replace flooring — Fresh flooring improves both resale and rental value ↑
ⓘ Cost ranges are severity-bucket heuristics (US national rule-of-thumb). Get contractor quotes + a written scope before underwriting a rehab budget.
Schools (NCES district)
- District
- Wickenburg Unified District (4236)
- NCES district ID
- 0409190
- Math proficiency
- 33% ▼ -10.00%
- Reading proficiency
- 35% ▼ -7.00%
- Median HH income
- $47,369
- Composite
- 29.27/100
- National rank
- #6560
- State rank
- #92 of 249 in AZ
Livability — Wickenburg
- Score
- 70/100
- State rank
- #41
- US rank
- #7975
Category grades
Schools grade is shown separately in the Schools card above.
Census & demographics
- Census place
- Wickenburg, AZ
- County
- Maricopa County · 4,537,380 people
- City population
- 10,298
- Metro
- Phoenix-Mesa-Chandler, AZ
- Population (ZIP)
- 10,298
- Household income
- $68,591
- Rent vs Own
- Severe rent burden
- 251.0
Population outlook (Maricopa County) Hauer SSP2
- Today (2025)
- 4,979,203 people
- By 2030
- 5,378,229 · +8.0%
- By 2040
- 6,156,598 · +23.6%
- By 2050
- 6,872,376 · +38.0%
- By 2075
- 8,401,270 · +68.7%
- By 2100
- 9,247,439 · +85.7%
Race, ethnicity, and origin ACS 2023
- Neighborhood character
- Predominantly White (88%)
- Race & ethnicity
- White 88% Hispanic / Latino 7% Two or more races 4% Native American 1%
- Hispanic origin (detail)
- Mexican 5%
- Common ancestry
- Portuguese 3% Lithuanian 3% Slovak 2%
- Foreign-born
- 3% · Canada
- Languages at home
- 93% English-only · Spanish 5%
Political lean MEDSL · Maricopa
- 2024 margin
- Toss-up / Even · D 47.7% · R 51.2% · Other 1.1%
- 2008→2024 swing
- +7.1pp toward D · 2008: -10.6pp · 2024: -3.5pp
- All cycles
- 2024: R+3.5 2020: D+2.2 2016: R+3.5 2012: R+12.0 2008: R+10.6
Not yet ingested
- Civics
- —
Market trends
- HPI YoY
- ▼ -66.26%
- Current HPI
- 314.3169
- Rent YoY
- —
- Metro
- Phoenix-Mesa-Chandler, AZ
- State GDP YoY
- ▲ 4.54%
- F500 in state
- 20
Industry mix (Fortune 500 HQ in AZ)
| Industry | F500 HQs | Revenue |
|---|---|---|
| Technology | 2 | $13B |
|
||
| Mining / Metals | 1 | $23B |
|
||
| Environmental Services | 1 | $16B |
|
||
| Metals / Steel | 1 | $14B |
|
||
| Technology Distribution | 1 | $9B |
|
||
| Homebuilding | 1 | $8B |
|
||
Price history
1 event — show timeline
- 2026-04-14 Listed $75,000 ARMLS
Cash-flow waterfall
monthlySold comps — $/sqft
last 12 mo · ≤1 miLoading sold comps…