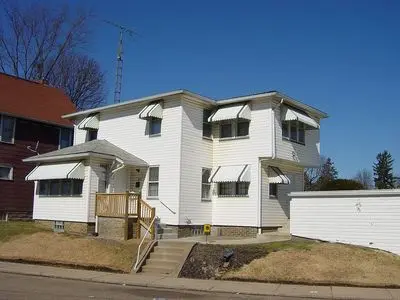
803 19th St NW · Canton, OH
Flood risk 1/10 · Minimal
- FEMA flood zone
- X (unshaded)
- Chance of flooding over 30 yrs
- 0.0%
- Est. flood insurance / yr
- $473 – $860
Fire risk 1/10 · Minimal
- Est. fire insurance / yr
- $713 – $1,323
Heat risk 3/10 · Minor
- Hot days now (above 96°F)
- 7 days/yr
- Hot days in 30 yrs
- 17 days/yr
Wind risk 1/10 · Minimal
- Chance of severe wind over 30 yrs
- —
Air-quality risk 2/10 · Minimal
- Unhealthy air days now
- 0 days/yr
- Unhealthy air days in 30 yrs
- 1 days/yr
Risk factors via First Street. Map © Google.
Why this score? — see what drove the B- grade
The composite is a weighted blend of 9 inputs, each scored 0–100. Each bar is that input's sub-score; the figure is the points it added to the 100-point composite (weight × sub-score).
- Cash flow +25.4/30.0
- ARV discount +15.0/15.0
- DSCR +8.4/10.0
- 1% rule +5.7/10.0
- Livability +3.6/5.0
- Rent growth +3.0/5.0
- Condition / age +2.5/5.0
- Schools +1.7/10.0
- Appreciation +0.0/10.0
$99,999
🖨 Deal sheet (PDF) 📄 Offer letter ✓ Due diligence
Listing remarks
This good home in Vasser Park home on 19th St NW that is in front of the St Peters cemetery has very little back yard but lots of cheerful space inside. It has 3 bedrooms (small bedroom has lots of windows and would make a great walk-in art room, music studio, closet or office), 1 full bath and a sun lit breakfast nook to the side of the kitchen. Living room opens up to window enclosed sun porch. Beautifully refinished hardwood floors throughout first and second floor, full basement with washer dryer hookups, one car garage with electric opener, ceiling fans throughout home. Security features such as glass block windows in the basement, steel entrance doors, and motion detector flood lights
Key facts
- Security features
- Full basement
- Glass block windows
Tags
Neighborhood map
What this means for you Summary
Snapshot
- This is a 3-bed/1.0-bath single-family listed at $100k.
Deal economics
- At list price, monthly cash flow is $229 ($3k/yr) — positive.
- The deal already cash-flows at list — no discount required.
- Meets the 1% rule at list price ($1k rent vs $100k).
- Recommended offer: $97k (3.0% below list) — sets the bar for market timing.
- Cap rate 9.0% vs local median 5.1% in Canton — top-decile yield for the area; either an underpriced asset or a hidden risk that comps aren't pricing in. Stress-test before assuming the spread holds.
Location & tenants
- Location reads 71/100 on livability (#441 in OH) — a middle-class / working-renter tenant base. Strengths: commute A+, cost of living A+, housing A; Watch: crime F, employment F.
- Canton City (urban): math 17% / reading 26% proficiency, ranked #627 of 656 in OH (top 96%) — low school quality limits family demand, transient renter base, plan for 1-2y turnover; 76% free/reduced lunch — lower-income household profile, screen leases tightly.
- Zoned schools: Worley Elementary School (307 students, 0% FRL); Crenshaw Middle School (math 10% / reading 19%, grade F, #630 of 654 statewide, top 97%, 774 students, 0% FRL); Mckinley High School (math 8% / reading 29%, grade F, #683 of 781 statewide, top 88%, 2,154 students, 0% FRL) — zoned schools average 0% FRL vs 76% district-wide (76 pts lower); this property's tenant base skews higher-income than the district average.
- Market conditions: Rents rising (+1.9%/yr); 74 active listings in the ZIP; 20 comparable units currently listed for rent nearby; rentals at typical pace (median 23d on market — plan ~3-4 weeks tenant-placement turnaround); 528 units permitted in Stark County in 2024 (84 in 5+ unit buildings).
Forward outlook
- Local home prices are declining (-3.0%/yr); year-one equity from $691 of loan paydown is wiped out by about $3k of value loss. Plan a longer hold.
- Stark County population projected to shrink 8% by 2050 — rents likely to lag national; underwrite the cash flow, not the appreciation.
Negotiation context
- It's been on market 40 days — a 3% lower offer ($97k) is reasonable based on typical stale-listing flexibility.
Risks & watch-outs
- Watch-outs: built in 1950 — expect roof / HVAC / electrical / plumbing capex.
Questions for the listing agent
- It's been on market 40 days. Have you received any prior offers? Is the seller open to a 3% concession, seller financing, or rate buy-down credit?
- Built in 1950 — when were the roof, HVAC, electrical panel, plumbing, and water heater last replaced?
- Is there a deadline driving the sale (1031 exchange, divorce, estate, relocation)? That informs how much negotiation room exists.
- Crime grade is F in this area — have there been break-ins, vandalism, or insurance claims at this property in the last 3 years? What carrier currently insures it and at what premium?
- What's the average days-on-market for RENTAL listings here right now (not sales)? A rising rental-DOM trend means longer vacancies and softer asking-rent achievability than the comps imply.
- What's the recent tenant-quality profile in this submarket — average credit score on applications, eviction rate, late-payment / NSF rate, and stable-employment percentage? A property-management company in the area should have these aggregated.
- How much new for-sale + rental construction is in the pipeline within 1–3 miles? Heavy new supply typically softens prices + rents 12–24 months out; constrained supply supports both.
Investment metrics
- 1% rule
- 1.07% ✓
- Cap rate
- 9.04%
- Cash-on-cash
- 9.82%
- DSCR
- 1.44
- GRM
- 7.8
CMA / ARV
- ARV (on-the-fly)
- $140,911
- Comps found
- 12
Show comp detail 12 sales within ~0.75 mi
| Address | Dist | Beds/Ba | Sqft | Sold | Price | $/sf | Match |
|---|---|---|---|---|---|---|---|
| 1729 Frazer Ave NW | 0.23mi | 3/1.0 | 1,248 (+0%) | 1mo | $195,000 | $156 | 89 |
| 1330 15th St NW | 0.54mi | 3/1.0 | 1,248 (+0%) | 1mo | $125,000 | $100 | 74 |
| 605 17th St NW | 0.22mi | 3/2.0 | 1,344 (+8%) | 2mo | $100,000 | $74 | 71 |
| 2004 Cleveland Ave NW | 0.05mi | 3/1.0 | 1,416 (+14%) | 5mo | $85,500 | $60 | 71 |
| 1403 24th St NW | 0.43mi | 3/1.0 | 1,298 (+4%) | 6mo | $150,000 | $116 | 68 |
| 1331 Louisiana Ave NW | 0.52mi | 2/1.0 (-1) | 1,252 (+0%) | 3mo | $35,000 | $28 | 68 |
| 1401 17th St NW | 0.39mi | 3/1.5 | 1,344 (+8%) | 4mo | $152,000 | $113 | 64 |
| 1419 26th St NW | 0.53mi | 3/1.0 | 1,161 (-7%) | 1mo | $135,000 | $116 | 63 |
| 1345 26th St NW | 0.51mi | 2/2.0 (-1) | 1,273 (+2%) | 5mo | $165,000 | $130 | 59 |
| 1520 NW 24th St NW | 0.47mi | 2/1.0 (-1) | 1,152 (-8%) | 3mo | $143,900 | $125 | 58 |
| 1410 Perkins Ave NW | 0.73mi | 3/1.0 | 1,344 (+8%) | 5mo | $137,500 | $102 | 48 |
| 1227 Worley Ave NW | 0.66mi | 3/2.0 | 1,092 (-12%) | 3mo | $120,000 | $110 | 42 |
Match score weights: distance 35% · size 25% · config 20% · recency 20%. Top-matched comps best support the ARV.
Projected returns pro-forma
-3.0% appreciation · 1.94% rent growth · sell at horizon
- IRR
- -2.7%
- Equity multiple
- 0.90×
- Total profit
- $-2,766
- Equity at exit
- $14,910
- IRR
- 5.9%
- Equity multiple
- 1.42×
- Total profit
- $11,736
- Equity at exit
- $8,646
Cash invested: $28,000 (down + closing). Projections, not guarantees.
Landlord ↔ Tenant lean methodology
- Overall (STATE)
- 73 Landlord-Friendly
- State Ohio
- 73 Landlord-Friendly · R+6
- County
- — inherits STATE
- City
- — inherits STATE
ZIP-level market 44709
- Rents YoY
- 1.9%
- Active inventory
- 74
- Price-to-rent
- 7.8×
Monthly cashflow live
- Estimated rent
- $1,066 high interval (Pro) →
- Mortgage (P&I)
- −$524
- Tax from tax record
- −$47 /mo · $560/yr
- Insurance
- −$42
- HOA
- −$0
- Vacancy / Maint / Mgmt
- −$224
- Net cashflow
- $229
Break-even live
Sensitivity live
| Price | -10% $286 | -5% $257 | +0% $229 | +5% $201 | +10% $173 |
|---|---|---|---|---|---|
| Rent | -10% $145 | -5% $187 | +0% $229 | +5% $271 | +10% $313 |
| Rate | -1.0pp $280 | -0.5pp $255 | base $229 | +0.5pp $203 | +1.0pp $177 |
UW: 25.0% down · 7.5% · 30yr · 1.5% tax · 5.0% vac · 8.0% maint · 8.0% mgmt
Financing live
Cash to close
- Down payment
- $25,000
- Closing costs
- $3,000
- Reserves months
- —
- Total cash needed
- —
Loan-product check · same deal, 3 products live
Conventional
25% down · 7.5% · 30yr
- Down + closing
- —
- Monthly P&I
- —
- Monthly cashflow
- —
- DSCR
- —
- Eligible?
- —
Personal DTI + credit; lowest rate.
DSCR
20% down · 8.5% · 30yr
- Down + closing
- —
- Monthly P&I
- —
- Monthly cashflow
- —
- DSCR
- —
- Eligible?
- —
No personal income docs; deal must DSCR.
Hard money
10% down · 12.0% · 12mo
- Down + closing
- —
- Monthly P&I
- —
- Monthly cashflow
- —
- DSCR
- —
- Eligible?
- —
Short-term bridge; refi at stabilization.
Rent comps 20 comps
| Address | Beds | Baths | Sqft | Rent | $/sqft | DOM | Units | Dist |
|---|---|---|---|---|---|---|---|---|
| 1029 23rd St NW Canton, OH | 3.0 | 1.0 | 1356 | $1,500 | $1.11 | 15d | 1 | 0.26mi |
| 1224 15th St NW Unit 1 Canton, OH | 2.0 | 1.0 | 900 | $749 | $0.83 | 22d | 1 | 0.46mi |
| 1008 14th St NW Canton, OH | 3.0 | 1.5 | 1100 | $898 | $0.82 | 22d | 1 | 0.51mi |
| 1421 Piper Ct NW Canton, OH | 3.0 | 1.5 | 1311 | $995 | $0.76 | 22d | 1 | 0.54mi |
| 123 17th St NW Canton, OH | 2.0 | 1.0–1.5 | 766 | $1,050 | $1.37 | 15d | 1 | 0.55mi |
| 1216 14th St NW Canton, OH | 3.0 | 1.0 | 1352 | $1,100 | $0.81 | 22d | 1 | 0.55mi |
| 1307 Woodland Ave NW Unit 2 Canton, OH | 2.0 | 1.0 | 973 | $675 | $0.69 | 45d | 1 | 0.62mi |
| 1212 Shorb Ave NW #1 Canton, OH | 2.0 | 1.0 | 832 | $850 | $1.02 | 45d | 1 | 0.70mi |
| 1629 Spring Ave NE Unit Na Canton, OH | 2.0 | 1.0 | 1100 | $836 | $0.76 | 22d | 1 | 0.78mi |
| 1613 Spring Ave NE Canton, OH | 3.0 | 1.0 | 1320 | $1,095 | $0.83 | 22d | 1 | 0.80mi |
| 1220 Market Ave N Unit 4 Canton, OH | 3.0 | 1.0 | 1400 | $1,100 | $0.79 | 45d | 1 | 0.84mi |
| 2701 Harrison Ave NW Canton, OH | 1.0–2.0 | 1.0 | 576 | $1,049 | $1.82 | 15d | 6 | 0.92mi |
| 1459 Rachel St NW Canton, OH | 1.0–2.0 | 1.0 | 750 | $950 | $1.27 | 22d | 1 | 1.10mi |
| 924 Spring Ave NE Canton, OH | 4.0 | 1.5 | 1407 | $1,395 | $0.99 | 22d | 1 | 1.26mi |
| 1206 Lawrence Rd NE Apt 3 Canton, OH | 2.0 | 1.0 | 900 | $950 | $1.06 | 22d | 1 | 1.31mi |
| 1524 Parkhill Pl NE Canton, OH | 3.0 | 1.0 | 856 | $995 | $1.16 | 45d | 1 | 1.33mi |
| 1016 2nd St NW Canton, OH | 1.0–3.0 | 1.0–2.0 | 916 | $1,050 | $1.15 | 15d | 20 | 1.34mi |
| 2901 17th St NW Canton, OH | 2.0 | 1.0 | 1000 | $885 | $0.89 | 22d | 1 | 1.34mi |
| 2018 Maple Ave NE Canton, OH | 2.0 | 1.0 | 1206 | $950 | $0.79 | 15d | 1 | 1.40mi |
| 2510 10th St NW Canton, OH | 3.0 | 1.5 | 1468 | $1,175 | $0.80 | 22d | 1 | 1.44mi |
Listing history 18 events
-
2026-06-21days on market $99,999 Active 40 DOM
-
2026-06-18days on market $99,999 Active 37 DOM
-
2026-06-17days on market $99,999 Active 36 DOM
-
2026-06-16days on market $99,999 Active 35 DOM
-
2026-06-15days on market $99,999 Active 34 DOM
-
2026-06-14days on market $99,999 Active 32 DOM
-
2026-06-13days on market $99,999 Active 31 DOM
-
2026-06-10days on market $99,999 Active 29 DOM
-
2026-06-09days on market $99,999 Active 28 DOM
-
2026-06-08days on market $99,999 Active 27 DOM
-
2026-06-07days on market $99,999 Active 26 DOM
-
2026-06-05days on market $99,999 Active 23 DOM
-
2026-06-03days on market $99,999 Active 22 DOM
-
2026-06-02days on market $99,999 Active 21 DOM
-
2026-06-01days on market $99,999 Active 20 DOM
-
2026-05-31days on market $99,999 Active 19 DOM
-
2026-05-30days on market $99,999 Active 18 DOM
-
2026-05-13$99,999 Active 797-char remark
ⓘ Source: listings_history table (triggers on properties + properties_extension) + one-shot
backfill from property_details.listing_events for pre-trigger history.
Tax reassessment forecast OH · Partial reset (capped growth)
- Current annual tax
- $560 · $47/mo
- Projected year-2 tax
- $1,060 · $88/mo
- Expected delta
- +$500/yr (+$42/mo · 89.2%)
ⓘ Screening estimate from a state-policy table — verify with the county assessor before closing.
Climate risk First Street
- Flood 1/10 Low FEMA zone X (unshaded) · 0% chance over 30 yrs
- Wildfire 1/10 Low
- Heat 3/10 Moderate 7 d/yr ≥96°F today · 17 d/yr by 30 yrs out
- Wind 1/10 Low
- Air quality 2/10 Low 0 unhealthy d/yr today · 1 by 30 yrs out
Nearby sold comps map
Loading sold comps map…
Walkable amenities ~0.75 mi
Loading nearby amenities…
Taxation est. · year 1
- Rental income
- $12,788
- − Mortgage interest
- −$5,601
- − Property taxes
- −$560
- − Insurance
- −$500
- − Repairs & maintenance
- −$1,023
- − Management
- −$1,023
- − Depreciation
- −$2,909
- Taxable income
- $1,172
- Est. tax owed @ 24.0%
- −$281
- After-tax cash flow
- $2,469/yr
For passive investors: Depreciation is non-cash, so a rental often shows a tax loss while cash-flowing — sheltering income. Rental losses are passive: they offset passive income freely, and up to $25,000/yr can offset ordinary (W-2) income if you actively participate and your MAGI is under $100k (phasing out to $0 by $150k); unused losses carry forward. On sale, claimed depreciation is recaptured at up to 25%, and gains may owe capital-gains tax (a 1031 exchange can defer both). Figures are a year-1 estimate at your 24.0% rate — not tax advice; consult a CPA.
Schools (NCES district)
- District
- Canton City
- NCES district ID
- 3904371
- Math proficiency
- 17% ▼ -17.00%
- Reading proficiency
- 26% ▼ -12.00%
- Median HH income
- $28,825
- Composite
- 17.1/100
- National rank
- #9116
- State rank
- #627 of 656 in OH
Livability — Canton
- Score
- 71/100
- State rank
- #441
- US rank
- #7259
Category grades
Schools grade is shown separately in the Schools card above.
Census & demographics
- Census place
- Canton, OH
- County
- Stark County · 272,865 people
- City population
- 103,614
- Metro
- Canton-Massillon, OH
- Population (ZIP)
- 18,614
- Household income
- $57,842
- Rent vs Own
- Severe rent burden
- 859.0
Population outlook (Stark County) Hauer SSP2
- Today (2025)
- 373,708 people
- By 2030
- 371,245 · -0.7%
- By 2040
- 361,331 · -3.3%
- By 2050
- 345,290 · -7.6%
- By 2075
- 302,669 · -19.0%
- By 2100
- 238,870 · -36.1%
Race, ethnicity, and origin ACS 2023
- Neighborhood character
- Predominantly White (74%)
- Race & ethnicity
- White 74% Black 14% Two or more races 6% Hispanic / Latino 5% Asian 1%
- Hispanic origin (detail)
- Puerto Rican 4%
- Common ancestry
- Lithuanian 4% Italian 3% Romanian 3%
- Foreign-born
- 3% · Canada
- Languages at home
- 94% English-only · Spanish 4% Other Indo-European 1% Other Asian/Pacific 1%
Political lean MEDSL · Stark
- 2024 margin
- Strong R (+21.9) · D 38.6% · R 60.5%
- 2008→2024 swing
- -27.4pp toward R · 2008: 5.5pp · 2024: -21.9pp
- All cycles
- 2024: R+21.9 2020: R+18.5 2016: R+17.4 2012: R+0.4 2008: D+5.5
Not yet ingested
- Civics
- —
Market trends
- HPI YoY
- ▼ -140.56%
- Current HPI
- 195.6245
- Rent YoY
- ▲ 1.94%
- Metro
- Canton-Massillon, OH
- State GDP YoY
- ▲ 1.98%
- F500 in state
- 48
Industry mix (Fortune 500 HQ in OH)
| Industry | F500 HQs | Revenue |
|---|---|---|
| Insurance | 3 | $145B |
|
||
| Industrial Machinery | 3 | $49B |
|
||
| Financial Services | 3 | $24B |
|
||
| Consumer Goods | 2 | $93B |
|
||
| Aerospace / Defense | 2 | $47B |
|
||
| Utilities | 2 | $33B |
|
||
Price history
1 event — show timeline
- 2026-05-13 Listed $99,999 FSBO.com
Property tax history
-5.4%/yrLatest (2024): $560 · +124.2% YoY. Source: county tax records.
Cash-flow waterfall
monthlySold comps — $/sqft
last 12 mo · ≤1 miLoading sold comps…