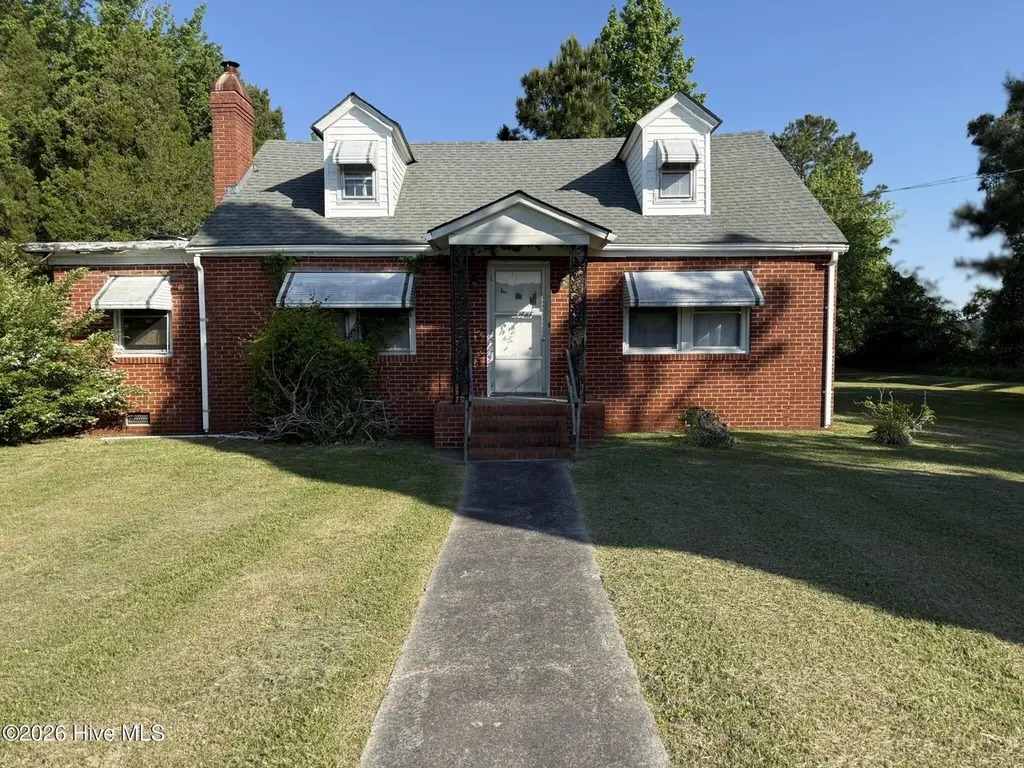
31111 Us 264 Hwy · Belhaven, NC
Flood risk 9/10 · Severe
- FEMA flood zone
- AE
- Chance of flooding over 30 yrs
- 0.99%
- Est. flood insurance / yr
- $1,737 – $8,500
Fire risk 3/10 · Minor
- Est. fire insurance / yr
- $906 – $1,684
Heat risk 9/10 · Severe
- Hot days now (above 107°F)
- 7 days/yr
- Hot days in 30 yrs
- 19 days/yr
Wind risk 8/10 · Major
- Chance of severe wind over 30 yrs
- 99.0%
Air-quality risk 2/10 · Minimal
- Unhealthy air days now
- 0 days/yr
- Unhealthy air days in 30 yrs
- 1 days/yr
Risk factors via First Street. Map © Google.
Why this score? — see what drove the C+ grade
The composite is a weighted blend of 9 inputs, each scored 0–100. Each bar is that input's sub-score; the figure is the points it added to the 100-point composite (weight × sub-score).
- Cash flow +30.0/30.0
- DSCR +10.0/10.0
- 1% rule +8.6/10.0
- Livability +3.5/5.0
- Schools +3.4/10.0
- Rent growth +2.5/5.0
- Condition / age +2.5/5.0
- ARV discount +0.0/15.0
- Appreciation +0.0/10.0
$88,000
🖨 Deal sheet (PDF) 📄 Offer letter ✓ Due diligence
Listing remarks MLS
Hardwood floors, screen porch. Formal DR. Big lvg rm. 1 bed down, 2 up. Two acres of land. Sold as is. Seller makes no repairs. HUD, its agents and/or assigns make no representation as to the existence of mold, radon, or lead-based paint and is not liable for the potentially harmful effects thereof
Key facts
- 2-acre property
- Rural setting
- 2 acre lot
Tags
Property features AI
Exterior
- Parking: On-site concrete parking
- Utilities: Public water; Septic tank sewer; Utilities: see remarks
- Home design: Single-family residential home; One and one-half levels; Entry at level 1; Brick and frame construction
- Construction: Brick and frame construction; Brick/mortar foundation; Flat and shingle roof
- Exterior features: Rear porch; No additional exterior features listed; Property has a view
Interior
- Kitchen: No appliances listed
- Bedrooms: Total of 4 rooms (bedroom count not explicitly listed)
- Flooring: Hardwood floors
- Bathrooms: 1 full bathroom
- Heating & cooling: Has heating; Wood heating and fireplace(s); Has cooling; Wall/window unit(s)
- Interior features: Window coverings; Unfurnished; No built-in appliances listed; Crawl space basement (no finished basement)
- Laundry & utility: No laundry appliances listed
Neighborhood map
What this means for you Summary
Snapshot
- This is a 3-bed/1.0-bath single-family listed at $88k.
Deal economics
- At list price, monthly cash flow is $-42 ($-505/yr) — negative.
- To cash-flow at today's rent, offer at most $81k (8.4% below list).
- Meets the 1% rule at list price ($1k rent vs $88k).
- Recommended offer: $81k (8.4% below list) — sets the bar for cash-flow.
- Cap rate 11.5% vs local median 0.8% in Belhaven — top-decile yield for the area; either an underpriced asset or a hidden risk that comps aren't pricing in. Stress-test before assuming the spread holds.
Location & tenants
- Location reads 70/100 on livability (#127 in NC) — a middle-class / working-renter tenant base. Strengths: cost of living A+, health & safety A+, crime A; Watch: amenities F, commute F, employment F.
- Beaufort County Schools (rural): math 39% / reading 42% proficiency, ranked #112 of 178 in NC (top 63%) — families likely to look elsewhere, expect single-tenant / working-renter base with shorter leases; 67% free/reduced lunch — lower-income household profile, screen leases tightly.
- Zoned schools: Northeast Elementary (math 33% / reading 31%, grade F, #908 of 1,410 statewide, top 67%, 388 students, 99% FRL); Northside High (math 54% / reading 52%, grade C-, #280 of 535 statewide, top 52%, 376 students, 99% FRL) — zoned schools average 99% FRL vs 67% district-wide (32 pts higher); higher-poverty schools than district average — tighter screening recommended.
- Market conditions: 126 active listings in the ZIP; 1 comparable units currently listed for rent nearby; 216 units permitted in Beaufort County in 2024 (0 in 5+ unit buildings).
Forward outlook
- Local home prices are declining (-3.0%/yr); year-one equity from $608 of loan paydown is wiped out by about $3k of value loss. Plan a longer hold.
- Beaufort County population projected at -10% by 2050 — secular population decline; favor cash flow + early exit over multi-decade hold.
Negotiation context
- It's been on market 26 days — a 2% lower offer ($87k) is reasonable based on typical stale-listing flexibility.
- 2 sale attempts since 12y ago with the ask held roughly flat each time — persistent listings suggest the price (not the market) is what's stuck; bring a comps-based counter.
- Current owner paid $21k; list at $88k implies a 315% gain — meaningful room to come down on a strong offer.
Risks & watch-outs
- Watch-outs: flood insurance adds $427/mo; built in 1946 — expect roof / HVAC / electrical / plumbing capex.
- Climate carrying-cost: in FEMA flood zone AE (mandatory federal flood insurance); severe wind risk, 99% chance of damaging wind over 30y; extreme-heat days projected 7→19/yr by 2055 (HVAC capex compounding) — expect insurance premiums to compound above CPI over the hold.
Questions for the listing agent
- What do current leases actually rent for vs. the listed asking? Can we see a recent rent roll and the last 12 months of T-12 income?
- Built in 1946 — when were the roof, HVAC, electrical panel, plumbing, and water heater last replaced?
- What's the actual annual flood-insurance premium (NFIP or private), and is the property in a SFHA with mandatory coverage?
- Is there a deadline driving the sale (1031 exchange, divorce, estate, relocation)? That informs how much negotiation room exists.
- Schools are F-rated, which usually means shorter tenancies and higher turnover. Who's the typical renter profile here, and what's been the actual vacancy rate?
- What's the average days-on-market for RENTAL listings here right now (not sales)? A rising rental-DOM trend means longer vacancies and softer asking-rent achievability than the comps imply.
- What's the recent tenant-quality profile in this submarket — average credit score on applications, eviction rate, late-payment / NSF rate, and stable-employment percentage? A property-management company in the area should have these aggregated.
- How much new for-sale + rental construction is in the pipeline within 1–3 miles? Heavy new supply typically softens prices + rents 12–24 months out; constrained supply supports both.
Investment metrics
- 1% rule
- 1.36% ✓
- Cap rate
- 11.54%
- Cash-on-cash
- 18.73%
- DSCR
- 1.83
- GRM
- 6.1
CMA / ARV
- ARV (on-the-fly)
- $71,424
- Comps found
- 3
Show comp detail 3 sales within ~0.75 mi
| Address | Dist | Beds/Ba | Sqft | Sold | Price | $/sf | Match |
|---|---|---|---|---|---|---|---|
| 996 Pamlico St | 0.14mi | 3/2.0 | 1,560 (+5%) | 8mo | $75,000 | $48 | 75 |
| 240 E Old County Rd | 0.26mi | 2/1.0 (-1) | 1,425 (-4%) | 21mo | $46,000 | $32 | 59 |
| 374 Cedar St | 0.72mi | 3/2.0 | 1,408 (-5%) | 9mo | $167,500 | $119 | 46 |
Match score weights: distance 35% · size 25% · config 20% · recency 20%. Top-matched comps best support the ARV.
Projected returns pro-forma
-3.0% appreciation · 3.0% rent growth · sell at horizon
- IRR
- -19.3%
- Equity multiple
- 0.32×
- Total profit
- $-16,685
- Equity at exit
- $13,121
- IRR
- -11.3%
- Equity multiple
- 0.31×
- Total profit
- $-16,950
- Equity at exit
- $7,609
Cash invested: $24,640 (down + closing). Projections, not guarantees.
Landlord ↔ Tenant lean methodology
- Overall (STATE)
- 85 Strongly Landlord-Friendly
- State North Carolina
- 85 Strongly Landlord-Friendly · R+3
- County
- — inherits STATE
- City
- — inherits STATE
ZIP-level market 27810
- Home prices YoY
- -24.1%
- Active inventory
- 126
- Price-to-rent
- 6.1×
Monthly cashflow live
- Estimated rent
- $1,200 medium interval (Pro) →
- Mortgage (P&I)
- −$461
- Tax from tax record
- −$65 /mo · $784/yr
- Insurance
- −$37
- Flood insurance flood zone
- −$427 /mo · $5,118/yr
- HOA
- −$0
- Vacancy / Maint / Mgmt
- −$252
- Net cashflow
- $-42
Break-even live
Sensitivity live
| Price | -10% $8 | -5% $-17 | +0% $-42 | +5% $-67 | +10% $-92 |
|---|---|---|---|---|---|
| Rent | -10% $-137 | -5% $-89 | +0% $-42 | +5% $5 | +10% $53 |
| Rate | -1.0pp $2 | -0.5pp $-20 | base $-42 | +0.5pp $-65 | +1.0pp $-88 |
UW: 25.0% down · 7.5% · 30yr · 1.5% tax · 5.0% vac · 8.0% maint · 8.0% mgmt
Financing live
Cash to close
- Down payment
- $22,000
- Closing costs
- $2,640
- Reserves months
- —
- Total cash needed
- —
Loan-product check · same deal, 3 products live
Conventional
25% down · 7.5% · 30yr
- Down + closing
- —
- Monthly P&I
- —
- Monthly cashflow
- —
- DSCR
- —
- Eligible?
- —
Personal DTI + credit; lowest rate.
DSCR
20% down · 8.5% · 30yr
- Down + closing
- —
- Monthly P&I
- —
- Monthly cashflow
- —
- DSCR
- —
- Eligible?
- —
No personal income docs; deal must DSCR.
Hard money
10% down · 12.0% · 12mo
- Down + closing
- —
- Monthly P&I
- —
- Monthly cashflow
- —
- DSCR
- —
- Eligible?
- —
Short-term bridge; refi at stabilization.
Rent comps 1 comps
| Address | Beds | Baths | Sqft | Rent | $/sqft | DOM | Units | Dist |
|---|---|---|---|---|---|---|---|---|
| 728 Elm St Belhaven, NC | 3.0 | 2.0 | 1200 | $1,200 | $1.00 | 22d | 1 | 0.37mi |
Listing history 20 events
-
2026-06-22days on market $88,000 Active 26 DOM
-
2026-06-19days on market $88,000 Active 24 DOM
-
2026-06-18days on market $88,000 Active 23 DOM
-
2026-06-17days on market $88,000 Active 22 DOM
-
2026-06-16days on market $88,000 Active 21 DOM
-
2026-06-15days on market $88,000 Active 20 DOM
-
2026-06-14days on market $88,000 Active 18 DOM
-
2026-06-13days on market $88,000 Active 17 DOM
-
2026-06-10days on market $88,000 Active 15 DOM
-
2026-06-09days on market $88,000 Active 14 DOM
-
2026-06-08days on market $88,000 Active 13 DOM
-
2026-06-07days on market $88,000 Active 12 DOM
-
2026-06-03days on market $88,000 Active 8 DOM
-
2026-06-02days on market $88,000 Active 7 DOM
-
2026-06-01days on market $88,000 Active 6 DOM
-
2026-05-31days on market $88,000 Active 5 DOM
-
2026-05-30days on market $88,000 Active 4 DOM
-
2026-05-26$88,000 Active
-
2014-04-08soldstatus $21,200 299-char remark
Show marketing remark (299 chars)
Hardwood floors, screen porch. Formal DR. Big lvg rm. 1 bed down, 2 up. Two acres of land. Sold as is. Seller makes no repairs. HUD, its agents and/or assigns make no representation as to the existence of mold, radon, or lead-based paint and is not liable for the potentially harmful effects thereof
-
2014-02-14$22,000 299-char remark
Show marketing remark (299 chars)
Hardwood floors, screen porch. Formal DR. Big lvg rm. 1 bed down, 2 up. Two acres of land. Sold as is. Seller makes no repairs. HUD, its agents and/or assigns make no representation as to the existence of mold, radon, or lead-based paint and is not liable for the potentially harmful effects thereof
ⓘ Source: listings_history table (triggers on properties + properties_extension) + one-shot
backfill from property_details.listing_events for pre-trigger history.
Tax reassessment forecast NC · Resets to sale price
- Current annual tax
- $784 · $65/mo
- Projected year-2 tax
- $784 · $65/mo
- Expected delta
- $0/yr ($0/mo · 0.0%)
ⓘ Screening estimate from a state-policy table — verify with the county assessor before closing.
Climate risk First Street
- Flood 9/10 Extreme FEMA zone AE · 99% chance over 30 yrs
- Wildfire 3/10 Moderate
- Heat 9/10 Extreme 7 d/yr ≥107°F today · 19 d/yr by 30 yrs out
- Wind 8/10 Severe 99% chance of damaging wind over 30 yrs
- Air quality 2/10 Low 0 unhealthy d/yr today · 1 by 30 yrs out
Nearby sold comps map
Loading sold comps map…
Walkable amenities ~0.75 mi
Loading nearby amenities…
Taxation est. · year 1
- Rental income
- $14,400
- − Mortgage interest
- −$4,929
- − Property taxes
- −$784
- − Insurance
- −$5,558
- − Repairs & maintenance
- −$1,152
- − Management
- −$1,152
- − Depreciation
- −$2,560
- Taxable loss
- −$1,736
- Est. tax savings @ 24.0%
- +$417
- After-tax cash flow
- $-88/yr
For passive investors: Depreciation is non-cash, so a rental often shows a tax loss while cash-flowing — sheltering income. Rental losses are passive: they offset passive income freely, and up to $25,000/yr can offset ordinary (W-2) income if you actively participate and your MAGI is under $100k (phasing out to $0 by $150k); unused losses carry forward. On sale, claimed depreciation is recaptured at up to 25%, and gains may owe capital-gains tax (a 1031 exchange can defer both). Figures are a year-1 estimate at your 24.0% rate — not tax advice; consult a CPA.
Schools (NCES district)
- District
- Beaufort County Schools
- NCES district ID
- 3700330
- Math proficiency
- 39% ▬ 0.00%
- Reading proficiency
- 42% ▲ 3.00%
- Median HH income
- $40,486
- Composite
- 33.99/100
- National rank
- #5320
- State rank
- #112 of 178 in NC
Livability — Belhaven
- Score
- 70/100
- State rank
- #127
- US rank
- #7447
Category grades
Schools grade is shown separately in the Schools card above.
Census & demographics
- Population (ZIP)
- 3,637
Population outlook (Beaufort County) Hauer SSP2
- Today (2025)
- 47,069 people
- By 2030
- 46,417 · -1.4%
- By 2040
- 44,455 · -5.6%
- By 2050
- 42,239 · -10.3%
- By 2075
- 37,349 · -20.7%
- By 2100
- 32,434 · -31.1%
Race, ethnicity, and origin ACS 2023
- Neighborhood character
- Predominantly White (74%)
- Race & ethnicity
- White 74% Black 20% Hispanic / Latino 5% Two or more races 3% Native American 1%
- Common ancestry
- Italian 5% Serbian 3% Iranian 3%
- Foreign-born
- 2% · Canada
- Languages at home
- 96% English-only · Spanish 3%
Political lean MEDSL · Beaufort
- 2024 margin
- Solid R (+31.1) · D 34.1% · R 65.2%
- 2008→2024 swing
- -13.7pp toward R · 2008: -17.4pp · 2024: -31.1pp
- All cycles
- 2024: R+31.1 2020: R+25.9 2016: R+24.5 2012: R+19.3 2008: R+17.4
Not yet ingested
- Civics
- —
Market trends
- HPI YoY
- ▼ -55.05%
- Current HPI
- 173.3725
- Rent YoY
- —
- Metro
- —
- State GDP YoY
- ▲ 3.28%
- F500 in state
- 26
Industry mix (Fortune 500 HQ in NC)
| Industry | F500 HQs | Revenue |
|---|---|---|
| Financial Services | 2 | $213B |
|
||
| Retail | 2 | $95B |
|
||
| Industrial Conglomerate | 1 | $38B |
|
||
| Metals / Steel | 1 | $35B |
|
||
| Utilities | 1 | $30B |
|
||
| Industrial Machinery | 1 | $19B |
|
||
Price history
+300.0% since first listed3 events — show timeline
- 2026-05-26 Listed $88,000 Hive MLS
- 2014-04-08 Sold (MLS) $21,200 Hive MLS
- 2014-02-14 Listed $22,000 Hive MLS
Property tax history
+3.1%/yrLatest (2025): $784 · +89.3% YoY. Source: county tax records.
Cash-flow waterfall
monthlySold comps — $/sqft
last 12 mo · ≤1 miLoading sold comps…