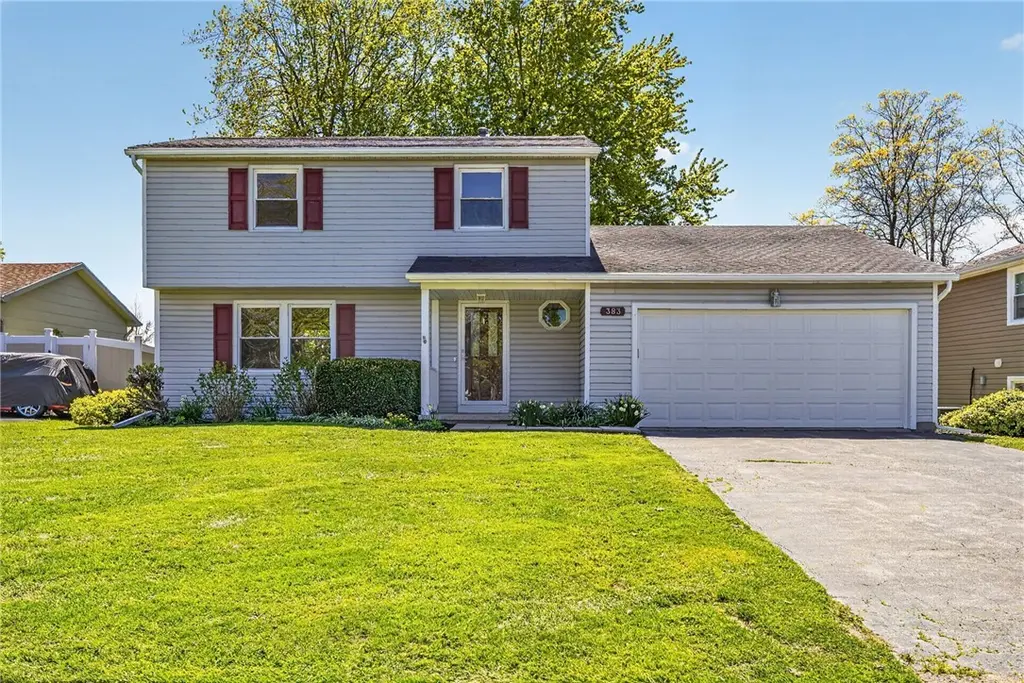
383 Pebbleview Dr · Rochester, NY
Flood risk 1/10 · Minimal
- FEMA flood zone
- X (unshaded)
- Chance of flooding over 30 yrs
- 0.0%
- Est. flood insurance / yr
- $473 – $860
Fire risk 1/10 · Minimal
- Est. fire insurance / yr
- $691 – $1,283
Heat risk 2/10 · Minimal
- Hot days now (above 95°F)
- 7 days/yr
- Hot days in 30 yrs
- 16 days/yr
Wind risk 1/10 · Minimal
- Chance of severe wind over 30 yrs
- —
Air-quality risk 2/10 · Minimal
- Unhealthy air days now
- 1 days/yr
- Unhealthy air days in 30 yrs
- 1 days/yr
Risk factors via First Street. Map © Google.
Why this score? — see what drove the D- grade
The composite is a weighted blend of 9 inputs, each scored 0–100. Each bar is that input's sub-score; the figure is the points it added to the 100-point composite (weight × sub-score).
- ARV discount +14.0/15.0
- Cash flow +5.3/30.0
- Rent growth +3.8/5.0
- Livability +3.8/5.0
- 1% rule +3.3/10.0
- Schools +3.2/10.0
- Condition / age +2.5/5.0
- DSCR +0.0/10.0
- Appreciation +0.0/10.0
$225,900
🖨 Deal sheet (PDF) 📄 Offer letter ✓ Due diligence
Listing remarks
Welcome home! this charming 3 bedroom, 1 & 1.5 bath home. It is a spacious 1,288 sq. ft. Colonial with living room, formal dining room and eat in kitchen. There is a full basement and attached two car garage. Has a 19.5 x 14 ft deck overlooks beautiful backyard yard, perfect for hot tub and fun barbecues! Sale includes all appliances. New furnace 4/2026, hot water heater 2021.Delayed Negotiations until May 20/2026 @ 2pm. Offer due by 1pm on 5/20/2026. House to be sold in as condition.
Key facts
- New furnace
- Hot water heater
- Full basement
Tags
Property features AI
Finance
- HOA & community: Community trails/paths
Exterior
- Parking: Attached garage; Driveway; Garage with 2 spaces
- Utilities: Public water (connected); Sewer connected; Electric with circuit breakers
- Home design: Two-story home; Existing (resale) property; Block foundation; Facing direction not specified
- Construction: Vinyl siding; Copper plumbing; Asphalt shingle roof; Built as existing (year built details not specific)
- Exterior features: Blacktop driveway; Deck; Fully fenced yard; Rectangular lot; Road frontage on a main thoroughfare; Lot dimensions approximately 59 x 120
Interior
- Kitchen: Dishwasher; Gas cooktop; Gas oven; Gas range; Microwave; Refrigerator; Eat-in kitchen
- Bedrooms: Total rooms include living areas and laundry (6 total rooms) — bedrooms not specifically listed
- Flooring: Carpet; Vinyl; Varied flooring
- Bathrooms: 1 full bathroom; 1 half bathroom; 1 main-level bathroom
- Heating & cooling: Gas forced-air heating; Central air conditioning
- Interior features: Ceiling fan(s); Eat-in kitchen; Separate/formal living room; Living/dining room; Programmable thermostat; Thermal windows
- Laundry & utility: Washer; Dryer; Laundry in basement; Gas water heater
Neighborhood map
What this means for you Summary
Snapshot
- This is a 3-bed/1.5-bath single-family listed at $226k.
Deal economics
- At list price, monthly cash flow is $-500 ($-6k/yr) — negative.
- To cash-flow at today's rent, offer at most $170k (24.8% below list).
- To meet the 1% rule (rent ≥ 1% of price), the offer needs to be $188k (16.7% below list).
- Recommended offer: $170k (24.8% below list) — sets the bar for cash-flow.
- Cap rate 3.6% vs local median 9.3% in Rochester — below-typical yield; the buyer is paying a premium for something (appreciation thesis, condition, location) that the cap rate doesn't capture.
Location & tenants
- Location reads 76/100 on livability (#222 in NY, #3,482 nationally) — a middle-class / working-renter tenant base. Strengths: commute A+, cost of living A+, housing A+; Watch: schools D+, crime F, employment F.
- Greece Central School District (suburban): math 35% / reading 39% proficiency, ranked #544 of 590 in NY (top 92%) — families likely to look elsewhere, expect single-tenant / working-renter base with shorter leases.
- Market conditions: Rents rising fast (+5.4%/yr); 130 active listings in the ZIP; 12 comparable units currently listed for rent nearby; rentals leasing fast (median 5d on market — plan ~1-2 weeks tenant-placement turnaround); solid renter incomes; 1,169 units permitted in Monroe County in 2024 (591 in 5+ unit buildings).
Forward outlook
- Local home prices are declining (-3.0%/yr); year-one equity from $2k of loan paydown is wiped out by about $7k of value loss. Plan a longer hold.
- Monroe County population projected to shrink 6% by 2050 — rents likely to lag national; underwrite the cash flow, not the appreciation.
Negotiation context
- Only 13 days on market — expect competitive offers; lowballing is unlikely to land.
Risks & watch-outs
- Watch-outs: property tax is 3.8% of price.
Questions for the listing agent
- What do current leases actually rent for vs. the listed asking? Can we see a recent rent roll and the last 12 months of T-12 income?
- Property tax is high relative to price — has the assessment been appealed recently, and will the sale trigger a re-assessment?
- Is there a deadline driving the sale (1031 exchange, divorce, estate, relocation)? That informs how much negotiation room exists.
- Schools are D-rated, which usually means shorter tenancies and higher turnover. Who's the typical renter profile here, and what's been the actual vacancy rate?
- Crime grade is F in this area — have there been break-ins, vandalism, or insurance claims at this property in the last 3 years? What carrier currently insures it and at what premium?
- The area grade is low — what's the realistic commute time and amenity access for the typical tenant pool here? Any planned neighborhood developments (good or bad) we should know about?
- What's the average days-on-market for RENTAL listings here right now (not sales)? A rising rental-DOM trend means longer vacancies and softer asking-rent achievability than the comps imply.
- What's the recent tenant-quality profile in this submarket — average credit score on applications, eviction rate, late-payment / NSF rate, and stable-employment percentage? A property-management company in the area should have these aggregated.
- How much new for-sale + rental construction is in the pipeline within 1–3 miles? Heavy new supply typically softens prices + rents 12–24 months out; constrained supply supports both.
Investment metrics
- 1% rule
- 0.83% ✗
- Cap rate
- 3.64%
- Cash-on-cash
- -9.48%
- DSCR
- 0.58
- GRM
- 10.0
CMA / ARV
- ARV (median comp)
- $263,867
- List price
- $225,900
- Delta
- -14.39%
- Verdict
- UNDERPRICED
- Comps
- 20 within 1.0 mi
Show comp detail 12 sales within ~0.75 mi
| Address | Dist | Beds/Ba | Sqft | Sold | Price | $/sf | Match |
|---|---|---|---|---|---|---|---|
| 461 Pebbleview Dr | 0.15mi | 3/1.5 | 1,232 (-4%) | 6mo | $210,000 | $170 | 80 |
| 83 Dohrcrest Dr | 0.33mi | 3/2.0 | 1,284 (-0%) | 8mo | $225,000 | $175 | 76 |
| 497 Hampton Blvd | 0.51mi | 3/1.0 | 1,296 (+1%) | 7mo | $224,000 | $173 | 67 |
| 966 Latta Rd | 0.33mi | 3/1.5 | 1,440 (+12%) | 5mo | $260,000 | $181 | 61 |
| 264 Alpine Rd | 0.62mi | 3/1.0 | 1,292 (+0%) | 10mo | $120,000 | $93 | 60 |
| 357 Hampton Blvd | 0.67mi | 3/1.0 | 1,252 (-3%) | 11mo | $230,900 | $184 | 53 |
| 193 Shorecliff Dr | 0.69mi | 3/2.0 | 1,254 (-3%) | 11mo | $285,000 | $227 | 52 |
| 238 Belmont Rd | 0.63mi | 3/1.0 | 1,200 (-7%) | 8mo | $230,000 | $192 | 51 |
| 416 Lake Meadow Dr | 0.30mi | 4/1.5 (+1) | 1,480 (+15%) | 7mo | $237,000 | $160 | 50 |
| 130 N Park Dr | 0.71mi | 3/1.5 | 1,120 (-13%) | 2mo | $225,000 | $201 | 44 |
| 447 Hampton Blvd | 0.56mi | 3/1.0 | 1,118 (-13%) | 8mo | $221,000 | $198 | 43 |
| 475 Latta Rd | 0.69mi | 3/1.5 | 1,104 (-14%) | 12mo | $225,000 | $204 | 34 |
Match score weights: distance 35% · size 25% · config 20% · recency 20%. Top-matched comps best support the ARV.
Projected returns pro-forma
-3.0% appreciation · 5.37% rent growth · sell at horizon
- IRR
- -29.5%
- Equity multiple
- -0.00×
- Total profit
- $-63,541
- Equity at exit
- $33,682
- IRR
- -19.8%
- Equity multiple
- -0.19×
- Total profit
- $-75,338
- Equity at exit
- $19,532
Cash invested: $63,252 (down + closing). Projections, not guarantees.
Landlord ↔ Tenant lean methodology
- Overall (STATE)
- 15 Strongly Tenant-Friendly
- State New York
- 15 Strongly Tenant-Friendly · D+10
- County
- — inherits STATE
- City
- — inherits STATE
ZIP-level market 14612
- Home prices YoY
- -33.0%
- Rents YoY
- 5.4%
- Active inventory
- 130
- Price-to-rent
- 10.0×
Monthly cashflow live
- Estimated rent
- $1,882 high interval (Pro) →
- Mortgage (P&I)
- −$1,185
- Tax from tax record
- −$707 /mo · $8,490/yr
- Insurance
- −$94
- HOA
- −$0
- Vacancy / Maint / Mgmt
- −$395
- Net cashflow
- $-500
Break-even live
Sensitivity live
| Price | -10% $-372 | -5% $-436 | +0% $-500 | +5% $-564 | +10% $-627 |
|---|---|---|---|---|---|
| Rent | -10% $-648 | -5% $-574 | +0% $-500 | +5% $-425 | +10% $-351 |
| Rate | -1.0pp $-386 | -0.5pp $-442 | base $-500 | +0.5pp $-558 | +1.0pp $-618 |
UW: 25.0% down · 7.5% · 30yr · 1.5% tax · 5.0% vac · 8.0% maint · 8.0% mgmt
Financing live
Cash to close
- Down payment
- $56,475
- Closing costs
- $6,777
- Reserves months
- —
- Total cash needed
- —
Loan-product check · same deal, 3 products live
Conventional
25% down · 7.5% · 30yr
- Down + closing
- —
- Monthly P&I
- —
- Monthly cashflow
- —
- DSCR
- —
- Eligible?
- —
Personal DTI + credit; lowest rate.
DSCR
20% down · 8.5% · 30yr
- Down + closing
- —
- Monthly P&I
- —
- Monthly cashflow
- —
- DSCR
- —
- Eligible?
- —
No personal income docs; deal must DSCR.
Hard money
10% down · 12.0% · 12mo
- Down + closing
- —
- Monthly P&I
- —
- Monthly cashflow
- —
- DSCR
- —
- Eligible?
- —
Short-term bridge; refi at stabilization.
Rent comps 12 comps
| Address | Beds | Baths | Sqft | Rent | $/sqft | DOM | Units | Dist |
|---|---|---|---|---|---|---|---|---|
| 1255 Latta Rd Greece, NY | 1.0–2.0 | 1.0 | 705 | $1,570 | $2.23 | 4d | 5 | 0.62mi |
| 130 N Park Dr Rochester, NY | 3.0 | 1.5 | 1120 | $2,000 | $1.79 | 45d | 1 | 0.70mi |
| 500 Greenleaf Rd Rochester, NY | 1.0–2.0 | 1.0 | 1176 | $1,650 | $1.40 | 4d | 1 | 0.79mi |
| 704 Rumson Rd Rochester, NY | 3.0 | 1.0 | 1100 | $1,950 | $1.77 | 5d | 1 | 0.88mi |
| 123 Spanish Trl Rochester, NY | 1.0–2.0 | 1.0–1.5 | 945 | $1,775 | $1.88 | 4d | 1 | 0.89mi |
| 125 Windsor Rd Rochester, NY | 2.0 | 1.0 | 1142 | $1,700 | $1.49 | 4d | 1 | 0.96mi |
| 1495 Beach Ave Rochester, NY | 4.0 | 1.5 | 1494 | $2,800 | $1.87 | 45d | 1 | 0.97mi |
| 44 Windsor Rd Rochester, NY | 3.0 | 1.0 | 882 | $1,795 | $2.04 | 4d | 1 | 1.07mi |
| 534-582 Denise Rd Unit 562 Rochester, NY | 2.0 | 1.0 | 1000 | $1,575 | $1.57 | 4d | 1 | 1.09mi |
| 4302 Lake Ave Unit 1 Rochester, NY | 3.0 | 1.5 | 1600 | $3,000 | $1.88 | 45d | 1 | 1.19mi |
| 108 Glenbrook Rd Rochester, NY | 3.0 | 1.0 | 1088 | $1,850 | $1.70 | 25d | 1 | 1.35mi |
| 360 Britton Rd Rochester, NY | 1.0–2.0 | 1.0 | 837 | $1,479 | $1.77 | 4d | 2 | 1.48mi |
Listing history 1 events
-
2026-05-14$225,900 Active 495-char remark
ⓘ Source: listings_history table (triggers on properties + properties_extension) + one-shot
backfill from property_details.listing_events for pre-trigger history.
Tax reassessment forecast NY · Partial reset (capped growth)
- Current annual tax
- $8,490 · $707/mo
- Projected year-2 tax
- $8,490 · $707/mo
- Expected delta
- $0/yr ($0/mo · 0.0%)
ⓘ Screening estimate from a state-policy table — verify with the county assessor before closing.
Climate risk First Street
- Flood 1/10 Low FEMA zone X (unshaded) · 0% chance over 30 yrs
- Wildfire 1/10 Low
- Heat 2/10 Low 7 d/yr ≥95°F today · 16 d/yr by 30 yrs out
- Wind 1/10 Low
- Air quality 2/10 Low 1 unhealthy d/yr today · 1 by 30 yrs out
Nearby sold comps map
Loading sold comps map…
Walkable amenities ~0.75 mi
Loading nearby amenities…
Taxation est. · year 1
- Rental income
- $22,582
- − Mortgage interest
- −$12,654
- − Property taxes
- −$8,490
- − Insurance
- −$1,130
- − Repairs & maintenance
- −$1,807
- − Management
- −$1,807
- − Depreciation
- −$6,572
- Taxable loss
- −$9,876
- Est. tax savings @ 24.0%
- +$2,370
- After-tax cash flow
- $-3,625/yr
For passive investors: Depreciation is non-cash, so a rental often shows a tax loss while cash-flowing — sheltering income. Rental losses are passive: they offset passive income freely, and up to $25,000/yr can offset ordinary (W-2) income if you actively participate and your MAGI is under $100k (phasing out to $0 by $150k); unused losses carry forward. On sale, claimed depreciation is recaptured at up to 25%, and gains may owe capital-gains tax (a 1031 exchange can defer both). Figures are a year-1 estimate at your 24.0% rate — not tax advice; consult a CPA.
Schools (NCES district)
- District
- Greece Central School District
- NCES district ID
- 3612630
- Math proficiency
- 35% ▼ -14.00%
- Reading proficiency
- 39% ▼ -3.00%
- Median HH income
- $52,718
- Composite
- 32.26/100
- National rank
- #5761
- State rank
- #544 of 590 in NY
Livability — Rochester
- Score
- 76/100
- State rank
- #222
- US rank
- #3482
Category grades
Schools grade is shown separately in the Schools card above.
Census & demographics
- County
- Monroe County · 674,131 people
- City population
- 432,803
- Metro
- Rochester, NY
- Population (ZIP)
- 35,152
- Household income
- $82,800
- Rent vs Own
- Severe rent burden
- 1063.0
Population outlook (Monroe County) Hauer SSP2
- Today (2025)
- 759,460 people
- By 2030
- 757,154 · -0.3%
- By 2040
- 740,644 · -2.5%
- By 2050
- 714,443 · -5.9%
- By 2075
- 645,883 · -15.0%
- By 2100
- 547,084 · -28.0%
Race, ethnicity, and origin ACS 2023
- Neighborhood character
- Predominantly White (78%)
- Race & ethnicity
- White 78% Black 9% Hispanic / Latino 7% Two or more races 6%
- Hispanic origin (detail)
- Puerto Rican 5%
- Common ancestry
- Romanian 4% Lithuanian 3% Slovak 2%
- Foreign-born
- 5% · Canada
- Languages at home
- 93% English-only · Spanish 4% Other Indo-European 1% Russian/Polish/Slavic 1%
Political lean MEDSL · Monroe
- 2024 margin
- D (+19.1) · D 59.5% · R 40.5%
- 2008→2024 swing
- +1.4pp toward D · 2008: 17.7pp · 2024: 19.1pp
- All cycles
- 2024: D+19.1 2020: D+21.0 2016: D+14.1 2012: D+17.4 2008: D+17.7
Not yet ingested
- Civics
- —
Market trends
- HPI YoY
- ▼ -124.89%
- Current HPI
- 254.157
- Rent YoY
- ▲ 5.37%
- Metro
- Rochester, NY
- State GDP YoY
- ▲ 2.60%
- F500 in state
- 92
Industry mix (Fortune 500 HQ in NY)
| Industry | F500 HQs | Revenue |
|---|---|---|
| Financial Services | 10 | $950B |
|
||
| Consumer Goods | 9 | $162B |
|
||
| Insurance | 4 | $225B |
|
||
| Telecommunications | 2 | $144B |
|
||
| Pharmaceuticals | 2 | $112B |
|
||
| Media / Entertainment | 2 | $69B |
|
||
Price history
2 events — show timeline
- 2026-05-27 Pending — UNYREIS
- 2026-05-14 Listed $225,900 UNYREIS
Property tax history
+7.4%/yrLatest (2025): $8,490 · +61.9% YoY. Source: county tax records.
Cash-flow waterfall
monthlySold comps — $/sqft
last 12 mo · ≤1 miLoading sold comps…