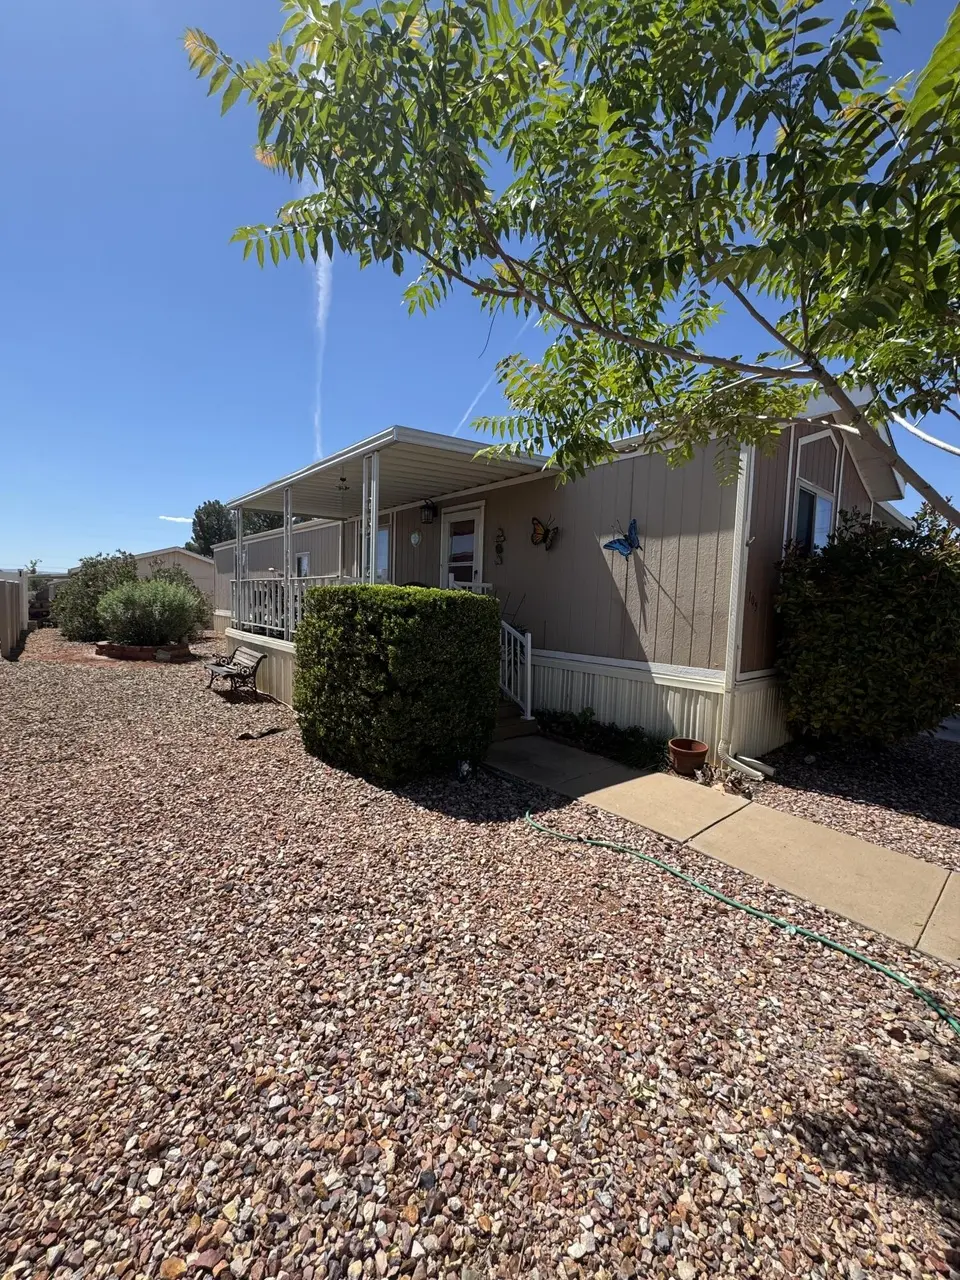
1450 N Dixie Downs Rd #105 · St. George, UT
Flood risk 1/10 · Minimal
- FEMA flood zone
- X (unshaded)
- Chance of flooding over 30 yrs
- 0.0%
- Est. flood insurance / yr
- $507 – $1,088
Fire risk 7/10 · Major
- Est. fire insurance / yr
- $453 – $841
Heat risk 6/10 · Moderate
- Hot days now (above 103°F)
- 7 days/yr
- Hot days in 30 yrs
- 18 days/yr
Wind risk 1/10 · Minimal
- Chance of severe wind over 30 yrs
- —
Air-quality risk 1/10 · Minimal
- Unhealthy air days now
- 0 days/yr
- Unhealthy air days in 30 yrs
- 0 days/yr
Risk factors via First Street. Map © Google.
Why this score? — see what drove the C grade
The composite is a weighted blend of 9 inputs, each scored 0–100. Each bar is that input's sub-score; the figure is the points it added to the 100-point composite (weight × sub-score).
- Cash flow +19.7/30.0
- 1% rule +10.0/10.0
- ARV discount +7.5/15.0
- DSCR +6.2/10.0
- Schools +3.7/10.0
- Rent growth +3.1/5.0
- Livability +2.5/5.0
- Condition / age +2.5/5.0
- Appreciation +0.0/10.0
$75,000
🖨 Deal sheet (PDF) 📄 Offer letter ✓ Due diligence
Listing remarks MLS
There are no remarks available.
Key facts
- Move-in ready
- Full-sized closet
- Shaded sitting area
Tags
Property features AI
Finance
- Other: Property zoned for mobile home
- Financial info: Financial details not specified
- HOA & community: Homeowners association with a $600 monthly fee
Exterior
- Parking: Attached garage; Carport with 2 spaces
- Security: Security details not specified
- Utilities: Sewer available; Electricity connected
- Home design: Residential mobile home; Single-story; Mobile Home on a rented lot
- Construction: Wood siding construction; Built year not specified
- Exterior features: Asphalt roof
Interior
- Kitchen: Kitchen details not specified
- Bedrooms: Mobile home with bedroom information not specified
- Flooring: Flooring details not specified
- Bathrooms: Bathroom details not specified
- Heating & cooling: Heat pump heating; No central cooling
- Interior features: Total of 4 rooms
- Laundry & utility: Laundry details not specified
Neighborhood map
What this means for you Summary
Snapshot
- This is a 2-bed/2.0-bath land listed at $75k.
Deal economics
- At list price, monthly cash flow is $88 ($1k/yr) — positive.
- The deal already cash-flows at list — no discount required.
- Meets the 1% rule at list price ($2k rent vs $75k).
- Recommended offer: $73k (3.0% below list) — sets the bar for market timing.
Location & tenants
- Location reads: area grade C — affects rentability + tenant quality, not the cash-flow math above.
- Washington District (urban): math 42% / reading 45% proficiency, ranked #37 of 80 in UT (top 46%) — families likely to look elsewhere, expect single-tenant / working-renter base with shorter leases.
- Zoned schools: Red Mountain School (math 32% / reading 33%, grade F, #416 of 585 statewide, top 71%, 434 students, 59% FRL); Lava Ridge Intermediate (math 43% / reading 40%, grade F, #61 of 138 statewide, top 47%, 815 students, 42% FRL); Snow Canyon High (math 32% / reading 48%, grade F, #62 of 171 statewide, top 36%, 1,266 students, 30% FRL).
- Market conditions: Rents rising (+2.4%/yr); 779 active listings in the ZIP; 10 comparable units currently listed for rent nearby; rentals at typical pace (median 23d on market — plan ~3-4 weeks tenant-placement turnaround); 3,140 units permitted in Washington County in 2024 (650 in 5+ unit buildings).
Forward outlook
- Local home prices are declining (-3.0%/yr); year-one equity from $519 of loan paydown is wiped out by about $2k of value loss. Plan a longer hold.
- Washington County population projected at +44% by 2050 — long-run rental-demand tailwind backs the buy-and-hold thesis.
Negotiation context
- It's been on market 44 days — a 3% lower offer ($73k) is reasonable based on typical stale-listing flexibility.
- 4 sale attempts since 11y ago; this cycle's ask is 7% above the opening price — seller raised mid-cycle; expect resistance to lowballs.
Risks & watch-outs
- Watch-outs: HOA is 39% of rent.
- Climate carrying-cost: major wildfire risk; extreme-heat days projected 7→18/yr by 2055 (HVAC capex compounding) — expect insurance premiums to compound above CPI over the hold.
Questions for the listing agent
- It's been on market 44 days. Have you received any prior offers? Is the seller open to a 3% concession, seller financing, or rate buy-down credit?
- What does the HOA fee cover, when was the last increase, and are there any pending special assessments or reserve-fund shortfalls?
- Is there a deadline driving the sale (1031 exchange, divorce, estate, relocation)? That informs how much negotiation room exists.
- What's the average days-on-market for RENTAL listings here right now (not sales)? A rising rental-DOM trend means longer vacancies and softer asking-rent achievability than the comps imply.
- What's the recent tenant-quality profile in this submarket — average credit score on applications, eviction rate, late-payment / NSF rate, and stable-employment percentage? A property-management company in the area should have these aggregated.
- How much new for-sale + rental construction is in the pipeline within 1–3 miles? Heavy new supply typically softens prices + rents 12–24 months out; constrained supply supports both.
Investment metrics
- 1% rule
- 2.04% ✓
- Cap rate
- 7.70%
- Cash-on-cash
- 5.02%
- DSCR
- 1.22
- GRM
- 4.1
CMA / ARV
No comps found within radius.
Projected returns pro-forma
-3.0% appreciation · 2.42% rent growth · sell at horizon
- IRR
- -9.2%
- Equity multiple
- 0.66×
- Total profit
- $-7,056
- Equity at exit
- $11,183
- IRR
- -0.7%
- Equity multiple
- 0.95×
- Total profit
- $-946
- Equity at exit
- $6,485
Cash invested: $21,000 (down + closing). Projections, not guarantees.
Landlord ↔ Tenant lean methodology
- Overall (STATE)
- 86 Strongly Landlord-Friendly
- State Utah
- 86 Strongly Landlord-Friendly · R+15
- County
- — inherits STATE
- City
- — inherits STATE
ZIP-level market 84770
- Rents YoY
- 2.4%
- Active inventory
- 779
- Price-to-rent
- 4.1×
Monthly cashflow live
- Estimated rent
- $1,527 high interval (Pro) →
- Mortgage (P&I)
- −$393
- Tax est. 1.5%
- −$94 /mo · $1,125/yr
- Insurance
- −$31
- HOA
- −$600
- Vacancy / Maint / Mgmt
- −$321
- Net cashflow
- $88
Break-even live
Sensitivity live
| Price | -10% $140 | -5% $114 | +0% $88 | +5% $62 | +10% $36 |
|---|---|---|---|---|---|
| Rent | -10% $-33 | -5% $27 | +0% $88 | +5% $148 | +10% $208 |
| Rate | -1.0pp $126 | -0.5pp $107 | base $88 | +0.5pp $68 | +1.0pp $49 |
UW: 25.0% down · 7.5% · 30yr · 1.5% tax · 5.0% vac · 8.0% maint · 8.0% mgmt
Financing live
Cash to close
- Down payment
- $18,750
- Closing costs
- $2,250
- Reserves months
- —
- Total cash needed
- —
Loan-product check · same deal, 3 products live
Conventional
25% down · 7.5% · 30yr
- Down + closing
- —
- Monthly P&I
- —
- Monthly cashflow
- —
- DSCR
- —
- Eligible?
- —
Personal DTI + credit; lowest rate.
DSCR
20% down · 8.5% · 30yr
- Down + closing
- —
- Monthly P&I
- —
- Monthly cashflow
- —
- DSCR
- —
- Eligible?
- —
No personal income docs; deal must DSCR.
Hard money
10% down · 12.0% · 12mo
- Down + closing
- —
- Monthly P&I
- —
- Monthly cashflow
- —
- DSCR
- —
- Eligible?
- —
Short-term bridge; refi at stabilization.
Rent comps 10 comps
| Address | Beds | Baths | Sqft | Rent | $/sqft | DOM | Units | Dist |
|---|---|---|---|---|---|---|---|---|
| 1711 W 1300 N Saint George, UT | 2.0 | 1.0 | 1120 | $1,550 | $1.38 | 23d | 1 | 0.21mi |
| 1503 N 2100 W Saint George, UT | 1.0–2.0 | 1.0 | 693 | $1,300 | $1.88 | 15d | 5 | 0.37mi |
| 1741 W 950 N St. George, UT | 2.0 | 1.5 | 1028 | $1,500 | $1.46 | 15d | 1 | 0.59mi |
| 1660 W Sunset Blvd Saint George, UT | 2.0 | 2.0 | 909 | $1,399 | $1.54 | 23d | 3 | 0.65mi |
| 1040 N 1300 W #89 St. George, UT | 3.0 | 2.0 | 1100 | $1,795 | $1.63 | 23d | 1 | 0.83mi |
| 1151 W 540 N Unit 4 St. George, UT | 3.0 | 2.0 | 1000 | $1,295 | $1.29 | 23d | 1 | 1.38mi |
| 260 N Dixie Dr Saint George, UT | 1.0–3.0 | 1.0–2.0 | 1123 | $1,688 | $1.50 | 23d | 18 | 1.40mi |
| 260 N Dixie Dr Saint George, UT | 1.0–3.0 | 1.0–2.0 | 1187 | $1,674 | $1.41 | 15d | 20 | 1.40mi |
| 1180 W 425 N Saint George, UT | 2.0 | 1.0 | 850 | $1,250 | $1.47 | 23d | 1 | 1.43mi |
| 776 Diagonal St #52 St George, UT | 2.0 | 2.0 | 1076 | $1,325 | $1.23 | 15d | 1 | 1.50mi |
HOA detail
- Monthly dues
- $600 · $7,200/yr
Listing history 16 events
-
2026-06-05statusdays on market $75,000 Pending 44 DOM
-
2026-06-02days on market $75,000 Active 42 DOM
-
2026-06-01days on market $75,000 Active 41 DOM
-
2026-05-31days on market $75,000 Active 40 DOM
-
2026-05-30days on market $75,000 Active 39 DOM
-
2026-04-20$70,000 Active
-
2024-09-16soldstatus Closed 31-char remark
Show marketing remark (31 chars)
There are no remarks available.
-
2024-08-21status Under Contract 31-char remark
Show marketing remark (31 chars)
There are no remarks available.
-
2024-08-20price $500,000 31-char remark
Show marketing remark (31 chars)
There are no remarks available.
-
2024-08-20status Active 31-char remark
Show marketing remark (31 chars)
There are no remarks available.
-
2024-05-19historical 31-char remark
Show marketing remark (31 chars)
There are no remarks available.
-
2024-03-28$650,000 Active 31-char remark
Show marketing remark (31 chars)
There are no remarks available.
-
2018-06-14price $167,500 31-char remark
Show marketing remark (31 chars)
There are no remarks available.
-
2017-12-14historical 31-char remark
Show marketing remark (31 chars)
There are no remarks available.
-
2017-12-13soldstatus Sold 31-char remark
Show marketing remark (31 chars)
There are no remarks available.
-
2015-09-05$190,000 Active 31-char remark
Show marketing remark (31 chars)
There are no remarks available.
ⓘ Source: listings_history table (triggers on properties + properties_extension) + one-shot
backfill from property_details.listing_events for pre-trigger history.
Climate risk First Street
- Flood 1/10 Low FEMA zone X (unshaded) · 0% chance over 30 yrs
- Wildfire 7/10 Severe
- Heat 6/10 Major 7 d/yr ≥103°F today · 18 d/yr by 30 yrs out
- Wind 1/10 Low
- Air quality 1/10 Low 0 unhealthy d/yr today · 0 by 30 yrs out
Nearby sold comps map
Loading sold comps map…
Walkable amenities ~0.75 mi
Loading nearby amenities…
Taxation est. · year 1
- Rental income
- $18,320
- − Mortgage interest
- −$4,201
- − Property taxes
- −$1,125
- − Insurance
- −$375
- − Repairs & maintenance
- −$1,466
- − Management
- −$1,466
- − HOA
- −$7,200
- − Depreciation
- −$2,182
- Taxable income
- $306
- Est. tax owed @ 24.0%
- −$73
- After-tax cash flow
- $980/yr
For passive investors: Depreciation is non-cash, so a rental often shows a tax loss while cash-flowing — sheltering income. Rental losses are passive: they offset passive income freely, and up to $25,000/yr can offset ordinary (W-2) income if you actively participate and your MAGI is under $100k (phasing out to $0 by $150k); unused losses carry forward. On sale, claimed depreciation is recaptured at up to 25%, and gains may owe capital-gains tax (a 1031 exchange can defer both). Figures are a year-1 estimate at your 24.0% rate — not tax advice; consult a CPA.
Schools (NCES district)
- District
- Washington District
- NCES district ID
- 4901140
- Math proficiency
- 42% ▼ -3.00%
- Reading proficiency
- 45% ▼ -3.00%
- Median HH income
- $50,861
- Composite
- 37.47/100
- National rank
- #4408
- State rank
- #37 of 80 in UT
Livability — St. George
No livability data for this city. (Only ~50 U.S. cities are tracked.)
Census & demographics
- Census place
- St. George, UT
- County
- Washington County · 179,216 people
- City population
- 101,579
- Metro
- St. George, UT
- Population (ZIP)
- 48,397
- Household income
- $70,024
- Rent vs Own
- Severe rent burden
- 1605.0
Population outlook (Washington County) Hauer SSP2
- Today (2025)
- 193,324 people
- By 2030
- 211,699 · +9.5%
- By 2040
- 246,449 · +27.5%
- By 2050
- 278,447 · +44.0%
- By 2075
- 342,734 · +77.3%
- By 2100
- 382,815 · +98.0%
Race, ethnicity, and origin ACS 2023
- Neighborhood character
- Predominantly White (79%)
- Race & ethnicity
- White 79% Hispanic / Latino 15% Two or more races 6% Native American 1% Asian 1%
- Hispanic origin (detail)
- Mexican 10%
- Common ancestry
- Italian 8% Slovak 4% Scottish 2%
- Foreign-born
- 8% · Canada, Vietnam
- Languages at home
- 86% English-only · Spanish 11% Other Indo-European 1% Vietnamese 1%
Political lean MEDSL · Washington
- 2024 margin
- Solid R (+52.3) · D 23.0% · R 75.2% · Other 1.8%
- 2008→2024 swing
- +1.2pp toward D · 2008: -53.5pp · 2024: -52.3pp
- All cycles
- 2024: R+52.3 2020: R+51.7 2016: R+52.1 2012: R+67.0 2008: R+53.5
Not yet ingested
- Civics
- —
Market trends
- HPI YoY
- ▼ -356.86%
- Current HPI
- 234.9418
- Rent YoY
- ▲ 2.42%
- Metro
- St. George, UT
- State GDP YoY
- ▲ 3.54%
- F500 in state
- 2
Industry mix (Fortune 500 HQ in UT)
| Industry | F500 HQs | Revenue |
|---|---|---|
| Financial Services | 1 | $3B |
|
||
Price history
-63.2% since first listed11 events — show timeline
- 2026-04-20 Listed $70,000 WCBOR
- 2024-09-16 Sold (MLS) — WFRMLS
- 2024-08-21 Pending — WFRMLS
- 2024-08-20 Price Changed $500,000 WFRMLS
- 2024-08-20 Relisted — WFRMLS
- 2024-05-19 Listing Removed — WFRMLS
- 2024-03-28 Listed $650,000 WFRMLS
- 2018-06-14 Price Changed $167,500 WFRMLS
- 2017-12-14 Listing Removed — WFRMLS
- 2017-12-13 Sold (MLS) — WFRMLS
- 2015-09-05 Listed $190,000 WFRMLS
Cash-flow waterfall
monthlySold comps — $/sqft
last 12 mo · ≤1 miLoading sold comps…