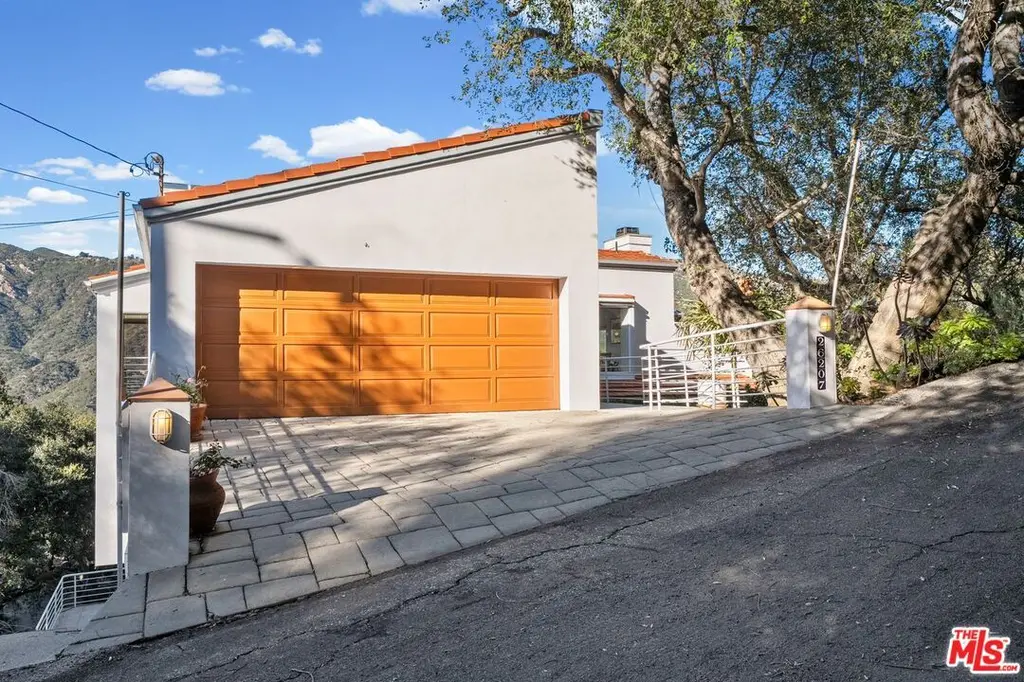
26207 Ingleside Way · Malibu, CA
Flood risk 1/10 · Minimal
- FEMA flood zone
- X (unshaded)
- Chance of flooding over 30 yrs
- 0.0%
- Est. flood insurance / yr
- $507 – $1,088
Fire risk 5/10 · Moderate
- Est. fire insurance / yr
- $659 – $1,223
Heat risk 3/10 · Minor
- Hot days now (above 83°F)
- 7 days/yr
- Hot days in 30 yrs
- 19 days/yr
Wind risk 1/10 · Minimal
- Chance of severe wind over 30 yrs
- —
Air-quality risk 5/10 · Moderate
- Unhealthy air days now
- 7 days/yr
- Unhealthy air days in 30 yrs
- 7 days/yr
Risk factors via First Street. Map © Google.
Why this score? — see what drove the C grade
The composite is a weighted blend of 9 inputs, each scored 0–100. Each bar is that input's sub-score; the figure is the points it added to the 100-point composite (weight × sub-score).
- Cash flow +16.3/30.0
- ARV discount +12.4/15.0
- Schools +6.2/10.0
- Appreciation +5.3/10.0
- DSCR +5.1/10.0
- 1% rule +3.6/10.0
- Livability +2.7/5.0
- Condition / age +2.5/5.0
- Rent growth +1.7/5.0
$1,899,000
🖨 Deal sheet 📄 Offer letter ✓ Due diligence
Listing remarks MLS
Tucked into the serene hills of Corral Canyon, 26207 Ingleside Way offers tranquil Malibu living in one the area's most idyllic enclaves. Embracing its striking canyon surroundings, the home features sweeping views and abundant natural light pouring in through expansive windows, and a striking central skylight. An open floor plan creates seamless flow between the living, dining, and kitchen areas. The bedrooms, one of which includes its own private entrance, enjoy picturesque outlooks and a calming ambiance. And the primary suite serves as a serene retreat framed by treetop vistas. The spacious primary bathroom suite features an oversized jetted soaking tub, step-in shower, and generous walk-in closet. A versatile level below includes a bonus bathroom, private entrance, and space for a creative studio, home office, or ADU conversion. Outdoor decks and natural landscaping further enhance the home's connection to its setting, creating a seamless indoor-outdoor lifestyle. Beyond the home lies what locals affectionately call the Malibu Bowl, a natural valley floor at the heart of Corral Canyon, surrounded by rolling hills and open skies. As the only canyon in Malibu that isn't a through street, and the only undeveloped coastal canyon in all of LA, the area enjoys minimal traffic and a peaceful and bucolic "old-Malibu" charm, while staying close to the beaches, shops, restaurants and schools of central Malibu.
Key facts
- Open floor plan
- Step-in shower
- 0.34 acre lot
Tags
Neighborhood map
What this means for you Summary
Snapshot
- This is a 3-bed/3.0-bath single-family listed at $1.90M.
Deal economics
- At list price, monthly cash flow is $1k ($13k/yr) — positive.
- The deal already cash-flows at list — no discount required.
- To meet the 1% rule (rent ≥ 1% of price), the offer needs to be $1.63M (14.3% below list).
- Recommended offer: $1.63M (14.3% below list) — sets the bar for 1% rule.
- Cap rate 7.0% vs local median 0.7% in Malibu — top-decile yield for the area; either an underpriced asset or a hidden risk that comps aren't pricing in. Stress-test before assuming the spread holds.
Location & tenants
- Location reads 53/100 on livability (#979 in CA) — a working-class tenant base; expect higher turnover. Strengths: employment A+, schools B; Watch: housing C-, crime F, amenities F.
- Santa Monica-Malibu Unified (urban): math 61% / reading 74% proficiency, ranked #123 of 1,400 in CA (top 9%) — acceptable for families but not a draw, mixed tenant base, ~2y average lease.
- Market conditions: Rents falling (-3.4%/yr); 627 active listings in the ZIP; 2 comparable units currently listed for rent nearby; high-income renter base; 19,697 units permitted in Los Angeles County in 2024 (9,426 in 5+ unit buildings).
- At $16,267/mo this rent would consume 99% of the median local household income ($197k/yr) (locally 420% of renters already pay >50% of income on rent) — very limited rent-growth headroom before tenants either downsize or default.
Forward outlook
- In year one you build about $25k of equity ($13k loan paydown + $12k appreciation (0.6% local appreciation)).
- Los Angeles County population projected at +9% by 2050 — modest demand growth; plan on rents tracking national, not racing it.
- By year 5, paydown + projected appreciation supports a ~$121k cash-out refi (75% LTV) — recoverable capital for the next deal without selling this one.
Negotiation context
- It's been on market 94 days — a 9% lower offer ($1.73M) is reasonable based on typical stale-listing flexibility.
- 3 sale attempts since 29y ago with the ask held roughly flat each time — persistent listings suggest the price (not the market) is what's stuck; bring a comps-based counter.
- Current owner paid $610k; list at $1.90M implies a 211% gain — meaningful room to come down on a strong offer.
Risks & watch-outs
- Climate carrying-cost: moderate wildfire risk — expect insurance premiums to compound above CPI over the hold.
Questions for the listing agent
- It's been on market 94 days. Have you received any prior offers? Is the seller open to a 14% concession, seller financing, or rate buy-down credit?
- Why hasn't it sold? Are there any deal-killer items the seller is aware of (foundation, flood, title, zoning, code violations)?
- Is there a deadline driving the sale (1031 exchange, divorce, estate, relocation)? That informs how much negotiation room exists.
- Schools are B-rated — typically a magnet for longer-tenancy family renters. What's the average tenant stay here, and is there a school-zone premium baked into asking?
- Crime grade is F in this area — have there been break-ins, vandalism, or insurance claims at this property in the last 3 years? What carrier currently insures it and at what premium?
- What's the average days-on-market for RENTAL listings here right now (not sales)? A rising rental-DOM trend means longer vacancies and softer asking-rent achievability than the comps imply.
- What's the recent tenant-quality profile in this submarket — average credit score on applications, eviction rate, late-payment / NSF rate, and stable-employment percentage? A property-management company in the area should have these aggregated.
- How much new for-sale + rental construction is in the pipeline within 1–3 miles? Heavy new supply typically softens prices + rents 12–24 months out; constrained supply supports both.
Investment metrics
- 1% rule
- 0.86% ✗
- Cap rate
- 6.96%
- Cash-on-cash
- 2.38%
- DSCR
- 1.11
- GRM
- 9.7
CMA / ARV
- ARV (median comp)
- $2,128,895
- List price
- $1,899,000
- Delta
- -10.80%
- Verdict
- UNDERPRICED
- Comps
- 12 within 1.0 mi
Show comp detail 4 sales within ~0.75 mi
| Address | Dist | Beds/Ba | Sqft | Sold | Price | $/sf | Match |
|---|---|---|---|---|---|---|---|
| 26200 Lockwood Rd | 0.12mi | 4/3.5 (+1) | 2,752 (+5%) | 7mo | $2,075,000 | $754 | 73 |
| 26160 Fairside Rd | 0.06mi | 4/5.0 (+1) | 2,679 (+2%) | 12mo | $2,420,000 | $903 | 70 |
| 26335 Lockwood Rd | 0.23mi | 3/3.0 | 2,230 (-15%) | 5mo | $2,126,000 | $953 | 60 |
| 1876 Lookout Rd | 0.25mi | 4/4.0 (+1) | 2,940 (+12%) | 5mo | $2,350,000 | $799 | 55 |
Match score weights: distance 35% · size 25% · config 20% · recency 20%. Top-matched comps best support the ARV.
Projected returns pro-forma
0.62% appreciation · 0.0% rent growth · sell at horizon
- IRR
- 0.7%
- Equity multiple
- 1.04×
- Total profit
- $19,178
- Equity at exit
- $610,810
- IRR
- 4.0%
- Equity multiple
- 1.43×
- Total profit
- $230,527
- Equity at exit
- $783,479
Cash invested: $531,720 (down + closing). Projections, not guarantees.
Landlord ↔ Tenant lean methodology
- Overall (STATE)
- 18 Strongly Tenant-Friendly
- State California
- 18 Strongly Tenant-Friendly · D+13
- County
- — inherits STATE
- City
- — inherits STATE
ZIP-level market 90265
- Home prices YoY
- 0.1%
- Rents YoY
- -3.4%
- Active inventory
- 627
- Price-to-rent
- 9.7×
Monthly cashflow live
- Estimated rent
- $16,267 medium interval (Pro) →
- Mortgage (P&I)
- −$9,959
- Tax from tax record
- −$1,047 /mo · $12,563/yr
- Insurance
- −$791
- HOA
- −$0
- Vacancy / Maint / Mgmt
- −$3,416
- Net cashflow
- $1,054
Break-even live
UW: 25.0% down · 7.5% · 30yr · 1.5% tax · 5.0% vac · 8.0% maint · 8.0% mgmt
Financing live
Cash to close
- Down payment
- $474,750
- Closing costs
- $56,970
- Reserves months
- —
- Total cash needed
- —
Loan-product check · same deal, 3 products live
Conventional
25% down · 7.5% · 30yr
- Down + closing
- —
- Monthly P&I
- —
- Monthly cashflow
- —
- DSCR
- —
- Eligible?
- —
Personal DTI + credit; lowest rate.
DSCR
20% down · 8.5% · 30yr
- Down + closing
- —
- Monthly P&I
- —
- Monthly cashflow
- —
- DSCR
- —
- Eligible?
- —
No personal income docs; deal must DSCR.
Hard money
10% down · 12.0% · 12mo
- Down + closing
- —
- Monthly P&I
- —
- Monthly cashflow
- —
- DSCR
- —
- Eligible?
- —
Short-term bridge; refi at stabilization.
Rent comps 2 comps
| Address | Beds | Baths | Sqft | Rent | $/sqft | DOM | Units | Dist |
|---|---|---|---|---|---|---|---|---|
| 26237 Fairside Rd Malibu, CA | 4.0 | 4.0 | 2082 | $13,000 | $6.24 | 16d | 1 | 0.06mi |
| 26349 Fairside Rd Malibu, CA | 3.0 | 3.0 | 1876 | $7,500 | $4.00 | 43d | 1 | 0.20mi |
Listing history 21 events
-
2026-06-18days on market $1,899,000 Active 94 DOM
-
2026-06-17days on market $1,899,000 Active 93 DOM
-
2026-06-16days on market $1,899,000 Active 92 DOM
-
2026-06-15days on market $1,899,000 Active 91 DOM
-
2026-06-13days on market $1,899,000 Active 89 DOM
-
2026-06-13days on market $1,899,000 Active 88 DOM
-
2026-06-09days on market $1,899,000 Active 85 DOM
-
2026-06-08days on market $1,899,000 Active 84 DOM
-
2026-06-07days on market $1,899,000 Active 83 DOM
-
2026-06-04days on market $1,899,000 Active 80 DOM
-
2026-06-03days on market $1,899,000 Active 79 DOM
-
2026-06-02days on market $1,899,000 Active 78 DOM
-
2026-06-01days on market $1,899,000 Active 77 DOM
-
2026-05-31days on market $1,899,000 Active 76 DOM
-
2026-03-16$1,899,000 Active 1438-char remark
Show marketing remark (1438 chars)
Tucked into the serene hills of Corral Canyon, 26207 Ingleside Way offers tranquil Malibu living in one the area's most idyllic enclaves. Embracing its striking canyon surroundings, the home features sweeping views and abundant natural light pouring in through expansive windows, and a striking central skylight. An open floor plan creates seamless flow between the living, dining, and kitchen areas. The bedrooms, one of which includes its own private entrance, enjoy picturesque outlooks and a calming ambiance. And the primary suite serves as a serene retreat framed by treetop vistas. The spacious primary bathroom suite features an oversized jetted soaking tub, step-in shower, and generous walk-in closet. A versatile level below includes a bonus bathroom, private entrance, and space for a creative studio, home office, or ADU conversion. Outdoor decks and natural landscaping further enhance the home's connection to its setting, creating a seamless indoor-outdoor lifestyle. Beyond the home lies what locals affectionately call the Malibu Bowl, a natural valley floor at the heart of Corral Canyon, surrounded by rolling hills and open skies. As the only canyon in Malibu that isn't a through street, and the only undeveloped coastal canyon in all of LA, the area enjoys minimal traffic and a peaceful and bucolic "old-Malibu" charm, while staying close to the beaches, shops, restaurants and schools of central Malibu.
-
1999-07-01soldstatus $610,000 174-char remark
Show marketing remark (174 chars)
STUNNING SKYLIT ARCHITECTURAL MEDIT. , W/ MTN VIEWS. LANDSCAPED TO PROVIDE PRIVACY & SERENITY. GREAT MSTR, FAM RM, BONUS RM. 3 BR/2.5 BA HRDWD FLRS. EXTREMELY DRAMATIC.
-
1999-07-01soldstatus $610,000
Show marketing remark (174 chars)
STUNNING SKYLIT ARCHITECTURAL MEDIT. , W/ MTN VIEWS. LANDSCAPED TO PROVIDE PRIVACY & SERENITY. GREAT MSTR, FAM RM, BONUS RM. 3 BR/2.5 BA HRDWD FLRS. EXTREMELY DRAMATIC.
-
1999-05-24historical 174-char remark
Show marketing remark (174 chars)
STUNNING SKYLIT ARCHITECTURAL MEDIT. , W/ MTN VIEWS. LANDSCAPED TO PROVIDE PRIVACY & SERENITY. GREAT MSTR, FAM RM, BONUS RM. 3 BR/2.5 BA HRDWD FLRS. EXTREMELY DRAMATIC.
-
1998-10-09$625,000 174-char remark
Show marketing remark (174 chars)
STUNNING SKYLIT ARCHITECTURAL MEDIT. , W/ MTN VIEWS. LANDSCAPED TO PROVIDE PRIVACY & SERENITY. GREAT MSTR, FAM RM, BONUS RM. 3 BR/2.5 BA HRDWD FLRS. EXTREMELY DRAMATIC.
-
1998-03-07historical
-
1997-03-05
ⓘ Source: listings_history table (triggers on properties + properties_extension) + one-shot
backfill from property_details.listing_events for pre-trigger history.
Tax reassessment forecast CA · Resets to sale price
- Current annual tax
- $12,563 · $1,047/mo
- Projected year-2 tax
- $14,432 · $1,203/mo
- Expected delta
- +$1,869/yr (+$156/mo · 14.9%)
ⓘ Screening estimate from a state-policy table — verify with the county assessor before closing.
Climate risk First Street
- Flood 1/10 Low FEMA zone X (unshaded) · 0% chance over 30 yrs
- Wildfire 5/10 Major
- Heat 3/10 Moderate 7 d/yr ≥83°F today · 19 d/yr by 30 yrs out
- Wind 1/10 Low
- Air quality 5/10 Major 7 unhealthy d/yr today · 7 by 30 yrs out
Nearby sold comps map
Loading sold comps map…
Walkable amenities ~0.75 mi
Loading nearby amenities…
Taxation est. · year 1
- Rental income
- $195,203
- − Mortgage interest
- −$106,374
- − Property taxes
- −$12,563
- − Insurance
- −$9,495
- − Repairs & maintenance
- −$15,616
- − Management
- −$15,616
- − Depreciation
- −$55,244
- Taxable loss
- −$19,705
- Est. tax savings @ 24.0%
- +$4,729
- After-tax cash flow
- $17,378/yr
For passive investors: Depreciation is non-cash, so a rental often shows a tax loss while cash-flowing — sheltering income. Rental losses are passive: they offset passive income freely, and up to $25,000/yr can offset ordinary (W-2) income if you actively participate and your MAGI is under $100k (phasing out to $0 by $150k); unused losses carry forward. On sale, claimed depreciation is recaptured at up to 25%, and gains may owe capital-gains tax (a 1031 exchange can defer both). Figures are a year-1 estimate at your 24.0% rate — not tax advice; consult a CPA.
Schools (NCES district)
- District
- Santa Monica-Malibu Unified
- NCES district ID
- 0635700
- Math proficiency
- 61% ▬ 0.00%
- Reading proficiency
- 74% ▬ 0.00%
- Median HH income
- $81,489
- Composite
- 61.58/100
- National rank
- #1535
- State rank
- #123 of 1400 in CA
Livability — Malibu
- Score
- 53/100
- State rank
- #979
- US rank
- #24630
Category grades
Schools grade is shown separately in the Schools card above.
Census & demographics
- County
- Los Angeles County · 9,444,647 people
- City population
- 15,918
- Metro
- Los Angeles-Long Beach-Anaheim, CA
- Population (ZIP)
- 15,918
- Household income
- $196,742
- Rent vs Own
- Severe rent burden
- 420.0
Population outlook (Los Angeles County) Hauer SSP2
- Today (2025)
- 10,940,515 people
- By 2030
- 11,256,481 · +2.9%
- By 2040
- 11,729,929 · +7.2%
- By 2050
- 11,948,407 · +9.2%
- By 2075
- 11,818,114 · +8.0%
- By 2100
- 10,842,928 · -0.9%
Race, ethnicity, and origin ACS 2023
- Neighborhood character
- Predominantly White (77%)
- Race & ethnicity
- White 77% Two or more races 10% Hispanic / Latino 9% Asian 5% Black 1%
- Hispanic origin (detail)
- Mexican 6%
- Common ancestry
- Italian 8% Scotch-Irish 3% Romanian 3%
- Foreign-born
- 16% · Canada, South Korea, China
- Languages at home
- 82% English-only · Spanish 6% Other Indo-European 6% French/Haitian/Cajun 2%
Political lean MEDSL · Los Angeles
- 2024 margin
- Solid D (+32.9) · D 64.8% · R 31.9% · Other 3.3%
- 2008→2024 swing
- -7.4pp toward R · 2008: 40.4pp · 2024: 32.9pp
- All cycles
- 2024: D+32.9 2020: D+44.2 2016: D+48.0 2012: D+40.0 2008: D+40.4
Not yet ingested
- Civics
- —
Market trends
- HPI YoY
- ▲ 0.62%
- Current HPI
- 498.5117
- Rent YoY
- ▼ -3.39%
- Metro
- Los Angeles-Long Beach-Anaheim, CA
- State GDP YoY
- ▲ 3.21%
- F500 in state
- 116
Industry mix (Fortune 500 HQ in CA)
| Industry | F500 HQs | Revenue |
|---|---|---|
| Technology | 27 | $1,492B |
|
||
| Financial Services | 3 | $174B |
|
||
| Retail | 3 | $44B |
|
||
| Insurance | 3 | $26B |
|
||
| Media / Entertainment | 2 | $115B |
|
||
| Pharmaceuticals / Biotech | 2 | $62B |
|
||
Price history
+203.8% since first listed7 events — show timeline
- 2026-03-16 Listed $1,899,000 TheMLS
- 1999-07-01 Sold (Public Records) $610,000 Public Records
- 1999-07-01 Sold (MLS) $610,000 TheMLS
- 1999-05-24 Delisted — TheMLS
- 1998-10-09 Listed $625,000 TheMLS
- 1998-03-07 Delisted — TheMLS
- 1997-03-05 Listed — TheMLS
Property tax history
+2.3%/yrLatest (2025): $12,563 · +9.4% YoY. Source: county tax records.
Cash-flow waterfall
monthlySold comps — $/sqft
last 12 mo · ≤1 miLoading sold comps…