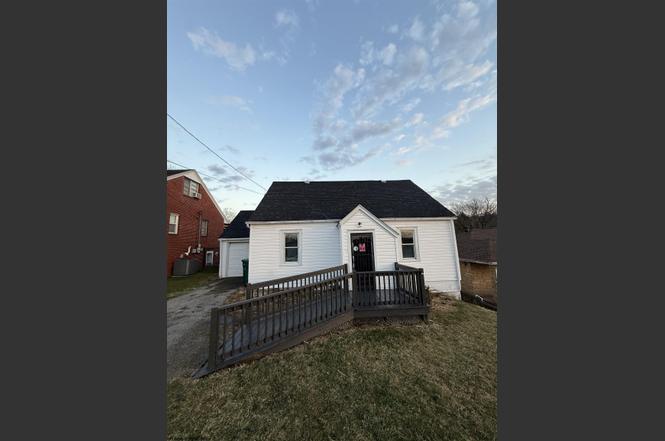
423 Grand Ave · Bridgeport, WV
Flood risk 1/10 · Minimal
- FEMA flood zone
- X (unshaded)
- Chance of flooding over 30 yrs
- 0.0%
- Est. flood insurance / yr
- $507 – $1,088
Fire risk 3/10 · Minor
- Est. fire insurance / yr
- $787 – $1,461
Heat risk 4/10 · Minor
- Hot days now (above 97°F)
- 7 days/yr
- Hot days in 30 yrs
- 19 days/yr
Wind risk 1/10 · Minimal
- Chance of severe wind over 30 yrs
- 1.0%
Air-quality risk 2/10 · Minimal
- Unhealthy air days now
- 0 days/yr
- Unhealthy air days in 30 yrs
- 1 days/yr
Risk factors via First Street. Map © Google.
Why this score? — see what drove the D- grade
The composite is a weighted blend of 9 inputs, each scored 0–100. Each bar is that input's sub-score; the figure is the points it added to the 100-point composite (weight × sub-score).
- Cash flow +14.0/30.0
- ARV discount +5.0/15.0
- DSCR +4.2/10.0
- Livability +4.2/5.0
- Schools +3.0/10.0
- 1% rule +2.9/10.0
- Rent growth +2.5/5.0
- Condition / age +2.5/5.0
- Appreciation +0.0/10.0
$209,900
🖨 Deal sheet 📄 Offer letter ✓ Due diligence
Listing remarks MLS
Charming 3 bedroom home with access ramp to the first door. First floor offers living room, dining room, and kitchen with access to laundry. First floor bedroom with 2 additional bedrooms on the second floor. One stall garage, storage space in basement, and a huge flat backyard!
Key facts
- Attached garage
- Small front deck
- Mudroom
Tags
Property features AI
Finance
- Financial info: Tax annual amount provided but excluded from details
- HOA & community: Community amenities: Golf, Pool, Tennis courts
Exterior
- Parking: Attached garage (1 garage space); On-street parking available; Off-street parking available
- Security: Smoke detector(s)
- Utilities: Public water; Public sewer; Cable available
- Home design: Single family residence (detached); 2 stories
- Construction: Frame construction with vinyl siding; Shingle roof; Built on foundation (year built not provided)
- Exterior features: Deck; Porch; Level lot
Interior
- Kitchen: Dishwasher; Microwave; Range; Refrigerator
- Bedrooms: 7 total rooms (bedroom count not specified)
- Flooring: Laminate; Vinyl; Wood
- Bathrooms: 1 full bathroom
- Heating & cooling: Forced air heating (natural gas); Central air conditioning
- Interior features: Dishwasher; Microwave; Range; Refrigerator; Dryer; Washer; Concrete partial unfinished walk-out basement; Smoke detector(s)
- Laundry & utility: Washer; Dryer
Neighborhood map
What this means for you Summary
Snapshot
- This is a 3-bed/1.5-bath single-family listed at $210k.
Deal economics
- At list price, monthly cash flow is $27 ($328/yr) — positive.
- The deal already cash-flows at list — no discount required.
- To meet the 1% rule (rent ≥ 1% of price), the offer needs to be $165k (21.5% below list).
- Recommended offer: $165k (21.5% below list) — sets the bar for 1% rule.
- Cap rate 6.4% vs local median 2.5% in Bridgeport — top-decile yield for the area; either an underpriced asset or a hidden risk that comps aren't pricing in. Stress-test before assuming the spread holds.
Location & tenants
- Location reads 85/100 on livability (#4 in WV, #620 nationally) — a professional / high-income tenant draw. Strengths: employment A+, cost of living A+, housing A+; Watch: amenities D-, commute F.
- Harrison County Schools (town): math 29% / reading 43% proficiency, ranked #12 of 55 in WV (top 22%) — families likely to look elsewhere, expect single-tenant / working-renter base with shorter leases.
- Zoned schools: Simpson Elementary School (math 42% / reading 42%, grade F, #87 of 377 statewide, top 28%, 420 students, 0% FRL); Bridgeport Middle School (math 43% / reading 63%, grade C+, #3 of 109 statewide, top 2%, 603 students, 0% FRL); Bridgeport High School (math 47% / reading 72%, grade C+, #3 of 110 statewide, top 2%, 808 students, 0% FRL) — zoned schools average 0% FRL vs 43% district-wide (43 pts lower); this property's tenant base skews higher-income than the district average.
- Zoned-school proficiency averages 52% at this address vs 36% district-wide (+16 pts) — the actual schools serving this property are materially stronger than the Harrison County Schools average implies; a family-tenant draw the district grade alone would hide.
- Market conditions: 117 active listings in the ZIP; solid renter incomes; 84 units permitted in Harrison County in 2024 (5 in 5+ unit buildings).
Forward outlook
- Local home prices are declining (-3.0%/yr); year-one equity from $1k of loan paydown is wiped out by about $6k of value loss. Plan a longer hold.
- Harrison County population projected at -11% by 2050 — secular population decline; favor cash flow + early exit over multi-decade hold.
Negotiation context
- It's been on market 109 days — a 9% lower offer ($191k) is reasonable based on typical stale-listing flexibility.
- 2 sale attempts since 5y ago; this cycle's ask has dropped $20k (9%) from the opening price — seller is motivated, your offer sets the floor, not the list.
- Current owner paid $115k; list at $210k implies a 83% gain — meaningful room to come down on a strong offer.
Risks & watch-outs
- Watch-outs: built in 1952 — expect roof / HVAC / electrical / plumbing capex.
Questions for the listing agent
- It's been on market 109 days. Have you received any prior offers? Is the seller open to a 21% concession, seller financing, or rate buy-down credit?
- Built in 1952 — when were the roof, HVAC, electrical panel, plumbing, and water heater last replaced?
- Why hasn't it sold? Are there any deal-killer items the seller is aware of (foundation, flood, title, zoning, code violations)?
- Is there a deadline driving the sale (1031 exchange, divorce, estate, relocation)? That informs how much negotiation room exists.
- Schools are A-rated — typically a magnet for longer-tenancy family renters. What's the average tenant stay here, and is there a school-zone premium baked into asking?
- The area grade is low — what's the realistic commute time and amenity access for the typical tenant pool here? Any planned neighborhood developments (good or bad) we should know about?
- What's the average days-on-market for RENTAL listings here right now (not sales)? A rising rental-DOM trend means longer vacancies and softer asking-rent achievability than the comps imply.
- What's the recent tenant-quality profile in this submarket — average credit score on applications, eviction rate, late-payment / NSF rate, and stable-employment percentage? A property-management company in the area should have these aggregated.
- How much new for-sale + rental construction is in the pipeline within 1–3 miles? Heavy new supply typically softens prices + rents 12–24 months out; constrained supply supports both.
Investment metrics
- 1% rule
- 0.79% ✗
- Cap rate
- 6.45%
- Cash-on-cash
- 0.56%
- DSCR
- 1.02
- GRM
- 10.6
CMA / ARV
- ARV (on-the-fly)
- $199,022
- Comps found
- 6
Show comp detail 6 sales within ~0.75 mi
| Address | Dist | Beds/Ba | Sqft | Sold | Price | $/sf | Match |
|---|---|---|---|---|---|---|---|
| 110 E Smith | 0.48mi | 3/1.0 | 1,050 (+1%) | 1mo | $210,000 | $200 | 73 |
| 403 Willis | 0.38mi | 2/1.0 (-1) | 1,024 (-2%) | 11mo | $179,900 | $176 | 64 |
| 115 Liberty | 0.38mi | 3/1.5 | 960 (-8%) | 15mo | $205,000 | $214 | 57 |
| 218 Cherry | 0.35mi | 3/2.0 | 1,152 (+11%) | 11mo | $199,000 | $173 | 55 |
| 416 Cherry St | 0.25mi | 3/1.5 | 1,196 (+15%) | 11mo | $190,000 | $159 | 54 |
| 210 E Olive | 0.53mi | 3/1.0 | 1,126 (+8%) | 7mo | $215,000 | $191 | 54 |
Match score weights: distance 35% · size 25% · config 20% · recency 20%. Top-matched comps best support the ARV.
Projected returns pro-forma
-3.0% appreciation · 3.0% rent growth · sell at horizon
- IRR
- -15.5%
- Equity multiple
- 0.45×
- Total profit
- $-32,355
- Equity at exit
- $31,297
- IRR
- -7.0%
- Equity multiple
- 0.55×
- Total profit
- $-26,269
- Equity at exit
- $18,148
Cash invested: $58,772 (down + closing). Projections, not guarantees.
Landlord ↔ Tenant lean methodology
- Overall (STATE)
- 83 Strongly Landlord-Friendly
- State West Virginia
- 83 Strongly Landlord-Friendly · R+22
- County
- — inherits STATE
- City
- — inherits STATE
ZIP-level market 26330
- Home prices YoY
- -17.6%
- Active inventory
- 117
- Price-to-rent
- 10.6×
Monthly cashflow live
- Estimated rent
- $1,648 medium interval (Pro) →
- Mortgage (P&I)
- −$1,101
- Tax from tax record
- −$87 /mo · $1,041/yr
- Insurance
- −$87
- HOA
- −$0
- Vacancy / Maint / Mgmt
- −$346
- Net cashflow
- $27
Break-even live
UW: 25.0% down · 7.5% · 30yr · 1.5% tax · 5.0% vac · 8.0% maint · 8.0% mgmt
Financing live
Cash to close
- Down payment
- $52,475
- Closing costs
- $6,297
- Reserves months
- —
- Total cash needed
- —
Loan-product check · same deal, 3 products live
Conventional
25% down · 7.5% · 30yr
- Down + closing
- —
- Monthly P&I
- —
- Monthly cashflow
- —
- DSCR
- —
- Eligible?
- —
Personal DTI + credit; lowest rate.
DSCR
20% down · 8.5% · 30yr
- Down + closing
- —
- Monthly P&I
- —
- Monthly cashflow
- —
- DSCR
- —
- Eligible?
- —
No personal income docs; deal must DSCR.
Hard money
10% down · 12.0% · 12mo
- Down + closing
- —
- Monthly P&I
- —
- Monthly cashflow
- —
- DSCR
- —
- Eligible?
- —
Short-term bridge; refi at stabilization.
Listing history 25 events
-
2026-06-19days on market $209,900 Active 109 DOM
-
2026-06-18days on market $209,900 Active 108 DOM
-
2026-06-17price $209,900 Active 107 DOM
-
2026-06-17days on market $214,900 Active 107 DOM
-
2026-06-16days on market $214,900 Active 106 DOM
-
2026-06-15days on market $214,900 Active 105 DOM
-
2026-06-14days on market $214,900 Active 103 DOM
-
2026-06-12days on market $214,900 Active 102 DOM
-
2026-06-09days on market $214,900 Active 99 DOM
-
2026-06-08days on market $214,900 Active 98 DOM
-
2026-06-07days on market $214,900 Active 97 DOM
-
2026-06-05days on market $214,900 Active 94 DOM
-
2026-06-03days on market $214,900 Active 93 DOM
-
2026-06-02days on market $214,900 Active 92 DOM
-
2026-06-01days on market $214,900 Active 91 DOM
-
2026-05-31days on market $214,900 Active 90 DOM
-
2026-05-30days on market $214,900 Active 89 DOM
-
2026-05-07price $214,900
-
2026-04-25price $219,900
-
2026-04-12price $224,900
-
2026-03-03$229,900 Active
-
2025-05-19soldstatus $115,000
-
2021-11-29soldstatus $107,000
-
2021-11-23soldstatus $107,000 279-char remark
Show marketing remark (279 chars)
Charming 3 bedroom home with access ramp to the first door. First floor offers living room, dining room, and kitchen with access to laundry. First floor bedroom with 2 additional bedrooms on the second floor. One stall garage, storage space in basement, and a huge flat backyard!
-
2021-07-07$129,900 279-char remark
Show marketing remark (279 chars)
Charming 3 bedroom home with access ramp to the first door. First floor offers living room, dining room, and kitchen with access to laundry. First floor bedroom with 2 additional bedrooms on the second floor. One stall garage, storage space in basement, and a huge flat backyard!
ⓘ Source: listings_history table (triggers on properties + properties_extension) + one-shot
backfill from property_details.listing_events for pre-trigger history.
Tax reassessment forecast WV · Resets to sale price
- Current annual tax
- $1,041 · $87/mo
- Projected year-2 tax
- $1,238 · $103/mo
- Expected delta
- +$197/yr (+$16/mo · 19.0%)
ⓘ Screening estimate from a state-policy table — verify with the county assessor before closing.
Climate risk First Street
- Flood 1/10 Low FEMA zone X (unshaded) · 0% chance over 30 yrs
- Wildfire 3/10 Moderate
- Heat 4/10 Moderate 7 d/yr ≥97°F today · 19 d/yr by 30 yrs out
- Wind 1/10 Low 100% chance of damaging wind over 30 yrs
- Air quality 2/10 Low 0 unhealthy d/yr today · 1 by 30 yrs out
Nearby sold comps map
Loading sold comps map…
Walkable amenities ~0.75 mi
Loading nearby amenities…
Taxation est. · year 1
- Rental income
- $19,782
- − Mortgage interest
- −$11,758
- − Property taxes
- −$1,041
- − Insurance
- −$1,050
- − Repairs & maintenance
- −$1,583
- − Management
- −$1,583
- − Depreciation
- −$6,106
- Taxable loss
- −$3,338
- Est. tax savings @ 24.0%
- +$801
- After-tax cash flow
- $1,129/yr
For passive investors: Depreciation is non-cash, so a rental often shows a tax loss while cash-flowing — sheltering income. Rental losses are passive: they offset passive income freely, and up to $25,000/yr can offset ordinary (W-2) income if you actively participate and your MAGI is under $100k (phasing out to $0 by $150k); unused losses carry forward. On sale, claimed depreciation is recaptured at up to 25%, and gains may owe capital-gains tax (a 1031 exchange can defer both). Figures are a year-1 estimate at your 24.0% rate — not tax advice; consult a CPA.
Schools (NCES district)
- District
- Harrison County Schools
- NCES district ID
- 5400510
- Math proficiency
- 29% ▼ -10.00%
- Reading proficiency
- 43% ▼ -3.00%
- Median HH income
- $43,269
- Composite
- 30.48/100
- National rank
- #6222
- State rank
- #12 of 55 in WV
Livability — Bridgeport
- Score
- 85/100
- State rank
- #4
- US rank
- #620
Category grades
Schools grade is shown separately in the Schools card above.
Census & demographics
- Census place
- Bridgeport, WV
- County
- Harrison County · 44,316 people
- City population
- 15,600
- Metro
- Clarksburg, WV
- Population (ZIP)
- 15,600
- Household income
- $88,962
- Rent vs Own
- Severe rent burden
- 219.0
Population outlook (Harrison County) Hauer SSP2
- Today (2025)
- 67,273 people
- By 2030
- 65,963 · -1.9%
- By 2040
- 63,033 · -6.3%
- By 2050
- 59,999 · -10.8%
- By 2075
- 52,524 · -21.9%
- By 2100
- 42,654 · -36.6%
Race, ethnicity, and origin ACS 2023
- Neighborhood character
- Predominantly White (90%)
- Race & ethnicity
- White 90% Two or more races 4% Hispanic / Latino 3% Asian 2% Black 1%
- Common ancestry
- Romanian 4% Serbian 3% Slovak 2%
- Foreign-born
- 2% · China
- Languages at home
- 96% English-only · Chinese 1% Russian/Polish/Slavic 1% Other Indo-European 1%
Political lean MEDSL · Harrison
- 2024 margin
- Solid R (+41.0) · D 28.5% · R 69.4% · Other 2.1%
- 2008→2024 swing
- -27.6pp toward R · 2008: -13.3pp · 2024: -41.0pp
- All cycles
- 2024: R+41.0 2020: R+37.6 2016: R+39.5 2012: R+23.5 2008: R+13.3
Not yet ingested
- Civics
- —
Market trends
- HPI YoY
- ▼ -53.10%
- Current HPI
- 249.1427
- Rent YoY
- —
- Metro
- Clarksburg, WV
- State GDP YoY
- —
- F500 in state
- 0
Price history
+65.4% since first listed8 events — show timeline
- 2026-05-07 Price Changed $214,900 NCWVREIN
- 2026-04-25 Price Changed $219,900 NCWVREIN
- 2026-04-12 Price Changed $224,900 NCWVREIN
- 2026-03-03 Listed $229,900 NCWVREIN
- 2025-05-19 Sold (Public Records) $115,000 Public Records
- 2021-11-29 Sold (Public Records) $107,000 Public Records
- 2021-11-23 Sold (MLS) $107,000 NCWVREIN
- 2021-07-07 Listed $129,900 NCWVREIN
Property tax history
-5.7%/yrLatest (2025): $1,041 · +6.9% YoY. Source: county tax records.
Cash-flow waterfall
monthlySold comps — $/sqft
last 12 mo · ≤1 miLoading sold comps…