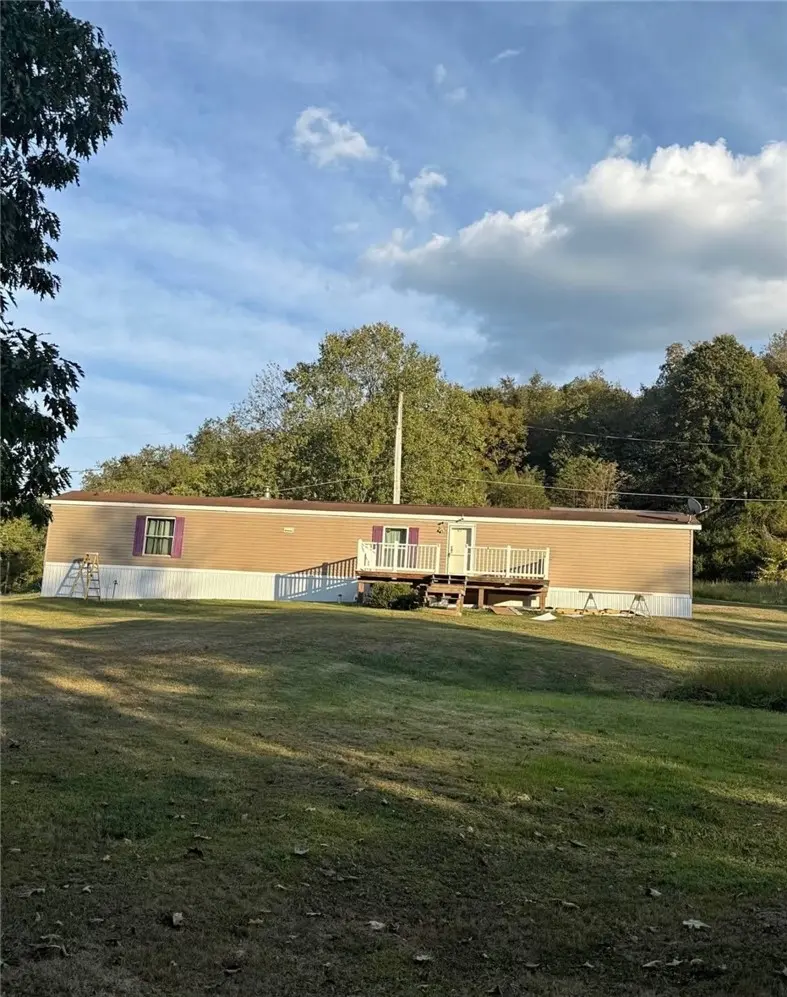
207 Corvi St · Bolivar, PA
Flood risk 4/10 · Minor
- FEMA flood zone
- X (unshaded)
- Chance of flooding over 30 yrs
- 0.24%
- Est. flood insurance / yr
- $507 – $1,088
Fire risk 1/10 · Minimal
- Est. fire insurance / yr
- $511 – $949
Heat risk 3/10 · Minor
- Hot days now (above 95°F)
- 8 days/yr
- Hot days in 30 yrs
- 21 days/yr
Wind risk 2/10 · Minimal
- Chance of severe wind over 30 yrs
- —
Air-quality risk 2/10 · Minimal
- Unhealthy air days now
- 1 days/yr
- Unhealthy air days in 30 yrs
- 3 days/yr
Risk factors via First Street. Map © Google.
Why this score? — see what drove the B grade
The composite is a weighted blend of 9 inputs, each scored 0–100. Each bar is that input's sub-score; the figure is the points it added to the 100-point composite (weight × sub-score).
- Cash flow +30.0/30.0
- 1% rule +10.0/10.0
- DSCR +10.0/10.0
- ARV discount +7.5/15.0
- Appreciation +5.5/10.0
- Schools +3.6/10.0
- Livability +3.0/5.0
- Rent growth +2.5/5.0
- Condition / age +2.2/5.0
$70,000
🖨 Deal sheet (PDF) 📄 Offer letter ✓ Due diligence
Listing remarks
Enjoy one-floor living in this 3 bedroom 2 bath 2002 Colony mobile home tucked into a quiet corner in Bolivar.
Key facts
- 6,011 sq ft lot
- 3 parking spots
- Built 2002
Property features AI
Exterior
- Parking: Off-street parking for 3 vehicles
- Utilities: Public water; Septic tank
- Home design: Single-story home; Resale property
- Construction: Vinyl siding; Asphalt roof
- Exterior features: Lot dimensions approximately 59 x 122 x 37 x 123
Interior
- Kitchen: Main-level kitchen (about 13 x 10)
- Bedrooms: Two main-level bedrooms (each about 10 x 10); Additional bedroom/room at main level (about 13 x 12)
- Flooring: Carpet; Vinyl
- Bathrooms: Two full bathrooms
- Heating & cooling: Forced air heating (propane); Central air conditioning
- Interior features: Carpet and vinyl flooring
- Laundry & utility: Main-level laundry room
Neighborhood map
What this means for you Summary
Snapshot
- This is a 3-bed/2.0-bath manufactured listed at $70k. Condition is rated fair.
Deal economics
- At list price, monthly cash flow is $352 ($4k/yr) — positive.
- The deal already cash-flows at list — no discount required.
- Meets the 1% rule at list price ($1k rent vs $70k).
- Recommended offer: $68k (3.0% below list) — sets the bar for market timing.
Location & tenants
- Location reads 60/100 on livability (#1,466 in PA) — a middle-class / working-renter tenant base. Strengths: cost of living A+, housing A+; Watch: crime C-, employment D+, amenities F.
- Ligonier Valley SD (rural): math 28% / reading 57% proficiency, ranked #310 of 539 in PA (top 58%) — families likely to look elsewhere, expect single-tenant / working-renter base with shorter leases.
- Zoned schools: Laurel Valley El Sch (math 17% / reading 52%, grade F, #1,049 of 1,518 statewide, top 71%, 235 students, 100% FRL); Ligonier Valley Ms (math 13% / reading 55%, grade F, #334 of 512 statewide, top 67%, 310 students, 43% FRL); Ligonier Valley Hs (math 67%, 438 students, 23% FRL) — zoned schools average 55% FRL vs 32% district-wide (24 pts higher); higher-poverty schools than district average — tighter screening recommended.
- Market conditions: 9 active listings in the ZIP; 415 units permitted in Westmoreland County in 2024 (10 in 5+ unit buildings).
Forward outlook
- In year one you build about $1k of equity ($484 loan paydown + $713 appreciation (1.0% local appreciation)).
- Westmoreland County population projected at -19% by 2050 — secular population decline; favor cash flow + early exit over multi-decade hold.
- At projected returns (1.0% appreciation + 3.0% rent growth), your $20k cash investment doubles in ~4 years — after that, you're playing with house money.
Negotiation context
- It's been on market 46 days — a 3% lower offer ($68k) is reasonable based on typical stale-listing flexibility.
Questions for the listing agent
- It's been on market 46 days. Have you received any prior offers? Is the seller open to a 3% concession, seller financing, or rate buy-down credit?
- Have any recent inspections been done? Can we get a copy of the seller's disclosures and any deferred-maintenance estimates?
- Is there a deadline driving the sale (1031 exchange, divorce, estate, relocation)? That informs how much negotiation room exists.
- Schools are F-rated, which usually means shorter tenancies and higher turnover. Who's the typical renter profile here, and what's been the actual vacancy rate?
- What's the average days-on-market for RENTAL listings here right now (not sales)? A rising rental-DOM trend means longer vacancies and softer asking-rent achievability than the comps imply.
- What's the recent tenant-quality profile in this submarket — average credit score on applications, eviction rate, late-payment / NSF rate, and stable-employment percentage? A property-management company in the area should have these aggregated.
- How much new for-sale + rental construction is in the pipeline within 1–3 miles? Heavy new supply typically softens prices + rents 12–24 months out; constrained supply supports both.
Investment metrics
- 1% rule
- 1.51% ✓
- Cap rate
- 12.32%
- Cash-on-cash
- 21.53%
- DSCR
- 1.96
- GRM
- 5.5
CMA / ARV
- ARV (median comp)
- $23,947
- List price
- $70,000
- Delta
- 192.31%
- Verdict
- OVERPRICED
- Comps
- 1 within 2.0 mi
Show comp detail 2 sales within ~0.75 mi
| Address | Dist | Beds/Ba | Sqft | Sold | Price | $/sf | Match |
|---|---|---|---|---|---|---|---|
| 675 Washington St | 0.25mi | 2/1.5 (-1) | 1,106 (-1%) | 9mo | $26,000 | $24 | 72 |
| 127 Corvi St | 0.01mi | 3/2.0 | 952 (-15%) | 16mo | $11,000 | $12 | 61 |
Match score weights: distance 35% · size 25% · config 20% · recency 20%. Top-matched comps best support the ARV.
Projected returns pro-forma
1.02% appreciation · 3.0% rent growth · sell at horizon
- IRR
- 23.7%
- Equity multiple
- 2.21×
- Total profit
- $23,790
- Equity at exit
- $23,967
- IRR
- 26.5%
- Equity multiple
- 4.21×
- Total profit
- $62,849
- Equity at exit
- $31,903
Cash invested: $19,600 (down + closing). Projections, not guarantees.
Landlord ↔ Tenant lean methodology
- Overall (STATE)
- 62 Landlord-Friendly
- State Pennsylvania
- 62 Landlord-Friendly · EVEN
- County
- — inherits STATE
- City
- — inherits STATE
ZIP-level market 15923
- Home prices YoY
- 1.1%
- Active inventory
- 9
- Price-to-rent
- 5.5×
Monthly cashflow live
- Estimated rent
- $1,058 medium interval (Pro) →
- Mortgage (P&I)
- −$367
- Tax est. 1.5%
- −$88 /mo · $1,050/yr
- Insurance
- −$29
- HOA
- −$0
- Vacancy / Maint / Mgmt
- −$222
- Net cashflow
- $352
Break-even live
Sensitivity live
| Price | -10% $400 | -5% $376 | +0% $352 | +5% $327 | +10% $303 |
|---|---|---|---|---|---|
| Rent | -10% $268 | -5% $310 | +0% $352 | +5% $393 | +10% $435 |
| Rate | -1.0pp $387 | -0.5pp $369 | base $352 | +0.5pp $334 | +1.0pp $315 |
UW: 25.0% down · 7.5% · 30yr · 1.5% tax · 5.0% vac · 8.0% maint · 8.0% mgmt
Financing live
Cash to close
- Down payment
- $17,500
- Closing costs
- $2,100
- Reserves months
- —
- Total cash needed
- —
Loan-product check · same deal, 3 products live
Conventional
25% down · 7.5% · 30yr
- Down + closing
- —
- Monthly P&I
- —
- Monthly cashflow
- —
- DSCR
- —
- Eligible?
- —
Personal DTI + credit; lowest rate.
DSCR
20% down · 8.5% · 30yr
- Down + closing
- —
- Monthly P&I
- —
- Monthly cashflow
- —
- DSCR
- —
- Eligible?
- —
No personal income docs; deal must DSCR.
Hard money
10% down · 12.0% · 12mo
- Down + closing
- —
- Monthly P&I
- —
- Monthly cashflow
- —
- DSCR
- —
- Eligible?
- —
Short-term bridge; refi at stabilization.
Listing history 15 events
-
2026-06-21days on market $70,000 Active 46 DOM
-
2026-06-18days on market $70,000 Active 43 DOM
-
2026-06-17days on market $70,000 Active 42 DOM
-
2026-06-16days on market $70,000 Active 41 DOM
-
2026-06-15days on market $70,000 Active 40 DOM
-
2026-06-13days on market $70,000 Active 38 DOM
-
2026-06-09days on market $70,000 Active 34 DOM
-
2026-06-08days on market $70,000 Active 33 DOM
-
2026-06-07days on market $70,000 Active 32 DOM
-
2026-06-05days on market $70,000 Active 29 DOM
-
2026-06-03days on market $70,000 Active 28 DOM
-
2026-06-02days on market $70,000 Active 27 DOM
-
2026-06-01days on market $70,000 Active 26 DOM
-
2026-05-31days on market $70,000 Active 25 DOM
-
2026-05-06$85,000 Active 110-char remark
ⓘ Source: listings_history table (triggers on properties + properties_extension) + one-shot
backfill from property_details.listing_events for pre-trigger history.
Climate risk First Street
- Flood 4/10 Moderate FEMA zone X (unshaded) · 24% chance over 30 yrs
- Wildfire 1/10 Low
- Heat 3/10 Moderate 8 d/yr ≥95°F today · 21 d/yr by 30 yrs out
- Wind 2/10 Low
- Air quality 2/10 Low 1 unhealthy d/yr today · 3 by 30 yrs out
Nearby sold comps map
Loading sold comps map…
Walkable amenities ~0.75 mi
Loading nearby amenities…
Taxation est. · year 1
- Rental income
- $12,690
- − Mortgage interest
- −$3,921
- − Property taxes
- −$1,050
- − Insurance
- −$350
- − Repairs & maintenance
- −$1,015
- − Management
- −$1,015
- − Depreciation
- −$2,036
- Taxable income
- $3,302
- Est. tax owed @ 24.0%
- −$793
- After-tax cash flow
- $3,428/yr
For passive investors: Depreciation is non-cash, so a rental often shows a tax loss while cash-flowing — sheltering income. Rental losses are passive: they offset passive income freely, and up to $25,000/yr can offset ordinary (W-2) income if you actively participate and your MAGI is under $100k (phasing out to $0 by $150k); unused losses carry forward. On sale, claimed depreciation is recaptured at up to 25%, and gains may owe capital-gains tax (a 1031 exchange can defer both). Figures are a year-1 estimate at your 24.0% rate — not tax advice; consult a CPA.
Condition & rehab AI · 11 photos
This mobile home requires significant repairs to the roof and exterior, along with maintenance to the interior walls and flooring. Landscaping and driveway improvements would also enhance its curb appeal and value.
Repairs flagged
- Major roof — The satellite image shows signs of significant wear.
- Major exterior siding — The satellite image shows weathered and possibly damaged siding.
- Major landscaping — The satellite image shows minimal landscaping and a gravel driveway, which may not be appealing to potential buyers or renters.
Value-add opportunities
- Resale paint interior walls — Fresh paint can make a significant difference in the home's appearance and appeal.
- Resale repair and replace hardwood flooring — New flooring can improve the home's overall condition and value.
- Both landscaping and driveway improvements — A well-maintained exterior can enhance curb appeal and attract both buyers and renters.
Renovation cost estimate screening
| Repair item | Severity | Est. cost |
|---|---|---|
| roof · The satellite image shows signs of significant wear. | Major | $15,000–50,000 |
| exterior siding · The satellite image shows weathered and possibly damaged siding. | Major | $15,000–50,000 |
| landscaping · The satellite image shows minimal landscaping and a gravel driveway, which may not be appealing to potential buyers or renters. | Major | $15,000–50,000 |
| Total estimated repair cost · 3 items | $45,000–150,000 |
Value-add ROI direction
- Resale paint interior walls — Fresh paint can make a significant difference in the home's appearance and appeal. ↑
- Resale repair and replace hardwood flooring — New flooring can improve the home's overall condition and value. ↑
- Both landscaping and driveway improvements — A well-maintained exterior can enhance curb appeal and attract both buyers and renters. ↑
ⓘ Cost ranges are severity-bucket heuristics (US national rule-of-thumb). Get contractor quotes + a written scope before underwriting a rehab budget.
Schools (NCES district)
- District
- Ligonier Valley SD
- NCES district ID
- 4213710
- Math proficiency
- 28% ▼ -16.00%
- Reading proficiency
- 57% ▼ -11.00%
- Median HH income
- $47,879
- Composite
- 36.25/100
- National rank
- #4714
- State rank
- #310 of 539 in PA
Livability — Bolivar
- Score
- 60/100
- State rank
- #1466
- US rank
- #18921
Category grades
Schools grade is shown separately in the Schools card above.
Census & demographics
- Population (ZIP)
- 1,609
Population outlook (Westmoreland County) Hauer SSP2
- Today (2025)
- 342,555 people
- By 2030
- 331,717 · -3.2%
- By 2040
- 304,976 · -11.0%
- By 2050
- 277,444 · -19.0%
- By 2075
- 224,607 · -34.4%
- By 2100
- 171,084 · -50.1%
Race, ethnicity, and origin ACS 2023
- Neighborhood character
- Predominantly White (96%)
- Race & ethnicity
- White 96% Two or more races 2% Black 1%
- Common ancestry
- Romanian 5% Slovak 5% Iranian 4%
- Foreign-born
- 0% · South Korea
- Languages at home
- 99% English-only · Korean 1%
Political lean MEDSL · Westmoreland
- 2024 margin
- Strong R (+28.4) · D 35.4% · R 63.9%
- 2008→2024 swing
- -11.7pp toward R · 2008: -16.7pp · 2024: -28.4pp
- All cycles
- 2024: R+28.4 2020: R+28.3 2016: R+31.3 2012: R+23.7 2008: R+16.7
Not yet ingested
- Civics
- —
Market trends
- HPI YoY
- ▲ 1.02%
- Current HPI
- 92.0514
- Rent YoY
- —
- Metro
- —
- State GDP YoY
- ▲ 1.68%
- F500 in state
- 34
Industry mix (Fortune 500 HQ in PA)
| Industry | F500 HQs | Revenue |
|---|---|---|
| Healthcare | 2 | $309B |
|
||
| Insurance | 2 | $27B |
|
||
| Telecommunications / Media | 1 | $124B |
|
||
| Industrial Distribution | 1 | $22B |
|
||
| Financial Services | 1 | $20B |
|
||
| Chemicals / Materials | 1 | $18B |
|
||
Price history
-17.6% since first listed2 events — show timeline
- 2026-05-20 Price Changed $70,000 West Penn MLS
- 2026-05-06 Listed $85,000 West Penn MLS
Cash-flow waterfall
monthlySold comps — $/sqft
last 12 mo · ≤1 miLoading sold comps…