 🌊 Lakefront
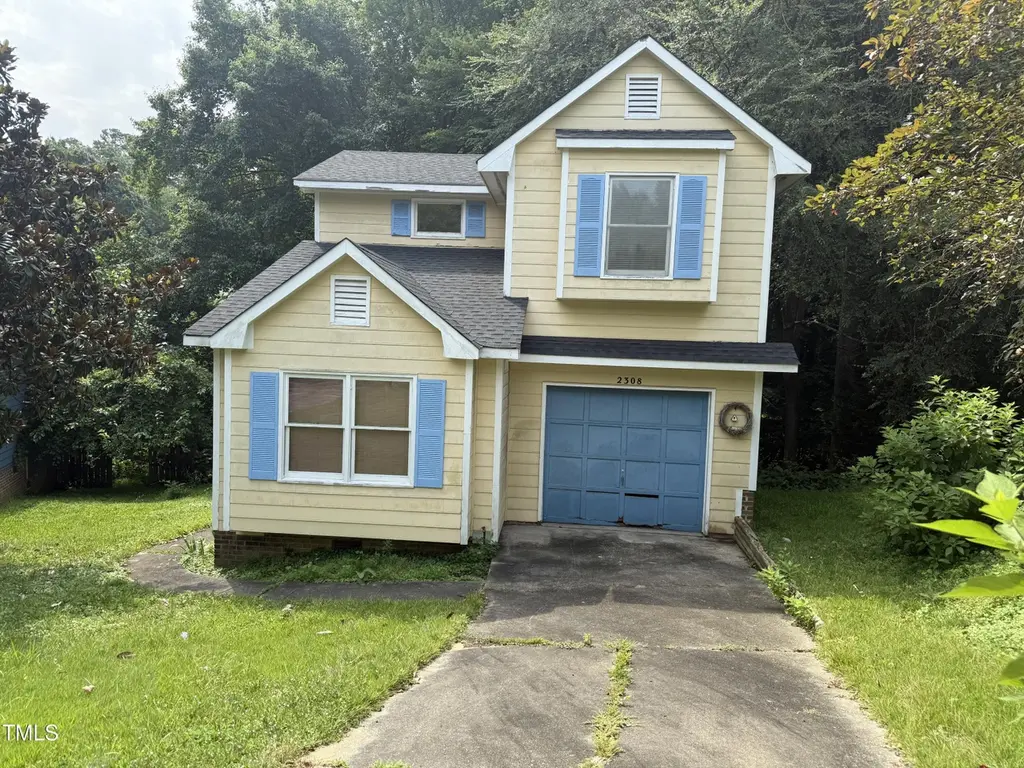
2308 Stonesthrow Ct · Raleigh, NC
Flood risk 5/10 · Moderate
- FEMA flood zone
- X (unshaded)
- Chance of flooding over 30 yrs
- 0.67%
- Est. flood insurance / yr
- $507 – $1,088
Fire risk 1/10 · Minimal
- Est. fire insurance / yr
- $906 – $1,684
Heat risk 6/10 · Moderate
- Hot days now (above 105°F)
- 7 days/yr
- Hot days in 30 yrs
- 17 days/yr
Wind risk 6/10 · Moderate
- Chance of severe wind over 30 yrs
- 57.0%
Air-quality risk 3/10 · Minor
- Unhealthy air days now
- 2 days/yr
- Unhealthy air days in 30 yrs
- 2 days/yr
Risk factors via First Street. Map © Google.
Why this score? — see what drove the D grade
The composite is a weighted blend of 9 inputs, each scored 0–100. Each bar is that input's sub-score; the figure is the points it added to the 100-point composite (weight × sub-score).
- Cash flow +13.3/30.0
- ARV discount +7.5/15.0
- Schools +4.9/10.0
- Livability +4.2/5.0
- DSCR +4.0/10.0
- 1% rule +3.5/10.0
- Rent growth +2.6/5.0
- Condition / age +2.5/5.0
- Appreciation +0.0/10.0
$240,000
🖨 Deal sheet (PDF) 📄 Offer letter ✓ Due diligence
Listing remarks
3BR/2BA single-family home minutes from Enloe High School and WakeMed. Property requires full renovation--no working HVAC/heat, active mold present. Enter with caution and wear a mask. Roof replaced 2018; prior roof failure caused interior water damage. Do not access back porch. All showings must be accompanied by a licensed real estate agent. No sign on property. Seller makes no representations as to current condition. PROPERTY SOLD AS IS. Excellent opportunity in a sought-after area. HOA dues are $300 a year. Please verify all information. Note road is private maintained by the HOA. PRIVATE ROADS. See covenants.
Key facts
- 7,405 sq ft lot
- Garage
- Built 1989
Property features AI
Finance
- Other: Property located in Wake County; Not a senior community
- HOA & community: Association: Victoria Place Homeowners' Association, Inc.; Annual association fee $300; Association covers insurance, road maintenance, and storm water maintenance
Exterior
- Parking: Attached garage (1 space); Total 2 parking spaces
- Utilities: Public water; Public sewer
- Home design: Site-built property; Two levels
- Construction: Frame construction; Block foundation; Asphalt roof; Built as site-built structure
- Exterior features: Private maintained road; Lot approx. 0.17 acres; Lot dimensions: see plat; Zoned R-4
Interior
- Bedrooms: 3 bedrooms
- Flooring: Carpet; Laminate; See remarks
- Bathrooms: 2 full bathrooms
- Heating & cooling: Heating: see remarks; No central cooling; other/none listed
- Interior features: Carpet and laminate flooring; See remarks for additional interior details
Neighborhood map
What this means for you Summary
Snapshot
- This is a 3-bed/2.5-bath single-family listed at $240k.
Deal economics
- At list price, monthly cash flow is $0 ($0/yr) — negative.
- To cash-flow at today's rent, offer at most $240k (0.0% below list).
- To meet the 1% rule (rent ≥ 1% of price), the offer needs to be $205k (14.7% below list).
- Recommended offer: $205k (14.7% below list) — sets the bar for 1% rule.
- Cap rate 6.3% vs local median 2.7% in Raleigh — top-decile yield for the area; either an underpriced asset or a hidden risk that comps aren't pricing in. Stress-test before assuming the spread holds.
Location & tenants
- Location reads 83/100 on livability (#10 in NC, #1,028 nationally) — a professional / high-income tenant draw. Strengths: amenities A+, commute A+, housing A+; Watch: crime F.
- Wake County Schools (suburban): math 52% / reading 60% proficiency, ranked #35 of 178 in NC (top 20%) — acceptable for families but not a draw, mixed tenant base, ~2y average lease.
- Zoned schools: Hunter Elementary (math 65% / reading 74%, grade A-, #95 of 1,410 statewide, top 7%, 607 students, 27% FRL); Ligon Middle (math 58% / reading 71%, grade A-, #30 of 475 statewide, top 7%, 893 students, 31% FRL); Enloe High (math 64% / reading 75%, grade B, #121 of 535 statewide, top 24%, 2,502 students, 27% FRL) — zoned schools at 28% FRL track the district average.
- Market conditions: Rents flat; 594 active listings in the ZIP; 37 comparable units currently listed for rent nearby; rentals at typical pace (median 22d on market — plan ~3-4 weeks tenant-placement turnaround); 15,249 units permitted in Wake County in 2024 (5,568 in 5+ unit buildings).
- This rent runs 36% of the median local income ($68k/yr) — at the standard rent-burdened threshold; future hikes will face affordability resistance.
Forward outlook
- Local home prices are declining (-3.0%/yr); year-one equity from $2k of loan paydown is wiped out by about $7k of value loss. Plan a longer hold.
- Wake County population projected at +51% by 2050 — long-run rental-demand tailwind backs the buy-and-hold thesis.
Negotiation context
- It's been on market 23 days — a 2% lower offer ($236k) is reasonable based on typical stale-listing flexibility.
- 3 sale attempts with the ask held roughly flat each time — persistent listings suggest the price (not the market) is what's stuck; bring a comps-based counter.
Risks & watch-outs
- Climate carrying-cost: moderate flood risk; major wind risk, 57% chance of damaging wind over 30y; extreme-heat days projected 7→17/yr by 2055 (HVAC capex compounding) — expect insurance premiums to compound above CPI over the hold.
Questions for the listing agent
- What do current leases actually rent for vs. the listed asking? Can we see a recent rent roll and the last 12 months of T-12 income?
- What does the HOA fee cover, when was the last increase, and are there any pending special assessments or reserve-fund shortfalls?
- Is there a deadline driving the sale (1031 exchange, divorce, estate, relocation)? That informs how much negotiation room exists.
- Schools are B-rated — typically a magnet for longer-tenancy family renters. What's the average tenant stay here, and is there a school-zone premium baked into asking?
- Crime grade is F in this area — have there been break-ins, vandalism, or insurance claims at this property in the last 3 years? What carrier currently insures it and at what premium?
- The area grade is low — what's the realistic commute time and amenity access for the typical tenant pool here? Any planned neighborhood developments (good or bad) we should know about?
- This sits on a lake — are riparian / water-frontage rights deeded with the parcel? Any dock permits, shoreline easements, or HOA water-use restrictions?
- What's the documented flood / surge / shoreline-erosion history here (FEMA AND non-FEMA — e.g., storm surge, creek backup, septic-field saturation)?
- Any water-quality or seasonal algae-bloom issues that affect tenant satisfaction or short-term-rental demand?
- What's the average days-on-market for RENTAL listings here right now (not sales)? A rising rental-DOM trend means longer vacancies and softer asking-rent achievability than the comps imply.
- What's the recent tenant-quality profile in this submarket — average credit score on applications, eviction rate, late-payment / NSF rate, and stable-employment percentage? A property-management company in the area should have these aggregated.
- How much new for-sale + rental construction is in the pipeline within 1–3 miles? Heavy new supply typically softens prices + rents 12–24 months out; constrained supply supports both.
Investment metrics
- 1% rule
- 0.85% ✗
- Cap rate
- 6.29%
- Cash-on-cash
- -0.00%
- DSCR
- 1.00
- GRM
- 9.8
CMA / ARV
- ARV (on-the-fly)
- $559,837
- Comps found
- 4
Show comp detail 4 sales within ~0.75 mi
| Address | Dist | Beds/Ba | Sqft | Sold | Price | $/sf | Match |
|---|---|---|---|---|---|---|---|
| 2432 Calvert Dr | 0.04mi | 3/1.5 | 1,331 (-15%) | 2mo | $315,000 | $237 | 68 |
| 472 Dickens Dr | 0.09mi | 3/2.0 | 1,415 (-9%) | 23mo | $367,400 | $260 | 59 |
| 2428 Derby Dr | 0.26mi | 3/1.5 | 1,690 (+8%) | 22mo | $449,000 | $266 | 51 |
| 2404 Boswell Rd | 0.54mi | 3/2.0 | 1,683 (+8%) | 16mo | $590,000 | $351 | 46 |
Match score weights: distance 35% · size 25% · config 20% · recency 20%. Top-matched comps best support the ARV.
Projected returns pro-forma
-3.0% appreciation · 0.2% rent growth · sell at horizon
- IRR
- -19.4%
- Equity multiple
- 0.34×
- Total profit
- $-44,497
- Equity at exit
- $35,785
- IRR
- -19.2%
- Equity multiple
- 0.10×
- Total profit
- $-60,493
- Equity at exit
- $20,751
Cash invested: $67,200 (down + closing). Projections, not guarantees.
Landlord ↔ Tenant lean methodology
- Overall (STATE)
- 85 Strongly Landlord-Friendly
- State North Carolina
- 85 Strongly Landlord-Friendly · R+3
- County
- — inherits STATE
- City
- — inherits STATE
ZIP-level market 27610
- Rents YoY
- 0.2%
- Active inventory
- 594
- Price-to-rent
- 9.8×
Monthly cashflow live
- Estimated rent
- $2,047 high interval (Pro) →
- Mortgage (P&I)
- −$1,259
- Tax from tax record
- −$234 /mo · $2,802/yr
- Insurance
- −$100
- HOA
- −$25
- Vacancy / Maint / Mgmt
- −$430
- Net cashflow
- $-0
Break-even live
Sensitivity live
| Price | -10% $136 | -5% $68 | +0% $0 | +5% $-68 | +10% $-136 |
|---|---|---|---|---|---|
| Rent | -10% $-162 | -5% $-81 | +0% $0 | +5% $81 | +10% $162 |
| Rate | -1.0pp $121 | -0.5pp $61 | base $0 | +0.5pp $-62 | +1.0pp $-125 |
UW: 25.0% down · 7.5% · 30yr · 1.5% tax · 5.0% vac · 8.0% maint · 8.0% mgmt
Financing live
Cash to close
- Down payment
- $60,000
- Closing costs
- $7,200
- Reserves months
- —
- Total cash needed
- —
Loan-product check · same deal, 3 products live
Conventional
25% down · 7.5% · 30yr
- Down + closing
- —
- Monthly P&I
- —
- Monthly cashflow
- —
- DSCR
- —
- Eligible?
- —
Personal DTI + credit; lowest rate.
DSCR
20% down · 8.5% · 30yr
- Down + closing
- —
- Monthly P&I
- —
- Monthly cashflow
- —
- DSCR
- —
- Eligible?
- —
No personal income docs; deal must DSCR.
Hard money
10% down · 12.0% · 12mo
- Down + closing
- —
- Monthly P&I
- —
- Monthly cashflow
- —
- DSCR
- —
- Eligible?
- —
Short-term bridge; refi at stabilization.
Rent comps 37 comps
| Address | Beds | Baths | Sqft | Rent | $/sqft | DOM | Units | Dist |
|---|---|---|---|---|---|---|---|---|
| 460 Dickens Dr Raleigh, NC | 3.0 | 2.0 | 1422 | $1,950 | $1.37 | 12d | 1 | 0.10mi |
| 212 N Peartree Ln Raleigh, NC | 3.0 | 1.5 | 1379 | $1,545 | $1.12 | 22d | 1 | 0.43mi |
| 2325 K Wesley Way Raleigh, NC | 3.0 | 2.0 | 1136 | $2,099 | $1.85 | 4d | 1 | 0.67mi |
| 2804 Donovan Pl Raleigh, NC | 3.0 | 1.5 | 1125 | $1,697 | $1.51 | 14d | 1 | 0.68mi |
| 2200 Glascock St Apt G Raleigh, NC | 2.0 | 1.5 | 1100 | $1,200 | $1.09 | 25d | 1 | 0.84mi |
| 1129 Marlborough Rd Raleigh, NC | 3.0 | 2.0 | 1101 | $2,050 | $1.86 | 25d | 1 | 0.87mi |
| 1939 Robin Hill Ln Raleigh, NC | 2.0 | 1.5 | 1643 | $2,200 | $1.34 | 5d | 1 | 0.95mi |
| 2110 Birkhall St Raleigh, NC | 2.0 | 1.0–2.0 | 929 | $2,200 | $2.37 | 3d | 93 | 0.99mi |
| 420 Sustainable Way Raleigh, NC | 4.0 | 3.5 | 2238 | $2,395 | $1.07 | 21d | 1 | 1.01mi |
| 3211 Pridwen Cir Raleigh, NC | 1.0–3.0 | 1.0–2.0 | 1103 | $1,594 | $1.45 | 3d | 17 | 1.08mi |
| 1105 Glascock St Unit 101 Raleigh, NC | 4.0 | 4.0 | 1870 | $2,997 | $1.60 | 23d | 1 | 1.10mi |
| 1105 Glascock St Unit 102 Raleigh, NC | 4.0 | 4.0 | 1870 | $2,997 | $1.60 | 4d | 1 | 1.10mi |
| 1000 Addison Pl Unit 101 Raleigh, NC | 4.0 | 4.0 | 1870 | $2,897 | $1.55 | 25d | 1 | 1.11mi |
| 1000 Addison Pl #102 Raleigh, NC | 3.0 | 3.5 | 1870 | $2,797 | $1.50 | 23d | 1 | 1.11mi |
| 709 Glenbrook Dr Raleigh, NC | 3.0 | 1.0 | 1185 | $1,550 | $1.31 | 25d | 1 | 1.13mi |
| 1704 Sundial Pl Raleigh, NC | 4.0 | 2.0 | 1554 | $1,800 | $1.16 | 5d | 1 | 1.16mi |
| 1701 E Lenoir St Raleigh, NC | 3.0 | 2.0 | 1100 | $2,900 | $2.64 | 25d | 1 | 1.17mi |
| 713 Grantland Dr Raleigh, NC | 3.0 | 3.0 | 1323 | $1,995 | $1.51 | 19d | 1 | 1.20mi |
| 3369 Bridgeville Rd Raleigh, NC | 3.0 | 2.5 | 1200 | $1,699 | $1.42 | 5d | 1 | 1.23mi |
| 825 Rawls Dr Raleigh, NC | 3.0 | 2.0 | 1500 | $1,845 | $1.23 | 14d | 1 | 1.23mi |
| 825 Rawls Dr Raleigh, NC | 3.0 | 2.0 | 1500 | $1,845 | $1.23 | 22d | 1 | 1.23mi |
| 503 Erie Rd Unit 503 Raleigh, NC | 3.0 | 2.5 | 1470 | $1,650 | $1.12 | 16d | 1 | 1.23mi |
| 1309 E Jones St Unit 1309 Raleigh, NC | 2.0 | 1.0 | 1200 | $1,395 | $1.16 | 25d | 1 | 1.24mi |
| 817 Dalewood Dr Raleigh, NC | 3.0 | 2.0 | 1110 | $1,595 | $1.44 | 16d | 1 | 1.27mi |
| 802 Star Ridge Dr Raleigh, NC | 3.0 | 2.5 | 1447 | $1,800 | $1.24 | 18d | 1 | 1.29mi |
| 649 Sunnybrook Rd Raleigh, NC | 3.0 | 1.0 | 2100 | $800 | $0.38 | 21d | 1 | 1.33mi |
| 804 Oak Center Dr Raleigh, NC | 3.0 | 2.5 | 1447 | $1,900 | $1.31 | 21d | 1 | 1.34mi |
| 832 Brigham Rd Raleigh, NC | 3.0 | 1.5 | 1107 | $1,595 | $1.44 | 25d | 1 | 1.34mi |
| 133 S Tarboro St Raleigh, NC | 2.0 | 2.0 | 1150 | $1,495 | $1.30 | 25d | 1 | 1.35mi |
| 838 Oak Center Dr Raleigh, NC | 3.0 | 2.5 | 1463 | $1,995 | $1.36 | 25d | 1 | 1.37mi |
| 1950 N Raleigh Blvd Unit C Raleigh, NC | 2.0 | 2.0 | 1050 | $1,249 | $1.19 | 22d | 1 | 1.40mi |
| 530 Banks St Raleigh, NC | 3.0 | 1.5 | 1241 | $2,399 | $1.93 | 25d | 1 | 1.40mi |
| 1051 Topsail Sound Dr Raleigh, NC | 1.0–3.0 | 1.0–2.0 | 980 | $1,504 | $1.53 | 5d | 1 | 1.45mi |
| 3322 Bell Dr Raleigh, NC | 3.0 | 2.0 | 1569 | $2,100 | $1.34 | 25d | 1 | 1.45mi |
| 1805 Bennett St Raleigh, NC | 2.0 | 1.0 | 1200 | $2,300 | $1.92 | 25d | 1 | 1.47mi |
| 907 E Edenton St Raleigh, NC | 2.0 | 1.0 | 1100 | $1,195 | $1.09 | 25d | 1 | 1.48mi |
| 2080 Brentmoor Dr Raleigh, NC | 2.0 | 2.0 | 1055 | $1,625 | $1.54 | 23d | 1 | 1.49mi |
HOA detail
- Monthly dues
- $25 · $300/yr
- Likely covers
- water
Listing history 8 events
-
2026-04-30status Pending
-
2026-04-06$240,000 Active
-
2025-08-29historical
-
2025-07-25status Pending
-
2025-07-21$350,000 Active
-
2025-06-06historical
-
2025-05-16price $319,000
-
2025-05-10$329,000 Active
ⓘ Source: listings_history table (triggers on properties + properties_extension) + one-shot
backfill from property_details.listing_events for pre-trigger history.
Tax reassessment forecast NC · Resets to sale price
- Current annual tax
- $2,802 · $234/mo
- Projected year-2 tax
- $2,802 · $234/mo
- Expected delta
- $0/yr ($0/mo · 0.0%)
ⓘ Screening estimate from a state-policy table — verify with the county assessor before closing.
Climate risk First Street
- Flood 5/10 Major FEMA zone X (unshaded) · 67% chance over 30 yrs
- Wildfire 1/10 Low
- Heat 6/10 Major 7 d/yr ≥105°F today · 17 d/yr by 30 yrs out
- Wind 6/10 Major 57% chance of damaging wind over 30 yrs
- Air quality 3/10 Moderate 2 unhealthy d/yr today · 2 by 30 yrs out
Nearby sold comps map
Loading sold comps map…
Walkable amenities ~0.75 mi
Loading nearby amenities…
Taxation est. · year 1
- Rental income
- $24,563
- − Mortgage interest
- −$13,444
- − Property taxes
- −$2,802
- − Insurance
- −$1,200
- − Repairs & maintenance
- −$1,965
- − Management
- −$1,965
- − HOA
- −$300
- − Depreciation
- −$6,982
- Taxable loss
- −$4,095
- Est. tax savings @ 24.0%
- +$983
- After-tax cash flow
- $982/yr
For passive investors: Depreciation is non-cash, so a rental often shows a tax loss while cash-flowing — sheltering income. Rental losses are passive: they offset passive income freely, and up to $25,000/yr can offset ordinary (W-2) income if you actively participate and your MAGI is under $100k (phasing out to $0 by $150k); unused losses carry forward. On sale, claimed depreciation is recaptured at up to 25%, and gains may owe capital-gains tax (a 1031 exchange can defer both). Figures are a year-1 estimate at your 24.0% rate — not tax advice; consult a CPA.
Schools (NCES district)
- District
- Wake County Schools
- NCES district ID
- 3704720
- Math proficiency
- 52% ▲ 2.00%
- Reading proficiency
- 60% ▲ 4.00%
- Median HH income
- $67,509
- Composite
- 49.41/100
- National rank
- #2010
- State rank
- #35 of 178 in NC
Livability — Raleigh
- Score
- 83/100
- State rank
- #10
- US rank
- #1028
Category grades
Schools grade is shown separately in the Schools card above.
Census & demographics
- Census place
- Raleigh, NC
- County
- Wake County · 1,216,256 people
- City population
- 569,344
- Metro
- Raleigh-Cary, NC
- Population (ZIP)
- 81,419
- Household income
- $67,932
- Rent vs Own
- Severe rent burden
- 3499.0
Population outlook (Wake County) Hauer SSP2
- Today (2025)
- 1,293,152 people
- By 2030
- 1,428,223 · +10.4%
- By 2040
- 1,698,188 · +31.3%
- By 2050
- 1,955,807 · +51.2%
- By 2075
- 2,520,273 · +94.9%
- By 2100
- 2,893,335 · +123.7%
Race, ethnicity, and origin ACS 2023
- Neighborhood character
- Diverse neighborhood (Simpson 0.59)
- Race & ethnicity
- Black 59% Hispanic / Latino 20% White 15% Two or more races 8% Asian 1%
- Hispanic origin (detail)
- Mexican 10% Puerto Rican 1% Dominican 1%
- Common ancestry
- Lithuanian 1% Slovak 1% Serbian 1%
- Foreign-born
- 14% · Canada
- Languages at home
- 77% English-only · Spanish 18% Arabic 1% French/Haitian/Cajun 1%
Political lean MEDSL · Wake
- 2024 margin
- Strong D (+25.5) · D 61.9% · R 36.4% · Other 1.7%
- 2008→2024 swing
- +11.1pp toward D · 2008: 14.4pp · 2024: 25.5pp
- All cycles
- 2024: D+25.5 2020: D+26.4 2016: D+20.5 2012: D+10.2 2008: D+14.4
Not yet ingested
- Civics
- —
Market trends
- HPI YoY
- ▼ -131.88%
- Current HPI
- 237.704
- Rent YoY
- ▲ 0.20%
- Metro
- Raleigh-Cary, NC
- State GDP YoY
- ▲ 3.28%
- F500 in state
- 26
Industry mix (Fortune 500 HQ in NC)
| Industry | F500 HQs | Revenue |
|---|---|---|
| Financial Services | 2 | $213B |
|
||
| Retail | 2 | $95B |
|
||
| Industrial Conglomerate | 1 | $38B |
|
||
| Metals / Steel | 1 | $35B |
|
||
| Utilities | 1 | $30B |
|
||
| Industrial Machinery | 1 | $19B |
|
||
Price history
-27.1% since first listed8 events — show timeline
- 2026-04-30 Pending — TMLS
- 2026-04-06 Listed $240,000 TMLS
- 2025-08-29 Listing Removed — TMLS
- 2025-07-25 Pending — TMLS
- 2025-07-21 Listed $350,000 TMLS
- 2025-06-06 Listing Removed — TMLS
- 2025-05-16 Price Changed $319,000 TMLS
- 2025-05-10 Listed $329,000 TMLS
Property tax history
+6.3%/yrLatest (2025): $2,802 · +0.4% YoY. Source: county tax records.
Cash-flow waterfall
monthlySold comps — $/sqft
last 12 mo · ≤1 miLoading sold comps…