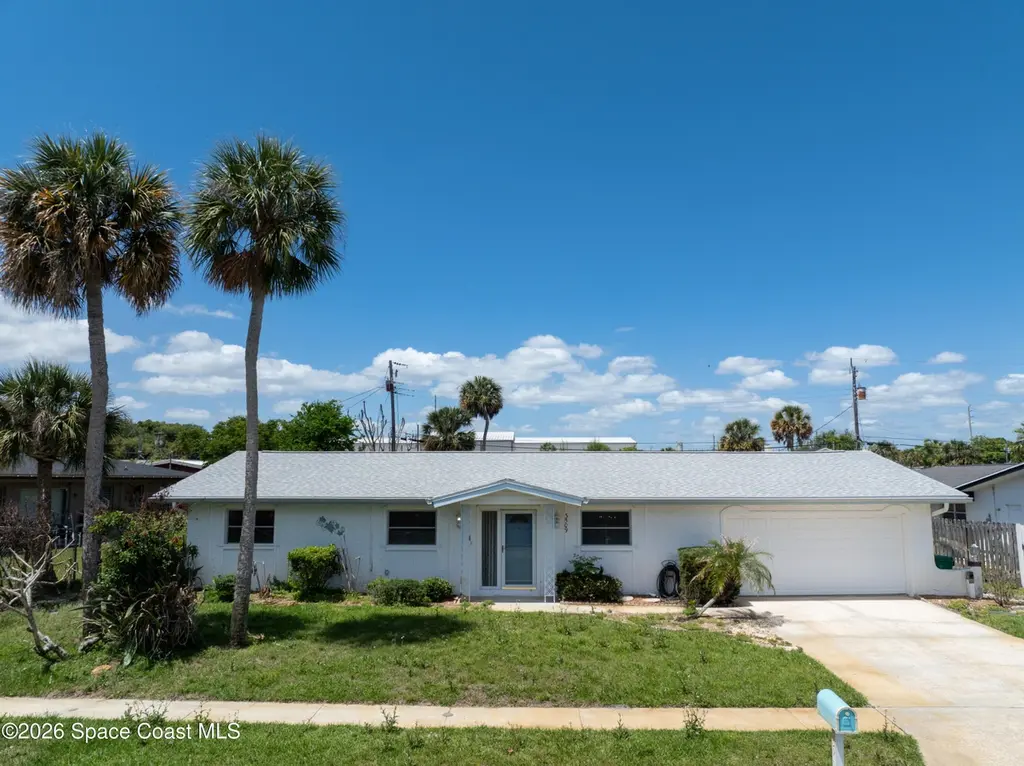
3509 Hilltop Ln · Sharpes, FL
Flood risk 1/10 · Minimal
- FEMA flood zone
- X (unshaded)
- Chance of flooding over 30 yrs
- 0.0%
- Est. flood insurance / yr
- $507 – $1,088
Fire risk 4/10 · Minor
- Est. fire insurance / yr
- $947 – $1,759
Heat risk 10/10 · Severe
- Hot days now (above 106°F)
- 7 days/yr
- Hot days in 30 yrs
- 23 days/yr
Wind risk 10/10 · Severe
- Chance of severe wind over 30 yrs
- 99.0%
Air-quality risk 1/10 · Minimal
- Unhealthy air days now
- 0 days/yr
- Unhealthy air days in 30 yrs
- 0 days/yr
Risk factors via First Street. Map © Google.
Why this score? — see what drove the F grade
The composite is a weighted blend of 9 inputs, each scored 0–100. Each bar is that input's sub-score; the figure is the points it added to the 100-point composite (weight × sub-score).
- Cash flow +7.6/30.0
- ARV discount +7.5/15.0
- Schools +4.7/10.0
- Rent growth +3.9/5.0
- Livability +3.7/5.0
- Condition / age +2.5/5.0
- 1% rule +1.8/10.0
- DSCR +1.7/10.0
- Appreciation +0.0/10.0
$349,900
🖨 Deal sheet (PDF) 📄 Offer letter ✓ Due diligence
Listing remarks
A MUST SEE! Where Space, Comfort, and Opportunity Meet. .. Step into a residence where scale, function, and potential come together seamlessly. This expansive 4BE, 2BA home offering over 2,200 square feet of living space delivers a rare combination of size and versatility in one of Cocoa's established neighborhoods. From the moment you enter, you're welcomed by a generous single-story layout designed for both everyday living and effortless entertaining. The flowing floor plan creates a natural connection between living, dining, and gathering spaces--perfect for hosting or simply enjoying the comfort of home. The heart of the home offers ample space to design your dream kitchen and living ex
Key facts
- Private backyard
- Natural light
- Single story layout
Tags
Property features AI
Exterior
- Parking: Garage; 2-car garage
- Utilities: Public sewer; Cable available; Electricity connected; Water available
- Home design: Single-family residence; Faces west
- Construction: Block and stucco construction; Shingle roof
- Exterior features: Few trees on the lot; No private pool
Interior
- Kitchen: Electric oven; Electric range; Microwave
- Bedrooms: 4 bedrooms (includes rooms labeled Bedroom 2, Bedroom 3, Bedroom 4)
- Flooring: Carpet; Tile
- Bathrooms: 2 full bathrooms
- Heating & cooling: Central heating (electric); Central air conditioning (electric)
- Interior features: Ceiling fans; Open floor plan; 9 total rooms
- Laundry & utility: Unfurnished (no built-in washer/dryer listed)
Neighborhood map
What this means for you Summary
Snapshot
- This is a 3-bed/2.0-bath single-family listed at $350k.
Deal economics
- At list price, monthly cash flow is $-425 ($-5k/yr) — negative.
- To cash-flow at today's rent, offer at most $275k (21.5% below list).
- To meet the 1% rule (rent ≥ 1% of price), the offer needs to be $239k (31.6% below list).
- Recommended offer: $239k (31.6% below list) — sets the bar for 1% rule.
Location & tenants
- Location reads 73/100 on livability (#302 in FL) — a middle-class / working-renter tenant base. Strengths: crime A+, commute A+, cost of living A+; Watch: employment C-, amenities F, health & safety D-.
- Brevard (suburban): math 53% / reading 57% proficiency, ranked #19 of 73 in FL (top 26%) — acceptable for families but not a draw, mixed tenant base, ~2y average lease.
- Zoned schools: Fairglen Elementary School (math 34% / reading 38%, grade F, #1,670 of 2,144 statewide, top 78%, 617 students, 71% FRL); Cocoa High School (math 21% / reading 27%, grade F, #529 of 667 statewide, top 80%, 1,551 students, 73% FRL) — zoned schools average 72% FRL vs 43% district-wide (29 pts higher); higher-poverty schools than district average — tighter screening recommended.
- Zoned-school proficiency averages 30% at this address vs 55% district-wide (-25 pts) — the specific schools serving this property underperform the Brevard average; the district grade overstates school quality for this exact location.
- Market conditions: Rents rising fast (+5.6%/yr); 296 active listings in the ZIP; 3 comparable units currently listed for rent nearby; rentals at typical pace (median 26d on market — plan ~3-4 weeks tenant-placement turnaround); 4,602 units permitted in Brevard County in 2024 (702 in 5+ unit buildings).
- This rent runs 41% of the median local income ($71k/yr) — at the standard rent-burdened threshold; future hikes will face affordability resistance.
Forward outlook
- Local home prices are declining (-3.0%/yr); year-one equity from $2k of loan paydown is wiped out by about $10k of value loss. Plan a longer hold.
- Brevard County population projected at +15% by 2050 — modest demand growth; plan on rents tracking national, not racing it.
Negotiation context
- It's been on market 62 days — a 6% lower offer ($329k) is reasonable based on typical stale-listing flexibility.
Risks & watch-outs
- Climate carrying-cost: severe wind risk, 99% chance of damaging wind over 30y; extreme-heat days projected 7→23/yr by 2055 (HVAC capex compounding) — expect insurance premiums to compound above CPI over the hold.
Questions for the listing agent
- What do current leases actually rent for vs. the listed asking? Can we see a recent rent roll and the last 12 months of T-12 income?
- It's been on market 62 days. Have you received any prior offers? Is the seller open to a 32% concession, seller financing, or rate buy-down credit?
- Built in 1968 — when were the roof, HVAC, electrical panel, plumbing, and water heater last replaced?
- Why hasn't it sold? Are there any deal-killer items the seller is aware of (foundation, flood, title, zoning, code violations)?
- Is there a deadline driving the sale (1031 exchange, divorce, estate, relocation)? That informs how much negotiation room exists.
- Schools are F-rated, which usually means shorter tenancies and higher turnover. Who's the typical renter profile here, and what's been the actual vacancy rate?
- The area grade is low — what's the realistic commute time and amenity access for the typical tenant pool here? Any planned neighborhood developments (good or bad) we should know about?
- What's the average days-on-market for RENTAL listings here right now (not sales)? A rising rental-DOM trend means longer vacancies and softer asking-rent achievability than the comps imply.
- What's the recent tenant-quality profile in this submarket — average credit score on applications, eviction rate, late-payment / NSF rate, and stable-employment percentage? A property-management company in the area should have these aggregated.
- How much new for-sale + rental construction is in the pipeline within 1–3 miles? Heavy new supply typically softens prices + rents 12–24 months out; constrained supply supports both.
Investment metrics
- 1% rule
- 0.68% ✗
- Cap rate
- 4.83%
- Cash-on-cash
- -5.21%
- DSCR
- 0.77
- GRM
- 12.2
CMA / ARV
No comps found within radius.
Projected returns pro-forma
-3.0% appreciation · 5.6% rent growth · sell at horizon
- IRR
- -22.5%
- Equity multiple
- 0.21×
- Total profit
- $-77,396
- Equity at exit
- $52,171
- IRR
- -11.5%
- Equity multiple
- 0.24×
- Total profit
- $-74,581
- Equity at exit
- $30,253
Cash invested: $97,972 (down + closing). Projections, not guarantees.
Landlord ↔ Tenant lean methodology
- Overall (STATE)
- 87 Strongly Landlord-Friendly
- State Florida
- 87 Strongly Landlord-Friendly · R+3
- County
- — inherits STATE
- City
- — inherits STATE
ZIP-level market 32926
- Home prices YoY
- -16.9%
- Rents YoY
- 5.6%
- Active inventory
- 296
- Price-to-rent
- 12.2×
Monthly cashflow live
- Estimated rent
- $2,394 medium interval (Pro) →
- Mortgage (P&I)
- −$1,835
- Tax from tax record
- −$336 /mo · $4,032/yr
- Insurance
- −$146
- HOA
- −$0
- Lot rent
- −$0
- Vacancy / Maint / Mgmt
- −$503
- Net cashflow
- $-425
Break-even live
Sensitivity live
| Price | -10% $-227 | -5% $-326 | +0% $-425 | +5% $-524 | +10% $-624 |
|---|---|---|---|---|---|
| Rent | -10% $-615 | -5% $-520 | +0% $-425 | +5% $-331 | +10% $-236 |
| Rate | -1.0pp $-249 | -0.5pp $-336 | base $-425 | +0.5pp $-516 | +1.0pp $-608 |
UW: 25.0% down · 7.5% · 30yr · 1.5% tax · 5.0% vac · 8.0% maint · 8.0% mgmt
Financing live
Cash to close
- Down payment
- $87,475
- Closing costs
- $10,497
- Reserves months
- —
- Total cash needed
- —
Loan-product check · same deal, 3 products live
Conventional
25% down · 7.5% · 30yr
- Down + closing
- —
- Monthly P&I
- —
- Monthly cashflow
- —
- DSCR
- —
- Eligible?
- —
Personal DTI + credit; lowest rate.
DSCR
20% down · 8.5% · 30yr
- Down + closing
- —
- Monthly P&I
- —
- Monthly cashflow
- —
- DSCR
- —
- Eligible?
- —
No personal income docs; deal must DSCR.
Hard money
10% down · 12.0% · 12mo
- Down + closing
- —
- Monthly P&I
- —
- Monthly cashflow
- —
- DSCR
- —
- Eligible?
- —
Short-term bridge; refi at stabilization.
Rent comps 3 comps
| Address | Beds | Baths | Sqft | Rent | $/sqft | DOM | Units | Dist |
|---|---|---|---|---|---|---|---|---|
| 3435 Indian River Dr Cocoa, FL | 4.0 | 2.5 | 3000 | $8,250 | $2.75 | 26d | 1 | 0.48mi |
| 2811 N Indian River Dr Cocoa, FL | 3.0 | 1.5 | 1800 | $2,600 | $1.44 | 26d | 1 | 1.04mi |
| 3070 Cirrus Dr Cocoa, FL | 3.0 | 1.0–2.0 | 1002 | $2,661 | $2.66 | 16d | 29 | 1.10mi |
Listing history 17 events
-
2026-06-23days on market $349,900 Active 62 DOM
-
2026-06-22days on market $349,900 Active 61 DOM
-
2026-06-18days on market $349,900 Active 58 DOM
-
2026-06-17days on market $349,900 Active 57 DOM
-
2026-06-16days on market $349,900 Active 56 DOM
-
2026-06-15days on market $349,900 Active 55 DOM
-
2026-06-14days on market $349,900 Active 53 DOM
-
2026-06-10days on market $349,900 Active 50 DOM
-
2026-06-08days on market $349,900 Active 48 DOM
-
2026-06-07days on market $349,900 Active 47 DOM
-
2026-06-05days on market $349,900 Active 44 DOM
-
2026-06-03days on market $349,900 Active 43 DOM
-
2026-06-02days on market $349,900 Active 42 DOM
-
2026-06-01days on market $349,900 Active 41 DOM
-
2026-05-31days on market $349,900 Active 40 DOM
-
2026-05-31days on market $349,900 Active 39 DOM
-
2026-04-21$364,900 Active
ⓘ Source: listings_history table (triggers on properties + properties_extension) + one-shot
backfill from property_details.listing_events for pre-trigger history.
Tax reassessment forecast FL · Resets to sale price
- Current annual tax
- $4,032 · $336/mo
- Projected year-2 tax
- $4,032 · $336/mo
- Expected delta
- $0/yr ($0/mo · 0.0%)
ⓘ Screening estimate from a state-policy table — verify with the county assessor before closing.
Climate risk First Street
- Flood 1/10 Low FEMA zone X (unshaded) · 0% chance over 30 yrs
- Wildfire 4/10 Moderate
- Heat 10/10 Extreme 7 d/yr ≥106°F today · 23 d/yr by 30 yrs out
- Wind 10/10 Extreme 99% chance of damaging wind over 30 yrs
- Air quality 1/10 Low 0 unhealthy d/yr today · 0 by 30 yrs out
Nearby sold comps map
Loading sold comps map…
Walkable amenities ~0.75 mi
Loading nearby amenities…
Taxation est. · year 1
- Rental income
- $28,728
- − Mortgage interest
- −$19,600
- − Property taxes
- −$4,032
- − Insurance
- −$1,750
- − Repairs & maintenance
- −$2,298
- − Management
- −$2,298
- − Depreciation
- −$10,179
- Taxable loss
- −$11,429
- Est. tax savings @ 24.0%
- +$2,743
- After-tax cash flow
- $-2,362/yr
For passive investors: Depreciation is non-cash, so a rental often shows a tax loss while cash-flowing — sheltering income. Rental losses are passive: they offset passive income freely, and up to $25,000/yr can offset ordinary (W-2) income if you actively participate and your MAGI is under $100k (phasing out to $0 by $150k); unused losses carry forward. On sale, claimed depreciation is recaptured at up to 25%, and gains may owe capital-gains tax (a 1031 exchange can defer both). Figures are a year-1 estimate at your 24.0% rate — not tax advice; consult a CPA.
Schools (NCES district)
- District
- Brevard
- NCES district ID
- 1200150
- Math proficiency
- 53% ▼ -9.00%
- Reading proficiency
- 57% ▼ -4.00%
- Median HH income
- $49,426
- Composite
- 46.86/100
- National rank
- #2370
- State rank
- #19 of 73 in FL
Livability — Sharpes
- Score
- 73/100
- State rank
- #302
- US rank
- #5144
Category grades
Schools grade is shown separately in the Schools card above.
Census & demographics
- Census place
- Sharpes, FL
- County
- Brevard County · 602,871 people
- City population
- 11
- Metro
- Palm Bay-Melbourne-Titusville, FL
- Population (ZIP)
- 23,505
- Household income
- $70,735
- Rent vs Own
- Severe rent burden
- 782.0
Population outlook (Brevard County) Hauer SSP2
- Today (2025)
- 623,254 people
- By 2030
- 648,420 · +4.0%
- By 2040
- 690,009 · +10.7%
- By 2050
- 715,669 · +14.8%
- By 2075
- 775,744 · +24.5%
- By 2100
- 776,687 · +24.6%
Race, ethnicity, and origin ACS 2023
- Neighborhood character
- Predominantly White (72%)
- Race & ethnicity
- White 72% Black 11% Hispanic / Latino 10% Two or more races 9% Asian 2%
- Hispanic origin (detail)
- Mexican 5% Puerto Rican 2%
- Common ancestry
- Romanian 2% Lithuanian 2% Italian 2%
- Foreign-born
- 5% · Canada, Vietnam, Jamaica
- Languages at home
- 91% English-only · Spanish 6% Vietnamese 1% German/W. Germanic 1%
Political lean MEDSL · Brevard
- 2024 margin
- Strong R (+20.8) · D 39.1% · R 59.9% · Other 1.0%
- 2008→2024 swing
- -10.4pp toward R · 2008: -10.4pp · 2024: -20.8pp
- All cycles
- 2024: R+20.8 2020: R+16.4 2016: R+19.8 2012: R+12.7 2008: R+10.4
Not yet ingested
- Civics
- —
Market trends
- HPI YoY
- ▼ -68.32%
- Current HPI
- 335.1251
- Rent YoY
- ▲ 5.60%
- Metro
- Palm Bay-Melbourne-Titusville, FL
- State GDP YoY
- ▲ 3.28%
- F500 in state
- 36
Industry mix (Fortune 500 HQ in FL)
| Industry | F500 HQs | Revenue |
|---|---|---|
| Industrial Technology | 2 | $29B |
|
||
| Insurance | 2 | $17B |
|
||
| Retail | 1 | $60B |
|
||
| Technology Distribution | 1 | $58B |
|
||
| Homebuilding | 1 | $35B |
|
||
| Technology Manufacturing | 1 | $35B |
|
||
Price history
1 event — show timeline
- 2026-04-21 Listed $364,900 SCMLS
Property tax history
+11.5%/yrLatest (2025): $4,032 · +7.2% YoY. Source: county tax records.
Cash-flow waterfall
monthlySold comps — $/sqft
last 12 mo · ≤1 miLoading sold comps…