 🏢 Co-op
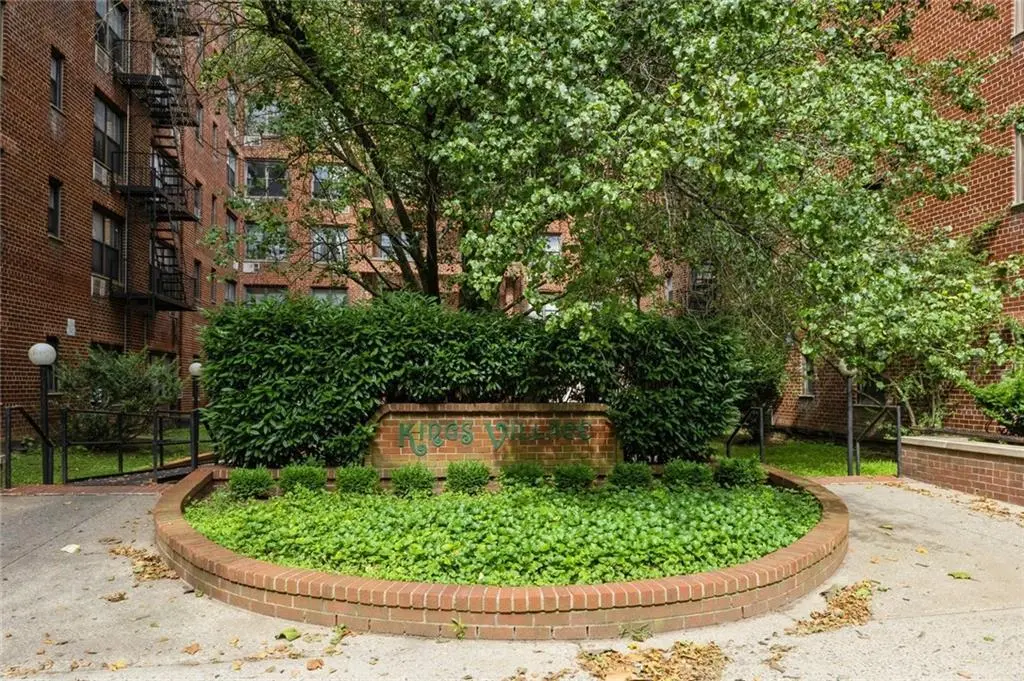
1275 E 51 St Unit 3H · New York, NY
Flood risk 1/10 · Minimal
- FEMA flood zone
- X (unshaded)
- Chance of flooding over 30 yrs
- 0.0%
- Est. flood insurance / yr
- $507 – $1,088
Fire risk 1/10 · Minimal
- Est. fire insurance / yr
- $691 – $1,283
Heat risk 7/10 · Major
- Hot days now (above 97°F)
- 7 days/yr
- Hot days in 30 yrs
- 16 days/yr
Wind risk 6/10 · Moderate
- Chance of severe wind over 30 yrs
- 64.0%
Air-quality risk 5/10 · Moderate
- Unhealthy air days now
- 6 days/yr
- Unhealthy air days in 30 yrs
- 8 days/yr
Risk factors via First Street. Map © Google.
Why this score? — see what drove the D grade
The composite is a weighted blend of 9 inputs, each scored 0–100. Each bar is that input's sub-score; the figure is the points it added to the 100-point composite (weight × sub-score).
- 1% rule +10.0/10.0
- ARV discount +7.5/15.0
- Cash flow +6.7/30.0
- Rent growth +5.0/5.0
- Schools +5.0/10.0
- Livability +3.8/5.0
- Condition / age +2.5/5.0
- DSCR +1.0/10.0
- Appreciation +0.0/10.0
$159,900
🖨 Deal sheet 📄 Offer letter ✓ Due diligence
Listing remarks
Renovated one bedroom unit available for sale in Kings Village. This Fannie Mae unit features 750 square feet of living space, lots of closets, a living room, one large bedroom with window, kitchen and new appliances. The many upgrades include fresh paint, fixtures, plumbing, electrical, and new carpet. Located close proximity to shopping, transportation, and schools. Monthly maintenance $822.68 plus $210.95 assessment fee ending 12/2026. Buyer pays flip and transfer tax fees - 20 percent down payment, board approval. Don't miss this opportunity.
Key facts
- Fresh paint
- Lots of closets
- New appliances
Tags
Property features AI
Finance
- Other: Assessment fee currently $210.95 (through Dec 26, 2026)
- Financial info: Flip tax of 8%; Financing accepted: Bank mortgage or cash; Down payment requirement: 20%; Sub-lease allowed
- HOA & community: Monthly maintenance fee of $822.68 (fee includes assessment); Management by AKAM Associates, Inc; Manager phone available; Pets are not allowed (see agent for restrictions); Co-op shares associated with unit
Exterior
- Parking: No dedicated parking (wait-list for parking)
- Utilities: Gas service; Gas hot water; Gas heating fuel; Sewer; Water
- Home design: Residential unit in a semi-detached building; Third floor unit
- Construction: Building has 779 total units
- Exterior features: Located on the 3rd floor of the building
Interior
- Kitchen: Stove; Refrigerator; Dishwasher
- Bedrooms: 1 bedroom on the first floor
- Bathrooms: 1 full bathroom on the first floor
- Heating & cooling: No central AC units reported; Hot water heat delivery
- Interior features: Dishwasher; Elevator; Refrigerator; Stove
- Laundry & utility: Card-operated laundry in the building
Neighborhood map
What this means for you Summary
Snapshot
- This is a 1-bed/1.0-bath condo listed at $160k.
Deal economics
- At list price, monthly cash flow is $-253 ($-3k/yr) — negative.
- The deal already cash-flows at list — no discount required.
- Meets the 1% rule at list price ($2k rent vs $160k).
- Recommended offer: $158k (1.5% below list) — sets the bar for market timing.
- Cap rate 4.4% vs local median 2.6% in New York — top-decile yield for the area; either an underpriced asset or a hidden risk that comps aren't pricing in. Stress-test before assuming the spread holds.
Location & tenants
- Location reads 75/100 on livability (#268 in NY, #4,188 nationally) — a middle-class / working-renter tenant base. Strengths: amenities A+, commute A+, health & safety A; Watch: crime F, cost of living F.
- Market conditions: Rents rising fast (+16.2%/yr); 459 active listings in the ZIP; solid renter incomes; 10,063 units permitted in Kings County in 2024 (9,789 in 5+ unit buildings).
- This rent runs 30% of the median local income ($97k/yr) — at the standard rent-burdened threshold; future hikes will face affordability resistance.
Forward outlook
- Local home prices are declining (-3.0%/yr); year-one equity from $1k of loan paydown is wiped out by about $5k of value loss. Plan a longer hold.
- Kings County population projected at +13% by 2050 — modest demand growth; plan on rents tracking national, not racing it.
Negotiation context
- It's been on market 20 days — a 2% lower offer ($158k) is reasonable based on typical stale-listing flexibility.
Risks & watch-outs
- Watch-outs: HOA is 44% of rent.
- Climate carrying-cost: major wind risk, 64% chance of damaging wind over 30y; extreme-heat days projected 7→16/yr by 2055 (HVAC capex compounding) — expect insurance premiums to compound above CPI over the hold.
Questions for the listing agent
- What do current leases actually rent for vs. the listed asking? Can we see a recent rent roll and the last 12 months of T-12 income?
- Built in 1966 — when were the roof, HVAC, electrical panel, plumbing, and water heater last replaced?
- What does the HOA fee cover, when was the last increase, and are there any pending special assessments or reserve-fund shortfalls?
- Any open or pending special assessments — roof, HVAC, plumbing, elevator, façade? What's the per-unit balance and payoff schedule, and is the seller paying it off at close or rolling it to the buyer?
- Is there a deadline driving the sale (1031 exchange, divorce, estate, relocation)? That informs how much negotiation room exists.
- Schools are B-rated — typically a magnet for longer-tenancy family renters. What's the average tenant stay here, and is there a school-zone premium baked into asking?
- Crime grade is F in this area — have there been break-ins, vandalism, or insurance claims at this property in the last 3 years? What carrier currently insures it and at what premium?
- The area grade is low — what's the realistic commute time and amenity access for the typical tenant pool here? Any planned neighborhood developments (good or bad) we should know about?
- What's the average days-on-market for RENTAL listings here right now (not sales)? A rising rental-DOM trend means longer vacancies and softer asking-rent achievability than the comps imply.
- What's the recent tenant-quality profile in this submarket — average credit score on applications, eviction rate, late-payment / NSF rate, and stable-employment percentage? A property-management company in the area should have these aggregated.
- How much new apartment / multifamily construction is in the pipeline within 1–3 miles? Heavy new supply (>2% of stock underway) typically softens rents 12–24 months out; light construction supports rent growth.
Investment metrics
- 1% rule
- 1.53% ✓
- Cap rate
- 4.39%
- Cash-on-cash
- -6.79%
- DSCR
- 0.70
- GRM
- 5.5
CMA / ARV
No comps found within radius.
Projected returns pro-forma
-3.0% appreciation · 8.0% rent growth · sell at horizon
- IRR
- -16.4%
- Equity multiple
- 0.36×
- Total profit
- $-28,434
- Equity at exit
- $23,842
- IRR
- 3.5%
- Equity multiple
- 1.36×
- Total profit
- $16,042
- Equity at exit
- $13,825
Cash invested: $44,772 (down + closing). Projections, not guarantees.
Landlord ↔ Tenant lean methodology
- Overall (CITY)
- 0 Strongly Tenant-Friendly
- State New York
- 15 Strongly Tenant-Friendly · D+10
- County
- — inherits STATE
- City New York
- 0 Strongly Tenant-Friendly · D+34
ZIP-level market 11234
- Rents YoY
- 16.2%
- Active inventory
- 459
- Price-to-rent
- 5.5×
Monthly cashflow live
- Estimated rent
- $2,442 medium interval (Pro) →
- Mortgage (P&I)
- −$839
- Tax est. 1.5%
- −$200 /mo · $2,398/yr
- Insurance
- −$67
- HOA est. from 1 same-building comp
- −$1,077
- Vacancy / Maint / Mgmt
- −$513
- Net cashflow
- $-253
Break-even live
UW: 25.0% down · 7.5% · 30yr · 1.5% tax · 5.0% vac · 8.0% maint · 8.0% mgmt
Financing live
Cash to close
- Down payment
- $39,975
- Closing costs
- $4,797
- Reserves months
- —
- Total cash needed
- —
Loan-product check · same deal, 3 products live
Conventional
25% down · 7.5% · 30yr
- Down + closing
- —
- Monthly P&I
- —
- Monthly cashflow
- —
- DSCR
- —
- Eligible?
- —
Personal DTI + credit; lowest rate.
DSCR
20% down · 8.5% · 30yr
- Down + closing
- —
- Monthly P&I
- —
- Monthly cashflow
- —
- DSCR
- —
- Eligible?
- —
No personal income docs; deal must DSCR.
Hard money
10% down · 12.0% · 12mo
- Down + closing
- —
- Monthly P&I
- —
- Monthly cashflow
- —
- DSCR
- —
- Eligible?
- —
Short-term bridge; refi at stabilization.
HOA detail condo
- Monthly dues
- $0 · $0/yr
- Likely covers
- electric
- Assessments
- None detected in remarks — confirm with the listing agent.
Listing history 21 events
-
2026-06-18days on market $159,900 Active 20 DOM
-
2026-06-17days on market $159,900 Active 19 DOM
-
2026-06-16days on market $159,900 Active 18 DOM
-
2026-06-15days on market $159,900 Active 17 DOM
-
2026-06-13days on market $159,900 Active 15 DOM
-
2026-06-09days on market $159,900 Active 11 DOM
-
2026-06-08days on market $159,900 Active 10 DOM
-
2026-06-08days on market $159,900 Active 9 DOM
-
2026-06-04days on market $159,900 Active 6 DOM
-
2026-06-03days on market $159,900 Active 5 DOM
-
2026-06-02days on market $159,900 Active 4 DOM
-
2026-06-01days on market $159,900 Active 3 DOM
-
2026-05-31days on market $159,900 Active 2 DOM
-
2026-04-13price $170,000
-
2026-03-06price $175,000
-
2026-02-24$180,000 Active
-
2026-01-07price $180,000
-
2025-12-10price $190,000
-
2025-10-31price $200,000
-
2025-10-15price $209,900
-
2025-09-12price $219,900
ⓘ Source: listings_history table (triggers on properties + properties_extension) + one-shot
backfill from property_details.listing_events for pre-trigger history.
Climate risk First Street
- Flood 1/10 Low FEMA zone X (unshaded) · 0% chance over 30 yrs
- Wildfire 1/10 Low
- Heat 7/10 Severe 7 d/yr ≥97°F today · 16 d/yr by 30 yrs out
- Wind 6/10 Major 64% chance of damaging wind over 30 yrs
- Air quality 5/10 Major 6 unhealthy d/yr today · 8 by 30 yrs out
Nearby sold comps map
Loading sold comps map…
Walkable amenities ~0.75 mi
Loading nearby amenities…
Taxation est. · year 1
- Rental income
- $29,299
- − Mortgage interest
- −$8,957
- − Property taxes
- −$2,398
- − Insurance
- −$800
- − Repairs & maintenance
- −$2,344
- − Management
- −$2,344
- − HOA
- −$12,924
- − Depreciation
- −$4,652
- Taxable loss
- −$5,119
- Est. tax savings @ 24.0%
- +$1,229
- After-tax cash flow
- $-1,810/yr
For passive investors: Depreciation is non-cash, so a rental often shows a tax loss while cash-flowing — sheltering income. Rental losses are passive: they offset passive income freely, and up to $25,000/yr can offset ordinary (W-2) income if you actively participate and your MAGI is under $100k (phasing out to $0 by $150k); unused losses carry forward. On sale, claimed depreciation is recaptured at up to 25%, and gains may owe capital-gains tax (a 1031 exchange can defer both). Figures are a year-1 estimate at your 24.0% rate — not tax advice; consult a CPA.
Schools (NCES district)
No district data.
Livability — New York
- Score
- 75/100
- State rank
- #268
- US rank
- #4188
Category grades
Schools grade is shown separately in the Schools card above.
Census & demographics
- Census place
- New York, NY
- County
- Kings County · 2,614,986 people
- City population
- 7,731,280
- Metro
- New York-Newark-Jersey City, NY-NJ-PA
- Population (ZIP)
- 83,187
- Household income
- $97,479
- Rent vs Own
- Severe rent burden
- 2384.0
Population outlook (Kings County) Hauer SSP2
- Today (2025)
- 2,847,441 people
- By 2030
- 2,937,006 · +3.1%
- By 2040
- 3,095,491 · +8.7%
- By 2050
- 3,228,968 · +13.4%
- By 2075
- 3,321,723 · +16.7%
- By 2100
- 3,111,387 · +9.3%
Race, ethnicity, and origin ACS 2023
- Neighborhood character
- Diverse neighborhood (Simpson 0.69)
- Race & ethnicity
- Black 42% White 35% Hispanic / Latino 10% Asian 8% Two or more races 7%
- Hispanic origin (detail)
- Mexican 1% Puerto Rican 4%
- Common ancestry
- Hispanic 8% Scotch-Irish 3% Romanian 2%
- Foreign-born
- 35% · Canada, China, Mexico
- Languages at home
- 65% English-only · French/Haitian/Cajun 9% Spanish 7% Russian/Polish/Slavic 6%
Political lean MEDSL · Kings
- 2024 margin
- Solid D (+44.0) · D 72.0% · R 28.0%
- 2008→2024 swing
- -15.5pp toward R · 2008: 59.4pp · 2024: 44.0pp
- All cycles
- 2024: D+44.0 2020: D+54.8 2016: D+61.8 2012: D+63.9 2008: D+59.4
Not yet ingested
- Civics
- —
Market trends
- HPI YoY
- ▼ -667.47%
- Current HPI
- 318.0416
- Rent YoY
- ▲ 16.21%
- Metro
- New York-Newark-Jersey City, NY-NJ-PA
- State GDP YoY
- ▲ 2.60%
- F500 in state
- 92
Industry mix (Fortune 500 HQ in NY)
| Industry | F500 HQs | Revenue |
|---|---|---|
| Financial Services | 10 | $950B |
|
||
| Consumer Goods | 9 | $162B |
|
||
| Insurance | 4 | $225B |
|
||
| Telecommunications | 2 | $144B |
|
||
| Pharmaceuticals | 2 | $112B |
|
||
| Media / Entertainment | 2 | $69B |
|
||
Price history
-22.7% since first listed8 events — show timeline
- 2026-04-13 Price Changed $170,000 BNYMLS
- 2026-03-06 Price Changed $175,000 BNYMLS
- 2026-02-24 Listed $180,000 BNYMLS
- 2026-01-07 Price Changed $180,000 BNYMLS
- 2025-12-10 Price Changed $190,000 BNYMLS
- 2025-10-31 Price Changed $200,000 BNYMLS
- 2025-10-15 Price Changed $209,900 BNYMLS
- 2025-09-12 Price Changed $219,900 BNYMLS
Cash-flow waterfall
monthlySold comps — $/sqft
last 12 mo · ≤1 miLoading sold comps…