777 Truesdale Hill Rd · Warrensburg, NY
Flood risk 5/10 · Moderate
- FEMA flood zone
- X
- Chance of flooding over 30 yrs
- 0.47%
- Est. flood insurance / yr
- $473 – $860
Fire risk 4/10 · Minor
- Est. fire insurance / yr
- $691 – $1,283
Heat risk 2/10 · Minimal
- Hot days now (above 91°F)
- 7 days/yr
- Hot days in 30 yrs
- 16 days/yr
Wind risk 2/10 · Minimal
- Chance of severe wind over 30 yrs
- 1.0%
Air-quality risk 1/10 · Minimal
- Unhealthy air days now
- 0 days/yr
- Unhealthy air days in 30 yrs
- 0 days/yr
Risk factors via First Street. Map © Google.
Why this score? — see what drove the C+ grade
The composite is a weighted blend of 9 inputs, each scored 0–100. Each bar is that input's sub-score; the figure is the points it added to the 100-point composite (weight × sub-score).
- Cash flow +21.2/30.0
- Appreciation +10.0/10.0
- ARV discount +8.4/15.0
- DSCR +6.8/10.0
- 1% rule +5.6/10.0
- Schools +4.1/10.0
- Livability +3.2/5.0
- Rent growth +2.5/5.0
- Condition / age +2.5/5.0
$315,000
🖨 Deal sheet (PDF) 📄 Offer letter ✓ Due diligence
Listing remarks
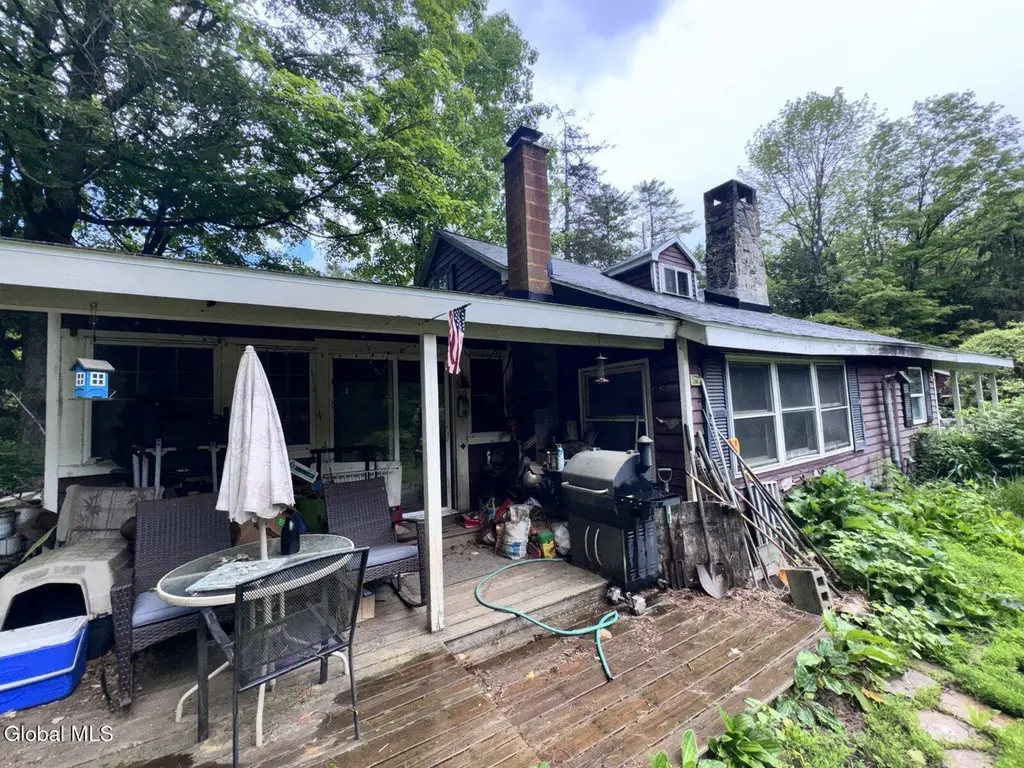
ATTENTION INVESTORS: Unlock the potential of this rehab-ready property in the heart of the Adirondacks. Situated on just under 4 private acres, this 3-bedroom, 1.5-bath home offers a fantastic opportunity for investors, flippers, or buyers looking to create their own Adirondack retreat. Key features include a detached 2-car garage and a roof that is only 2 years old, providing a solid starting point for renovations. Enjoy private access to Diamond Point Beach on Lake George, located just minutes from the property. Conveniently located only minutes from Exit 23 off the Northway, you'll be approximately 10 minutes from Lake George and 20 minutes from Schroon Lake, offering easy access to boa
Key facts
- Private acres
- Roof 2 years old
- Rehab ready property
Tags
Property features AI
Finance
- Other: Lot of approximately 3.72 acres
Exterior
- Parking: 2 garage spaces
- Utilities: Septic tank for sewer
- Home design: Single family residence; Facing/entry level information not provided
- Construction: Wood siding construction
- Exterior features: Shingle roof; Other exterior features
Interior
- Kitchen: Oven; Range
- Bedrooms: One bedroom on the first floor; Two bedrooms on the second floor
- Bathrooms: One full bathroom (located on the second floor); One half bathroom (located on the first floor)
- Heating & cooling: Wood heating with a wood stove; Has cooling (other type)
- Interior features: 7 total rooms; Partial unfinished basement; Fireplace (1)
- Laundry & utility: Dedicated laundry room
Neighborhood map
What this means for you Summary
Snapshot
- This is a 3-bed/1.5-bath single-family listed at $315k.
Deal economics
- At list price, monthly cash flow is $458 ($5k/yr) — positive.
- The deal already cash-flows at list — no discount required.
- Meets the 1% rule at list price ($3k rent vs $315k).
- Recommended offer: $310k (1.5% below list) — sets the bar for market timing.
- Cap rate 8.0% vs local median 2.9% in Warrensburg — top-decile yield for the area; either an underpriced asset or a hidden risk that comps aren't pricing in. Stress-test before assuming the spread holds.
Location & tenants
- Location reads 63/100 on livability (#823 in NY) — a middle-class / working-renter tenant base. Strengths: housing A+, cost of living B+, crime B; Watch: amenities F, commute F, health & safety D-.
- Warrensburg Central School District (town): math 47% / reading 44% proficiency, ranked #552 of 755 in NY (top 73%) — families likely to look elsewhere, expect single-tenant / working-renter base with shorter leases.
- Zoned schools: Warrensburg Elementary School (math 37% / reading 52%, grade F, #1,277 of 2,108 statewide, top 64%, 361 students, 58% FRL); Warrensburg Junior-Senior High School (math 62% / reading 57%, grade C+, #851 of 1,100 statewide, top 80%, 302 students, 64% FRL) — zoned schools average 61% FRL vs 39% district-wide (21 pts higher); higher-poverty schools than district average — tighter screening recommended.
- Market conditions: 112 active listings in the ZIP; 180 units permitted in Warren County in 2024 (40 in 5+ unit buildings).
Forward outlook
- In year one you build about $34k of equity ($2k loan paydown + $32k appreciation (10.0% local appreciation)).
- Warren County population projected at -19% by 2050 — secular population decline; favor cash flow + early exit over multi-decade hold.
- At projected returns (10.0% appreciation + 3.0% rent growth), your $88k cash investment doubles in ~3 years — after that, you're playing with house money.
- By year 2, paydown + projected appreciation supports a ~$54k cash-out refi (75% LTV) — recoverable capital for the next deal without selling this one.
Negotiation context
- It's been on market 20 days — a 2% lower offer ($310k) is reasonable based on typical stale-listing flexibility.
- 2 sale attempts since 16y ago with the ask held roughly flat each time — persistent listings suggest the price (not the market) is what's stuck; bring a comps-based counter.
- Current owner paid $206k; list at $315k implies a 53% gain — meaningful room to come down on a strong offer.
Risks & watch-outs
- Climate carrying-cost: moderate flood risk — expect insurance premiums to compound above CPI over the hold.
Questions for the listing agent
- Is there a deadline driving the sale (1031 exchange, divorce, estate, relocation)? That informs how much negotiation room exists.
- Schools are D-rated, which usually means shorter tenancies and higher turnover. Who's the typical renter profile here, and what's been the actual vacancy rate?
- What's the average days-on-market for RENTAL listings here right now (not sales)? A rising rental-DOM trend means longer vacancies and softer asking-rent achievability than the comps imply.
- What's the recent tenant-quality profile in this submarket — average credit score on applications, eviction rate, late-payment / NSF rate, and stable-employment percentage? A property-management company in the area should have these aggregated.
- How much new for-sale + rental construction is in the pipeline within 1–3 miles? Heavy new supply typically softens prices + rents 12–24 months out; constrained supply supports both.
Investment metrics
- 1% rule
- 1.06% ✓
- Cap rate
- 8.04%
- Cash-on-cash
- 6.23%
- DSCR
- 1.28
- GRM
- 7.8
CMA / ARV
- ARV (on-the-fly)
- $321,745
- Comps found
- 1
Show comp detail 1 sale within ~0.75 mi
| Address | Dist | Beds/Ba | Sqft | Sold | Price | $/sf | Match |
|---|---|---|---|---|---|---|---|
| 2216 Harrington Hill Rd | 0.63mi | 3/1.0 | 1,308 (-7%) | 20mo | $299,900 | $229 | 41 |
Match score weights: distance 35% · size 25% · config 20% · recency 20%. Top-matched comps best support the ARV.
Projected returns pro-forma
10.0% appreciation · 3.0% rent growth · sell at horizon
- IRR
- 28.8%
- Equity multiple
- 3.28×
- Total profit
- $200,783
- Equity at exit
- $283,777
- IRR
- 25.1%
- Equity multiple
- 7.45×
- Total profit
- $568,449
- Equity at exit
- $611,976
Cash invested: $88,200 (down + closing). Projections, not guarantees.
Landlord ↔ Tenant lean methodology
- Overall (STATE)
- 15 Strongly Tenant-Friendly
- State New York
- 15 Strongly Tenant-Friendly · D+10
- County
- — inherits STATE
- City
- — inherits STATE
ZIP-level market 12845
- Home prices YoY
- 3.5%
- Active inventory
- 112
- Price-to-rent
- 7.8×
Monthly cashflow live
- Estimated rent
- $3,350 medium interval (Pro) →
- Mortgage (P&I)
- −$1,652
- Tax from tax record
- −$405 /mo · $4,863/yr
- Insurance
- −$131
- HOA
- −$0
- Vacancy / Maint / Mgmt
- −$703
- Net cashflow
- $458
Break-even live
Sensitivity live
| Price | -10% $636 | -5% $547 | +0% $458 | +5% $369 | +10% $280 |
|---|---|---|---|---|---|
| Rent | -10% $193 | -5% $326 | +0% $458 | +5% $590 | +10% $723 |
| Rate | -1.0pp $617 | -0.5pp $538 | base $458 | +0.5pp $376 | +1.0pp $293 |
UW: 25.0% down · 7.5% · 30yr · 1.5% tax · 5.0% vac · 8.0% maint · 8.0% mgmt
Financing live
Cash to close
- Down payment
- $78,750
- Closing costs
- $9,450
- Reserves months
- —
- Total cash needed
- —
Loan-product check · same deal, 3 products live
Conventional
25% down · 7.5% · 30yr
- Down + closing
- —
- Monthly P&I
- —
- Monthly cashflow
- —
- DSCR
- —
- Eligible?
- —
Personal DTI + credit; lowest rate.
DSCR
20% down · 8.5% · 30yr
- Down + closing
- —
- Monthly P&I
- —
- Monthly cashflow
- —
- DSCR
- —
- Eligible?
- —
No personal income docs; deal must DSCR.
Hard money
10% down · 12.0% · 12mo
- Down + closing
- —
- Monthly P&I
- —
- Monthly cashflow
- —
- DSCR
- —
- Eligible?
- —
Short-term bridge; refi at stabilization.
Listing history 16 events
-
2026-06-21days on market $315,000 Active 20 DOM
-
2026-06-21days on market $315,000 Active 19 DOM
-
2026-06-18days on market $315,000 Active 17 DOM
-
2026-06-17days on market $315,000 Active 16 DOM
-
2026-06-17price $315,000 Active 15 DOM
-
2026-06-16days on market $320,000 Active 15 DOM
-
2026-06-15days on market $320,000 Active 14 DOM
-
2026-06-13days on market $320,000 Active 12 DOM
-
2026-06-12pricedays on market $320,000 Active 11 DOM
-
2026-06-09days on market $325,000 Active 8 DOM
-
2026-06-08days on market $325,000 Active 7 DOM
-
2026-06-07days on market $325,000 Active 6 DOM
-
2026-06-07days on market $325,000 Active 5 DOM
-
2026-06-04days on market $325,000 Active 2 DOM
-
2026-06-01remarks 699-char remark
-
2026-06-01$325,000 Active 1 DOM
ⓘ Source: listings_history table (triggers on properties + properties_extension) + one-shot
backfill from property_details.listing_events for pre-trigger history.
Tax reassessment forecast NY · Partial reset (capped growth)
- Current annual tax
- $4,863 · $405/mo
- Projected year-2 tax
- $5,093 · $424/mo
- Expected delta
- +$230/yr (+$19/mo · 4.7%)
ⓘ Screening estimate from a state-policy table — verify with the county assessor before closing.
Climate risk First Street
- Flood 5/10 Major FEMA zone X · 47% chance over 30 yrs
- Wildfire 4/10 Moderate
- Heat 2/10 Low 7 d/yr ≥91°F today · 16 d/yr by 30 yrs out
- Wind 2/10 Low 100% chance of damaging wind over 30 yrs
- Air quality 1/10 Low 0 unhealthy d/yr today · 0 by 30 yrs out
Nearby sold comps map
Loading sold comps map…
Walkable amenities ~0.75 mi
Loading nearby amenities…
Taxation est. · year 1
- Rental income
- $40,198
- − Mortgage interest
- −$17,645
- − Property taxes
- −$4,863
- − Insurance
- −$1,575
- − Repairs & maintenance
- −$3,216
- − Management
- −$3,216
- − Depreciation
- −$9,164
- Taxable income
- $520
- Est. tax owed @ 24.0%
- −$125
- After-tax cash flow
- $5,371/yr
For passive investors: Depreciation is non-cash, so a rental often shows a tax loss while cash-flowing — sheltering income. Rental losses are passive: they offset passive income freely, and up to $25,000/yr can offset ordinary (W-2) income if you actively participate and your MAGI is under $100k (phasing out to $0 by $150k); unused losses carry forward. On sale, claimed depreciation is recaptured at up to 25%, and gains may owe capital-gains tax (a 1031 exchange can defer both). Figures are a year-1 estimate at your 24.0% rate — not tax advice; consult a CPA.
Schools (NCES district)
- District
- Warrensburg Central School District
- NCES district ID
- 3629910
- Math proficiency
- 47% ▲ 4.00%
- Reading proficiency
- 44% ▼ -2.00%
- Median HH income
- $48,828
- Composite
- 41.15/100
- National rank
- #7424
- State rank
- #552 of 755 in NY
Livability — Warrensburg
- Score
- 63/100
- State rank
- #823
- US rank
- #15925
Category grades
Schools grade is shown separately in the Schools card above.
Census & demographics
- Population (ZIP)
- 4,389
Population outlook (Warren County) Hauer SSP2
- Today (2025)
- 62,372 people
- By 2030
- 60,491 · -3.0%
- By 2040
- 55,616 · -10.8%
- By 2050
- 50,437 · -19.1%
- By 2075
- 40,843 · -34.5%
- By 2100
- 31,159 · -50.0%
Race, ethnicity, and origin ACS 2023
- Neighborhood character
- Predominantly White (92%)
- Race & ethnicity
- White 92% Hispanic / Latino 5% Two or more races 3% Black 1%
- Common ancestry
- Lithuanian 7% Italian 4% Iranian 3%
- Foreign-born
- 2% · Canada
- Languages at home
- 96% English-only · Spanish 2% French/Haitian/Cajun 1% Other Indo-European 1%
Political lean MEDSL · Warren
- 2024 margin
- Toss-up / Even · D 47.9% · R 52.1%
- 2008→2024 swing
- -6.9pp toward R · 2008: 2.6pp · 2024: -4.2pp
- All cycles
- 2024: R+4.2 2020: R+0.2 2016: R+10.6 2012: D+2.1 2008: D+2.6
Not yet ingested
- Civics
- —
Market trends
- HPI YoY
- ▲ 12.18%
- Current HPI
- 364.9782
- Rent YoY
- —
- Metro
- —
- State GDP YoY
- ▲ 2.60%
- F500 in state
- 92
Industry mix (Fortune 500 HQ in NY)
| Industry | F500 HQs | Revenue |
|---|---|---|
| Financial Services | 10 | $950B |
|
||
| Consumer Goods | 9 | $162B |
|
||
| Insurance | 4 | $225B |
|
||
| Telecommunications | 2 | $144B |
|
||
| Pharmaceuticals | 2 | $112B |
|
||
| Media / Entertainment | 2 | $69B |
|
||
Price history
+66.8% since first listed4 events — show timeline
- 2026-06-01 Listed $325,000 Global MLS
- 2019-03-01 Listing Removed — Global MLS
- 2010-10-25 Sold (Public Records) $206,170 Public Records
- 2010-07-15 Listed $194,900 Global MLS
Property tax history
+7.9%/yrLatest (2025): $4,863 · +13.2% YoY. Source: county tax records.
Cash-flow waterfall
monthlySold comps — $/sqft
last 12 mo · ≤1 miLoading sold comps…