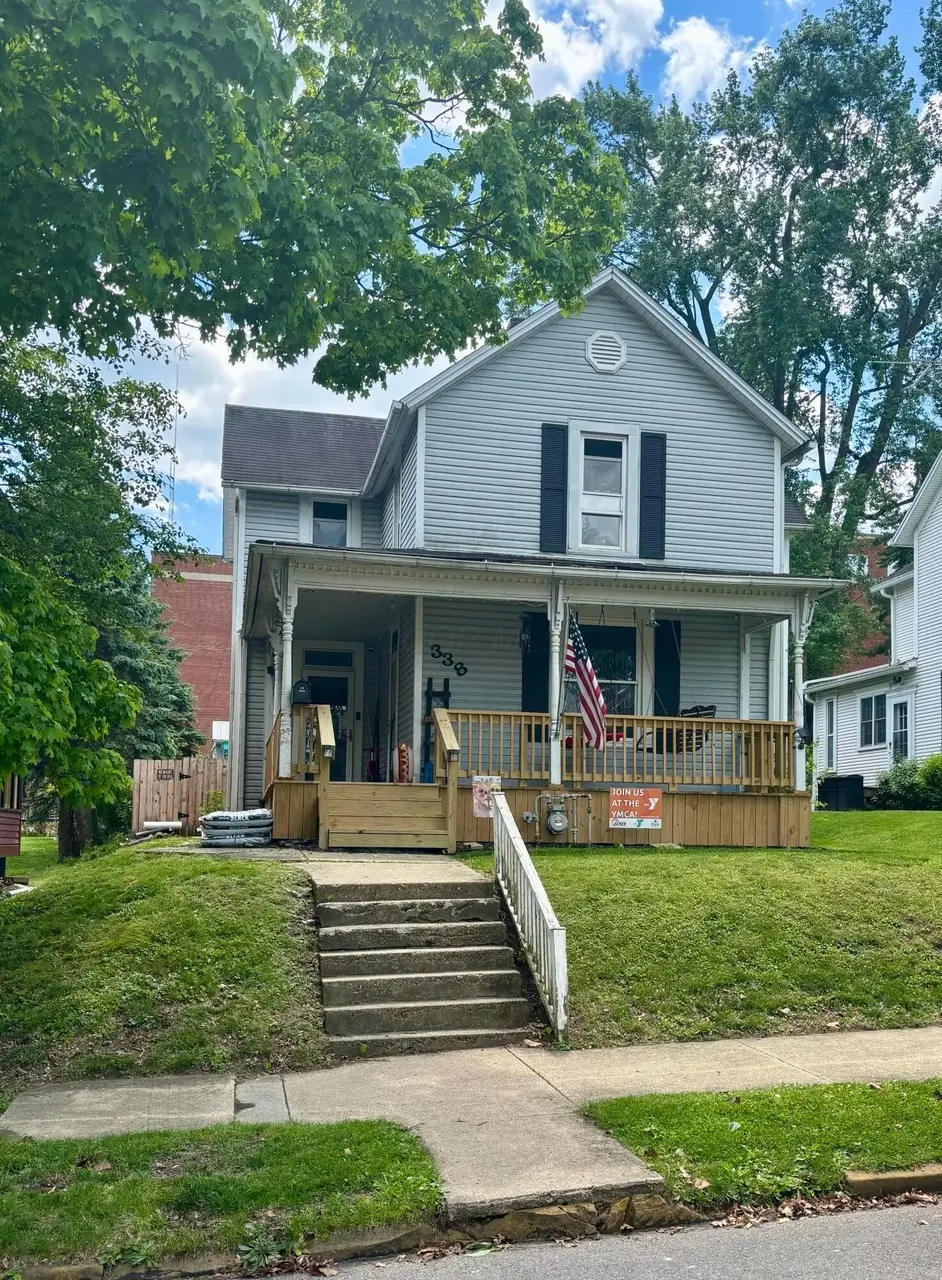
338 King St · Lancaster, OH
Flood risk 1/10 · Minimal
- FEMA flood zone
- X (unshaded)
- Chance of flooding over 30 yrs
- 0.0%
- Est. flood insurance / yr
- $473 – $860
Fire risk 3/10 · Minor
- Est. fire insurance / yr
- $713 – $1,323
Heat risk 4/10 · Minor
- Hot days now (above 100°F)
- 7 days/yr
- Hot days in 30 yrs
- 19 days/yr
Wind risk 2/10 · Minimal
- Chance of severe wind over 30 yrs
- 0.0%
Air-quality risk 2/10 · Minimal
- Unhealthy air days now
- 1 days/yr
- Unhealthy air days in 30 yrs
- 2 days/yr
Risk factors via First Street. Map © Google.
Why this score? — see what drove the C- grade
The composite is a weighted blend of 9 inputs, each scored 0–100. Each bar is that input's sub-score; the figure is the points it added to the 100-point composite (weight × sub-score).
- Cash flow +15.8/30.0
- ARV discount +14.7/15.0
- DSCR +4.9/10.0
- Livability +4.3/5.0
- 1% rule +3.9/10.0
- Rent growth +3.8/5.0
- Schools +3.7/10.0
- Condition / age +2.5/5.0
- Appreciation +0.0/10.0
$225,000
🖨 Deal sheet 📄 Offer letter ✓ Due diligence
Listing remarks MLS
You’ll love this stunning 4 bd possible 5 bd, 2 bath home! Completely updated with fresh paint, all new carpeting, beautifully stained original hardwood floors, wide white baseboards, charming new light fixtures, as well as mostly replaced electric and plumbing. The living room offers white wainscoting wall panel and built-in bookshelves. The new kitchen gives you the luxury of Travertine tile floors, gorgeous wood cabinets, brand new stainless steal appliances, ceramic glass mosaic tile backsplash, and island with bar stools and double steel stink!
Key facts
- 7,405 sq ft lot
- 2 garage spots
- Built 1900
Property features AI
Exterior
- Parking: Detached 2-car garage with garage door opener
- Utilities: Public water; Public sewer
- Home design: Single-family residence; Two levels; Built in 1900; No shared/common walls
- Construction: Stone foundation
- Exterior features: Patio; Deck; Fenced yard
Interior
- Flooring: Wood; Carpet; Ceramic/Porcelain
- Bathrooms: 2 full bathrooms
- Heating & cooling: Forced air heating; Central air conditioning
- Interior features: Decorative fireplace; Insulated windows; Cellar basement
Neighborhood map
What this means for you Summary
Snapshot
- This is a 4-bed/2.0-bath single-family listed at $225k.
Deal economics
- At list price, monthly cash flow is $103 ($1k/yr) — positive.
- The deal already cash-flows at list — no discount required.
- To meet the 1% rule (rent ≥ 1% of price), the offer needs to be $201k (10.8% below list).
- Recommended offer: $201k (10.8% below list) — sets the bar for 1% rule.
- Cap rate 6.8% vs local median 4.0% in Lancaster — top-decile yield for the area; either an underpriced asset or a hidden risk that comps aren't pricing in. Stress-test before assuming the spread holds.
Location & tenants
- Location reads 86/100 on livability (#41 in OH, #423 nationally) — a professional / high-income tenant draw. Strengths: amenities A+, cost of living A+, housing A+; Watch: crime D, employment D.
- Lancaster City (town): math 38% / reading 51% proficiency, ranked #504 of 656 in OH (top 77%) — families likely to look elsewhere, expect single-tenant / working-renter base with shorter leases.
- Market conditions: Rents rising fast (+5.2%/yr); 204 active listings in the ZIP; 4 comparable units currently listed for rent nearby; rentals leasing fast (median 12d on market — plan ~1-2 weeks tenant-placement turnaround); 475 units permitted in Fairfield County in 2024 (0 in 5+ unit buildings).
- This rent runs 33% of the median local income ($72k/yr) — at the standard rent-burdened threshold; future hikes will face affordability resistance.
Forward outlook
- Local home prices are declining (-3.0%/yr); year-one equity from $2k of loan paydown is wiped out by about $7k of value loss. Plan a longer hold.
- Fairfield County population projected at +8% by 2050 — modest demand growth; plan on rents tracking national, not racing it.
Negotiation context
- It's been on market 15 days — a 2% lower offer ($222k) is reasonable based on typical stale-listing flexibility.
- 3 sale attempts since 12y ago; this cycle's ask has dropped $20k (8%) from the opening price — seller is motivated, your offer sets the floor, not the list.
- Current owner paid $130k; list at $225k implies a 73% gain — meaningful room to come down on a strong offer.
Risks & watch-outs
- Watch-outs: built in 1900 — expect roof / HVAC / electrical / plumbing capex.
Questions for the listing agent
- Built in 1900 — when were the roof, HVAC, electrical panel, plumbing, and water heater last replaced?
- Is there a deadline driving the sale (1031 exchange, divorce, estate, relocation)? That informs how much negotiation room exists.
- Crime grade is D in this area — have there been break-ins, vandalism, or insurance claims at this property in the last 3 years? What carrier currently insures it and at what premium?
- What's the average days-on-market for RENTAL listings here right now (not sales)? A rising rental-DOM trend means longer vacancies and softer asking-rent achievability than the comps imply.
- What's the recent tenant-quality profile in this submarket — average credit score on applications, eviction rate, late-payment / NSF rate, and stable-employment percentage? A property-management company in the area should have these aggregated.
- How much new for-sale + rental construction is in the pipeline within 1–3 miles? Heavy new supply typically softens prices + rents 12–24 months out; constrained supply supports both.
Investment metrics
- 1% rule
- 0.89% ✗
- Cap rate
- 6.84%
- Cash-on-cash
- 1.97%
- DSCR
- 1.09
- GRM
- 9.3
CMA / ARV
- ARV (median comp)
- $267,983
- List price
- $225,000
- Delta
- -16.04%
- Verdict
- UNDERPRICED
- Comps
- 20 within 1.0 mi
Show comp detail 12 sales within ~0.75 mi
| Address | Dist | Beds/Ba | Sqft | Sold | Price | $/sf | Match |
|---|---|---|---|---|---|---|---|
| 769 E Mulberry St | 0.56mi | 3/2.0 (-1) | 1,953 (-1%) | 0mo | $250,000 | $128 | 67 |
| 114 S Maple St | 0.32mi | 4/2.5 | 2,160 (+10%) | 0mo | $160,000 | $74 | 66 |
| 820 N Broad St | 0.48mi | 3/1.5 (-1) | 1,932 (-2%) | 1mo | $339,900 | $176 | 66 |
| 534 E Wheeling St | 0.28mi | 4/1.5 | 2,182 (+11%) | 3mo | $273,000 | $125 | 65 |
| 830 N Broad St | 0.50mi | 4/1.5 | 1,858 (-6%) | 4mo | $210,000 | $113 | 62 |
| 537 E Wheeling St | 0.27mi | 3/2.0 (-1) | 1,699 (-14%) | 0mo | $255,000 | $150 | 59 |
| 233 E 6th Ave | 0.21mi | 3/1.5 (-1) | 1,716 (-13%) | 3mo | $280,000 | $163 | 59 |
| 414 E Walnut St | 0.43mi | 3/2.0 (-1) | 1,780 (-10%) | 2mo | $276,000 | $155 | 57 |
| 123 Arnold Ave | 0.50mi | 4/4.0 | 2,108 (+7%) | 3mo | $299,000 | $142 | 55 |
| 664 Smithfield Ave | 0.68mi | 3/1.0 (-1) | 1,925 (-2%) | 2mo | $63,910 | $33 | 54 |
| 538 E 6th Ave | 0.28mi | 3/1.5 (-1) | 1,704 (-13%) | 4mo | $272,000 | $160 | 54 |
| 844 E Wheeling St | 0.67mi | 3/1.5 (-1) | 1,750 (-11%) | 1mo | $265,000 | $151 | 43 |
Match score weights: distance 35% · size 25% · config 20% · recency 20%. Top-matched comps best support the ARV.
Projected returns pro-forma
-3.0% appreciation · 5.22% rent growth · sell at horizon
- IRR
- -10.8%
- Equity multiple
- 0.60×
- Total profit
- $-25,301
- Equity at exit
- $33,548
- IRR
- 1.2%
- Equity multiple
- 1.10×
- Total profit
- $6,079
- Equity at exit
- $19,454
Cash invested: $63,000 (down + closing). Projections, not guarantees.
Landlord ↔ Tenant lean methodology
- Overall (STATE)
- 73 Landlord-Friendly
- State Ohio
- 73 Landlord-Friendly · R+6
- County
- — inherits STATE
- City
- — inherits STATE
ZIP-level market 43130
- Rents YoY
- 5.2%
- Active inventory
- 204
- Price-to-rent
- 9.3×
Monthly cashflow live
- Estimated rent
- $2,008 medium interval (Pro) →
- Mortgage (P&I)
- −$1,180
- Tax from tax record
- −$209 /mo · $2,508/yr
- Insurance
- −$94
- HOA
- −$0
- Vacancy / Maint / Mgmt
- −$422
- Net cashflow
- $103
Break-even live
UW: 25.0% down · 7.5% · 30yr · 1.5% tax · 5.0% vac · 8.0% maint · 8.0% mgmt
Financing live
Cash to close
- Down payment
- $56,250
- Closing costs
- $6,750
- Reserves months
- —
- Total cash needed
- —
Loan-product check · same deal, 3 products live
Conventional
25% down · 7.5% · 30yr
- Down + closing
- —
- Monthly P&I
- —
- Monthly cashflow
- —
- DSCR
- —
- Eligible?
- —
Personal DTI + credit; lowest rate.
DSCR
20% down · 8.5% · 30yr
- Down + closing
- —
- Monthly P&I
- —
- Monthly cashflow
- —
- DSCR
- —
- Eligible?
- —
No personal income docs; deal must DSCR.
Hard money
10% down · 12.0% · 12mo
- Down + closing
- —
- Monthly P&I
- —
- Monthly cashflow
- —
- DSCR
- —
- Eligible?
- —
Short-term bridge; refi at stabilization.
Rent comps 4 comps
| Address | Beds | Baths | Sqft | Rent | $/sqft | DOM | Units | Dist |
|---|---|---|---|---|---|---|---|---|
| 635 N High St Lancaster, OH | 3.0 | 2.0 | 1608 | $2,200 | $1.37 | 43d | 1 | 0.29mi |
| 1508 Greyfield ST Lancaster, OH | 1.0–3.0 | 1.0–2.0 | 953 | $1,869 | $1.96 | 1d | 1 | 0.38mi |
| 421 Washington Ave Lancaster, OH | 4.0 | 1.0 | 1296 | $1,650 | $1.27 | 12d | 1 | 1.11mi |
| 1733 Bellmeadow Dr Lancaster, OH | 1.0–3.0 | 1.0–2.5 | 993 | $1,855 | $1.87 | 1d | 10 | 1.49mi |
Listing history 23 events
-
2026-06-18days on market $225,000 Active 15 DOM
-
2026-06-17days on market $225,000 Active 14 DOM
-
2026-06-16days on market $225,000 Active 13 DOM
-
2026-06-15pricedays on market $225,000 Active 12 DOM
-
2026-06-13days on market $239,900 Active 10 DOM
-
2026-06-09days on market $239,900 Active 6 DOM
-
2026-06-08pricedays on market $239,900 Active 5 DOM
-
2026-06-08remarks 699-char remark
-
2026-06-07days on market $245,000 Active 4 DOM
-
2026-06-03statusdays on market $245,000 Active 1 DOM
-
2026-06-02days on market $245,000 Coming Soon 29 DOM
-
2026-06-01days on market $245,000 Coming Soon 28 DOM
-
2026-05-31days on market $245,000 Coming Soon 27 DOM
-
2026-05-05historical $245,000 697-char remark
-
2015-12-15soldstatus $130,000
-
2015-12-11soldstatus $130,000 561-char remark
Show marketing remark (561 chars)
You’ll love this stunning 4 bd possible 5 bd, 2 bath home! Completely updated with fresh paint, all new carpeting, beautifully stained original hardwood floors, wide white baseboards, charming new light fixtures, as well as mostly replaced electric and plumbing. The living room offers white wainscoting wall panel and built-in bookshelves. The new kitchen gives you the luxury of Travertine tile floors, gorgeous wood cabinets, brand new stainless steal appliances, ceramic glass mosaic tile backsplash, and island with bar stools and double steel stink!
-
2015-10-20historical 561-char remark
Show marketing remark (561 chars)
You’ll love this stunning 4 bd possible 5 bd, 2 bath home! Completely updated with fresh paint, all new carpeting, beautifully stained original hardwood floors, wide white baseboards, charming new light fixtures, as well as mostly replaced electric and plumbing. The living room offers white wainscoting wall panel and built-in bookshelves. The new kitchen gives you the luxury of Travertine tile floors, gorgeous wood cabinets, brand new stainless steal appliances, ceramic glass mosaic tile backsplash, and island with bar stools and double steel stink!
-
2015-07-01$134,888 561-char remark
Show marketing remark (561 chars)
You’ll love this stunning 4 bd possible 5 bd, 2 bath home! Completely updated with fresh paint, all new carpeting, beautifully stained original hardwood floors, wide white baseboards, charming new light fixtures, as well as mostly replaced electric and plumbing. The living room offers white wainscoting wall panel and built-in bookshelves. The new kitchen gives you the luxury of Travertine tile floors, gorgeous wood cabinets, brand new stainless steal appliances, ceramic glass mosaic tile backsplash, and island with bar stools and double steel stink!
-
2014-04-22soldstatus $52,549
Show marketing remark (320 chars)
REO Property, Property Sold AS-IS W/ O Repair, Warranty or Seller Disclosure. The Listing Broker & Seller make no guarantees as to the accuracy of information herein; Buyer or Buyer’s Agent is responsible for utility activation related to inspections, Water activation not authorized; air pressure test only.
-
2014-04-02historical
Show marketing remark (320 chars)
REO Property, Property Sold AS-IS W/ O Repair, Warranty or Seller Disclosure. The Listing Broker & Seller make no guarantees as to the accuracy of information herein; Buyer or Buyer’s Agent is responsible for utility activation related to inspections, Water activation not authorized; air pressure test only.
-
2014-03-24$53,000
Show marketing remark (320 chars)
REO Property, Property Sold AS-IS W/ O Repair, Warranty or Seller Disclosure. The Listing Broker & Seller make no guarantees as to the accuracy of information herein; Buyer or Buyer’s Agent is responsible for utility activation related to inspections, Water activation not authorized; air pressure test only.
-
1993-11-29soldstatus $84,500
-
1990-09-11soldstatus $48,000
ⓘ Source: listings_history table (triggers on properties + properties_extension) + one-shot
backfill from property_details.listing_events for pre-trigger history.
Tax reassessment forecast OH · Partial reset (capped growth)
- Current annual tax
- $2,508 · $209/mo
- Projected year-2 tax
- $3,009 · $251/mo
- Expected delta
- +$501/yr (+$42/mo · 20.0%)
ⓘ Screening estimate from a state-policy table — verify with the county assessor before closing.
Climate risk First Street
- Flood 1/10 Low FEMA zone X (unshaded) · 0% chance over 30 yrs
- Wildfire 3/10 Moderate
- Heat 4/10 Moderate 7 d/yr ≥100°F today · 19 d/yr by 30 yrs out
- Wind 2/10 Low 0% chance of damaging wind over 30 yrs
- Air quality 2/10 Low 1 unhealthy d/yr today · 2 by 30 yrs out
Nearby sold comps map
Loading sold comps map…
Walkable amenities ~0.75 mi
Loading nearby amenities…
Taxation est. · year 1
- Rental income
- $24,093
- − Mortgage interest
- −$12,603
- − Property taxes
- −$2,508
- − Insurance
- −$1,125
- − Repairs & maintenance
- −$1,927
- − Management
- −$1,927
- − Depreciation
- −$6,545
- Taxable loss
- −$2,544
- Est. tax savings @ 24.0%
- +$611
- After-tax cash flow
- $1,852/yr
For passive investors: Depreciation is non-cash, so a rental often shows a tax loss while cash-flowing — sheltering income. Rental losses are passive: they offset passive income freely, and up to $25,000/yr can offset ordinary (W-2) income if you actively participate and your MAGI is under $100k (phasing out to $0 by $150k); unused losses carry forward. On sale, claimed depreciation is recaptured at up to 25%, and gains may owe capital-gains tax (a 1031 exchange can defer both). Figures are a year-1 estimate at your 24.0% rate — not tax advice; consult a CPA.
Schools (NCES district)
- District
- Lancaster City
- NCES district ID
- 3904420
- Math proficiency
- 38% ▼ -21.00%
- Reading proficiency
- 51% ▼ -11.00%
- Median HH income
- $41,696
- Composite
- 37.39/100
- National rank
- #4427
- State rank
- #504 of 656 in OH
Livability — Lancaster
- Score
- 86/100
- State rank
- #41
- US rank
- #423
Category grades
Schools grade is shown separately in the Schools card above.
Census & demographics
- Census place
- Lancaster, OH
- County
- Fairfield County · 109,896 people
- City population
- 62,933
- Metro
- Columbus, OH
- Population (ZIP)
- 62,933
- Household income
- $72,153
- Rent vs Own
- Severe rent burden
- 1400.0
Population outlook (Fairfield County) Hauer SSP2
- Today (2025)
- 162,442 people
- By 2030
- 166,796 · +2.7%
- By 2040
- 172,835 · +6.4%
- By 2050
- 174,822 · +7.6%
- By 2075
- 174,938 · +7.7%
- By 2100
- 160,988 · -0.9%
Race, ethnicity, and origin ACS 2023
- Neighborhood character
- Predominantly White (91%)
- Race & ethnicity
- White 91% Two or more races 4% Hispanic / Latino 2% Black 2%
- Common ancestry
- Slovak 2% Italian 1% Iranian 1%
- Foreign-born
- 1% · Canada
- Languages at home
- 98% English-only · Spanish 1%
Political lean MEDSL · Fairfield
- 2024 margin
- Strong R (+24.1) · D 37.5% · R 61.6%
- 2008→2024 swing
- -6.9pp toward R · 2008: -17.1pp · 2024: -24.1pp
- All cycles
- 2024: R+24.1 2020: R+23.5 2016: R+27.0 2012: R+16.1 2008: R+17.1
Not yet ingested
- Civics
- —
Market trends
- HPI YoY
- ▼ -298.81%
- Current HPI
- 239.6352
- Rent YoY
- ▲ 5.22%
- Metro
- Columbus, OH
- State GDP YoY
- ▲ 1.98%
- F500 in state
- 48
Industry mix (Fortune 500 HQ in OH)
| Industry | F500 HQs | Revenue |
|---|---|---|
| Insurance | 3 | $145B |
|
||
| Industrial Machinery | 3 | $49B |
|
||
| Financial Services | 3 | $24B |
|
||
| Consumer Goods | 2 | $93B |
|
||
| Aerospace / Defense | 2 | $47B |
|
||
| Utilities | 2 | $33B |
|
||
Price history
+368.8% since first listed13 events — show timeline
- 2026-06-14 Price Changed $225,000 CBRMLS
- 2026-06-08 Price Changed $239,900 CBRMLS
- 2026-06-03 Listed $245,000 CBRMLS
- 2026-05-05 Coming Soon $245,000 CBRMLS
- 2015-12-15 Sold (Public Records) $130,000 Public Records
- 2015-12-11 Sold (MLS) $130,000 CBRMLS
- 2015-10-20 Listing Removed — CBRMLS
- 2015-07-01 Listed $134,888 CBRMLS
- 2014-04-22 Sold (MLS) $52,549 CBRMLS
- 2014-04-02 Listing Removed — CBRMLS
- 2014-03-24 Listed $53,000 CBRMLS
- 1993-11-29 Sold (Public Records) $84,500 Public Records
- 1990-09-11 Sold (Public Records) $48,000 Public Records
Property tax history
+3.9%/yrLatest (2025): $2,508 · +16.2% YoY. Source: county tax records.
Cash-flow waterfall
monthlySold comps — $/sqft
last 12 mo · ≤1 miLoading sold comps…