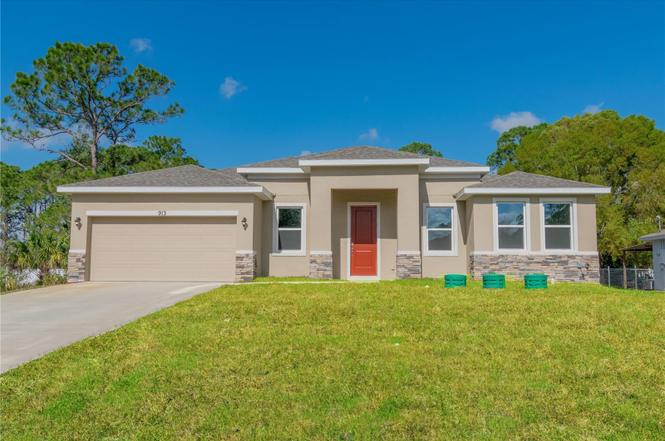
913 Sanger St SE · Palm Bay, FL
Flood risk 1/10 · Minimal
- FEMA flood zone
- X (shaded)
- Chance of flooding over 30 yrs
- 0.0%
- Est. flood insurance / yr
- $507 – $1,088
Fire risk 2/10 · Minimal
- Est. fire insurance / yr
- $947 – $1,759
Heat risk 10/10 · Severe
- Hot days now (above 106°F)
- 7 days/yr
- Hot days in 30 yrs
- 22 days/yr
Wind risk 10/10 · Severe
- Chance of severe wind over 30 yrs
- 99.0%
Air-quality risk 1/10 · Minimal
- Unhealthy air days now
- 0 days/yr
- Unhealthy air days in 30 yrs
- 0 days/yr
Risk factors via First Street. Map © Google.
Why this score? — see what drove the D- grade
The composite is a weighted blend of 9 inputs, each scored 0–100. Each bar is that input's sub-score; the figure is the points it added to the 100-point composite (weight × sub-score).
- Appreciation +10.0/10.0
- ARV discount +7.5/15.0
- Cash flow +5.3/30.0
- Schools +4.7/10.0
- Livability +3.6/5.0
- Rent growth +3.4/5.0
- Condition / age +2.5/5.0
- 1% rule +0.8/10.0
- DSCR +0.0/10.0
$369,900
🖨 Deal sheet 📄 Offer letter ✓ Due diligence
Listing remarks MLS
Nice lot near Majors Golf Club. Lots of new homes being built on this street, get your lot in this growing community! No HOA. Close to schools, shopping, restaurants etc, but still a piece of paradise to ''get away from it all!''
Key facts
- 0.23 acre lot
- 2 garage spots
- Built 2023
Property features AI
Finance
- Other: Lot approximately 0.23 acres (80 x 125, asphalt road access)
Exterior
- Parking: Attached garage with 2 garage spaces
- Utilities: Public water; Public sewer; Public utilities
- Home design: Single-family residence; Residential property; Completed condition; One story; Faces east; New construction
- Construction: Block construction; Built-up roof; Slab foundation; Built in or around 2025 (new construction)
- Exterior features: Other
Interior
- Kitchen: Dishwasher; Disposal
- Bedrooms: 3 bedrooms
- Flooring: Carpet; Ceramic tile
- Bathrooms: 2 full bathrooms
- Heating & cooling: Electric heating; Central air conditioning
- Interior features: Kitchen/family room combo
- Laundry & utility: Dedicated laundry room
Neighborhood map
What this means for you Summary
Snapshot
- This is a 3-bed/2.0-bath single-family listed at $370k.
Deal economics
- At list price, monthly cash flow is $-814 ($-10k/yr) — negative.
- To cash-flow at today's rent, offer at most $226k (38.9% below list).
- To meet the 1% rule (rent ≥ 1% of price), the offer needs to be $215k (42.0% below list).
- Recommended offer: $215k (42.0% below list) — sets the bar for 1% rule.
Location & tenants
- Location reads 72/100 on livability (#366 in FL) — a middle-class / working-renter tenant base. Strengths: cost of living A+, housing A+; Watch: schools C-, employment D+, amenities F.
- Brevard (suburban): math 53% / reading 57% proficiency, ranked #19 of 73 in FL (top 26%) — acceptable for families but not a draw, mixed tenant base, ~2y average lease.
- Market conditions: Rents rising (+3.7%/yr); 1111 active listings in the ZIP; 27 comparable units currently listed for rent nearby; rentals at typical pace (median 21d on market — plan ~3-4 weeks tenant-placement turnaround); solid renter incomes; 4,602 units permitted in Brevard County in 2024 (702 in 5+ unit buildings).
- This rent runs 32% of the median local income ($80k/yr) — at the standard rent-burdened threshold; future hikes will face affordability resistance.
Forward outlook
- In year one you build about $40k of equity ($3k loan paydown + $37k appreciation (10.0% local appreciation)).
- Brevard County population projected at +15% by 2050 — modest demand growth; plan on rents tracking national, not racing it.
- By year 2, paydown + projected appreciation supports a ~$64k cash-out refi (75% LTV) — recoverable capital for the next deal without selling this one.
Negotiation context
- It's been on market 210 days — a 12% lower offer ($326k) is reasonable based on typical stale-listing flexibility.
- 6 sale attempts since 5y ago with the ask held roughly flat each time — persistent listings suggest the price (not the market) is what's stuck; bring a comps-based counter.
- Current owner paid $32k; list at $370k implies a 1074% gain — meaningful room to come down on a strong offer.
Risks & watch-outs
- Climate carrying-cost: severe wind risk, 99% chance of damaging wind over 30y; extreme-heat days projected 7→22/yr by 2055 (HVAC capex compounding) — expect insurance premiums to compound above CPI over the hold.
Questions for the listing agent
- What do current leases actually rent for vs. the listed asking? Can we see a recent rent roll and the last 12 months of T-12 income?
- It's been on market 210 days. Have you received any prior offers? Is the seller open to a 42% concession, seller financing, or rate buy-down credit?
- Why hasn't it sold? Are there any deal-killer items the seller is aware of (foundation, flood, title, zoning, code violations)?
- Is there a deadline driving the sale (1031 exchange, divorce, estate, relocation)? That informs how much negotiation room exists.
- The area grade is low — what's the realistic commute time and amenity access for the typical tenant pool here? Any planned neighborhood developments (good or bad) we should know about?
- What's the average days-on-market for RENTAL listings here right now (not sales)? A rising rental-DOM trend means longer vacancies and softer asking-rent achievability than the comps imply.
- What's the recent tenant-quality profile in this submarket — average credit score on applications, eviction rate, late-payment / NSF rate, and stable-employment percentage? A property-management company in the area should have these aggregated.
- How much new for-sale + rental construction is in the pipeline within 1–3 miles? Heavy new supply typically softens prices + rents 12–24 months out; constrained supply supports both.
Investment metrics
- 1% rule
- 0.58% ✗
- Cap rate
- 3.65%
- Cash-on-cash
- -9.43%
- DSCR
- 0.58
- GRM
- 14.4
CMA / ARV
No comps found within radius.
Projected returns pro-forma
10.0% appreciation · 3.67% rent growth · sell at horizon
- IRR
- 17.8%
- Equity multiple
- 2.46×
- Total profit
- $151,077
- Equity at exit
- $333,235
- IRR
- 16.8%
- Equity multiple
- 5.72×
- Total profit
- $488,704
- Equity at exit
- $718,634
Cash invested: $103,572 (down + closing). Projections, not guarantees.
Landlord ↔ Tenant lean methodology
- Overall (STATE)
- 87 Strongly Landlord-Friendly
- State Florida
- 87 Strongly Landlord-Friendly · R+3
- County
- — inherits STATE
- City
- — inherits STATE
ZIP-level market 32909
- Home prices YoY
- 6.0%
- Rents YoY
- 3.7%
- Active inventory
- 1111
- Price-to-rent
- 14.4×
Monthly cashflow live
- Estimated rent
- $2,145 high interval (Pro) →
- Mortgage (P&I)
- −$1,940
- Tax from tax record
- −$415 /mo · $4,975/yr
- Insurance
- −$154
- HOA
- −$0
- Vacancy / Maint / Mgmt
- −$450
- Net cashflow
- $-814
Break-even live
UW: 25.0% down · 7.5% · 30yr · 1.5% tax · 5.0% vac · 8.0% maint · 8.0% mgmt
Financing live
Cash to close
- Down payment
- $92,475
- Closing costs
- $11,097
- Reserves months
- —
- Total cash needed
- —
Loan-product check · same deal, 3 products live
Conventional
25% down · 7.5% · 30yr
- Down + closing
- —
- Monthly P&I
- —
- Monthly cashflow
- —
- DSCR
- —
- Eligible?
- —
Personal DTI + credit; lowest rate.
DSCR
20% down · 8.5% · 30yr
- Down + closing
- —
- Monthly P&I
- —
- Monthly cashflow
- —
- DSCR
- —
- Eligible?
- —
No personal income docs; deal must DSCR.
Hard money
10% down · 12.0% · 12mo
- Down + closing
- —
- Monthly P&I
- —
- Monthly cashflow
- —
- DSCR
- —
- Eligible?
- —
Short-term bridge; refi at stabilization.
Rent comps 27 comps
| Address | Beds | Baths | Sqft | Rent | $/sqft | DOM | Units | Dist |
|---|---|---|---|---|---|---|---|---|
| 978 Remington Green Dr SE Palm Bay, FL | 4.0 | 2.0 | 1830 | $2,200 | $1.20 | 23d | 1 | 0.48mi |
| 2036 Walsh Ave SE Palm Bay, FL | 3.0 | 2.0 | 1331 | $1,930 | $1.45 | 23d | 1 | 0.54mi |
| 2250 Chinaberry Cir SE Palm Bay, FL | 3.0 | 2.0 | 1669 | $1,995 | $1.20 | 23d | 1 | 0.64mi |
| 1150 Tiger St SE Palm Bay, FL | 3.0 | 2.0 | 1690 | $1,950 | $1.15 | 14d | 1 | 0.65mi |
| 1068 Saint Johns St SE Palm Bay, FL | 3.0 | 2.0 | 1332 | $2,000 | $1.50 | 23d | 1 | 0.71mi |
| 2910 Emerson Dr SE Palm Bay, FL | 3.0 | 2.0 | 1700 | $1,950 | $1.15 | 14d | 1 | 0.91mi |
| 1517 Wacker Ave SE Palm Bay, FL | 4.0 | 2.0 | 1775 | $2,200 | $1.24 | 23d | 1 | 0.92mi |
| 1150 Raoul St SE Palm Bay, FL | 4.0 | 2.0 | 1787 | $2,300 | $1.29 | 23d | 1 | 0.97mi |
| 1165 Rabbit St SE Palm Bay, FL | 3.0 | 2.0 | 1994 | $1,895 | $0.95 | 19d | 1 | 1.01mi |
| 830 Painesville St SE Palm Bay, FL | 3.0 | 2.0 | 2029 | $2,220 | $1.09 | 13d | 1 | 1.07mi |
| 1454 Graves St SE Palm Bay, FL | 3.0 | 2.0 | 1621 | $2,100 | $1.30 | 14d | 1 | 1.10mi |
| 818 Seven Gables Cir SE Palm Bay, FL | 3.0 | 2.0 | 1490 | $1,795 | $1.20 | 23d | 1 | 1.21mi |
| 1224 Dillard Dr SE Palm Bay, FL | 3.0 | 2.0 | 1770 | $2,336 | $1.32 | 13d | 1 | 1.22mi |
| 402 Breckenridge Cir SE Palm Bay, FL | 3.0 | 2.0 | 1960 | $2,200 | $1.12 | 23d | 1 | 1.22mi |
| 822 Seven Gables Cir SE Palm Bay, FL | 3.0 | 2.0 | 1474 | $1,835 | $1.24 | 23d | 1 | 1.22mi |
| 590 Trymore Dr SE Palm Bay, FL | 4.0 | 2.0 | 1873 | $2,250 | $1.20 | 14d | 1 | 1.24mi |
| 1406 Martinez St SE Palm Bay, FL | 4.0 | 2.0 | 2083 | $2,100 | $1.01 | 23d | 1 | 1.30mi |
| 1416 Martinez St SE Palm Bay, FL | 3.0 | 2.0 | 1747 | $2,000 | $1.14 | 14d | 1 | 1.30mi |
| 2691 Tepee Ave SE Palm Bay, FL | 4.0 | 2.0 | 1833 | $2,040 | $1.11 | 21d | 1 | 1.32mi |
| 1625 Waneta St SE Palm Bay, FL | 3.0 | 2.0 | 1631 | $2,100 | $1.29 | 19d | 1 | 1.36mi |
| 1530 Paley Cir SE Palm Bay, FL | 4.0 | 2.0 | 1842 | $2,095 | $1.14 | 14d | 1 | 1.37mi |
| 1674 Waltz St SE Palm Bay, FL | 3.0 | 2.0 | 1262 | $1,831 | $1.45 | 13d | 1 | 1.39mi |
| 1290 Sail Ct SE Palm Bay, FL | 3.0 | 2.0 | 1509 | $1,945 | $1.29 | 23d | 1 | 1.39mi |
| 1198 Venus St SE Palm Bay, FL | 3.0 | 2.0 | 1535 | $1,961 | $1.28 | 21d | 1 | 1.44mi |
| 1677 Lizette St SE Unit A Palm Bay, FL | 3.0 | 2.0 | 2080 | $1,900 | $0.91 | 14d | 1 | 1.45mi |
| 1660 Lizette St SE Unit 1 Palm Bay, FL | 4.0 | 2.0 | 1736 | $2,199 | $1.27 | 23d | 1 | 1.45mi |
| 1418 Paley Cir SE Palm Bay, FL | 3.0 | 2.0 | 1260 | $1,850 | $1.47 | 23d | 1 | 1.47mi |
Listing history 30 events
-
2026-06-18days on market $369,900 Active 210 DOM
-
2026-06-17days on market $369,900 Active 209 DOM
-
2026-06-16days on market $369,900 Active 208 DOM
-
2026-06-15days on market $369,900 Active 207 DOM
-
2026-06-14days on market $369,900 Active 205 DOM
-
2026-06-10days on market $369,900 Active 202 DOM
-
2026-06-08days on market $369,900 Active 200 DOM
-
2026-06-07days on market $369,900 Active 199 DOM
-
2026-06-05days on market $369,900 Active 196 DOM
-
2026-06-03days on market $369,900 Active 195 DOM
-
2026-06-02days on market $369,900 Active 194 DOM
-
2026-06-01days on market $369,900 Active 193 DOM
-
2026-05-31days on market $369,900 Active 192 DOM
-
2026-05-31days on market $369,900 Active 191 DOM
-
2025-11-20$369,900 Active
-
2025-02-20historical
-
2024-03-25historical $2,500
-
2024-03-18price $2,500
-
2024-02-28$2,700
-
2024-02-20$400,000 Active
-
2022-08-22soldstatus $31,500
-
2022-08-19soldstatus $31,500 Closed 230-char remark
Show marketing remark (230 chars)
Nice lot near Majors Golf Club. Lots of new homes being built on this street, get your lot in this growing community! No HOA. Close to schools, shopping, restaurants etc, but still a piece of paradise to ''get away from it all!''
-
2022-06-28historical Contingent 230-char remark
Show marketing remark (230 chars)
Nice lot near Majors Golf Club. Lots of new homes being built on this street, get your lot in this growing community! No HOA. Close to schools, shopping, restaurants etc, but still a piece of paradise to ''get away from it all!''
-
2022-06-20status Active 230-char remark
Show marketing remark (230 chars)
Nice lot near Majors Golf Club. Lots of new homes being built on this street, get your lot in this growing community! No HOA. Close to schools, shopping, restaurants etc, but still a piece of paradise to ''get away from it all!''
-
2022-05-31historical Contingent 230-char remark
Show marketing remark (230 chars)
Nice lot near Majors Golf Club. Lots of new homes being built on this street, get your lot in this growing community! No HOA. Close to schools, shopping, restaurants etc, but still a piece of paradise to ''get away from it all!''
-
2022-04-14status Active 230-char remark
Show marketing remark (230 chars)
Nice lot near Majors Golf Club. Lots of new homes being built on this street, get your lot in this growing community! No HOA. Close to schools, shopping, restaurants etc, but still a piece of paradise to ''get away from it all!''
-
2022-04-09historical 230-char remark
Show marketing remark (230 chars)
Nice lot near Majors Golf Club. Lots of new homes being built on this street, get your lot in this growing community! No HOA. Close to schools, shopping, restaurants etc, but still a piece of paradise to ''get away from it all!''
-
2021-10-10$32,500 Active 230-char remark
Show marketing remark (230 chars)
Nice lot near Majors Golf Club. Lots of new homes being built on this street, get your lot in this growing community! No HOA. Close to schools, shopping, restaurants etc, but still a piece of paradise to ''get away from it all!''
-
2004-10-05soldstatus $22,500
-
2004-08-02soldstatus $16,000
ⓘ Source: listings_history table (triggers on properties + properties_extension) + one-shot
backfill from property_details.listing_events for pre-trigger history.
Tax reassessment forecast FL · Resets to sale price
- Current annual tax
- $4,975 · $415/mo
- Projected year-2 tax
- $4,975 · $415/mo
- Expected delta
- $0/yr ($0/mo · 0.0%)
ⓘ Screening estimate from a state-policy table — verify with the county assessor before closing.
Climate risk First Street
- Flood 1/10 Low FEMA zone X (shaded) · 0% chance over 30 yrs
- Wildfire 2/10 Low
- Heat 10/10 Extreme 7 d/yr ≥106°F today · 22 d/yr by 30 yrs out
- Wind 10/10 Extreme 99% chance of damaging wind over 30 yrs
- Air quality 1/10 Low 0 unhealthy d/yr today · 0 by 30 yrs out
Nearby sold comps map
Loading sold comps map…
Walkable amenities ~0.75 mi
Loading nearby amenities…
Taxation est. · year 1
- Rental income
- $25,741
- − Mortgage interest
- −$20,720
- − Property taxes
- −$4,975
- − Insurance
- −$1,850
- − Repairs & maintenance
- −$2,059
- − Management
- −$2,059
- − Depreciation
- −$10,761
- Taxable loss
- −$16,683
- Est. tax savings @ 24.0%
- +$4,004
- After-tax cash flow
- $-5,763/yr
For passive investors: Depreciation is non-cash, so a rental often shows a tax loss while cash-flowing — sheltering income. Rental losses are passive: they offset passive income freely, and up to $25,000/yr can offset ordinary (W-2) income if you actively participate and your MAGI is under $100k (phasing out to $0 by $150k); unused losses carry forward. On sale, claimed depreciation is recaptured at up to 25%, and gains may owe capital-gains tax (a 1031 exchange can defer both). Figures are a year-1 estimate at your 24.0% rate — not tax advice; consult a CPA.
Schools (NCES district)
- District
- Brevard
- NCES district ID
- 1200150
- Math proficiency
- 53% ▼ -9.00%
- Reading proficiency
- 57% ▼ -4.00%
- Median HH income
- $49,426
- Composite
- 46.86/100
- National rank
- #2370
- State rank
- #19 of 73 in FL
Livability — Palm Bay
- Score
- 72/100
- State rank
- #366
- US rank
- #6458
Category grades
Schools grade is shown separately in the Schools card above.
Census & demographics
- Census place
- Palm Bay, FL
- County
- Brevard County · 602,871 people
- City population
- 132,211
- Metro
- Palm Bay-Melbourne-Titusville, FL
- Population (ZIP)
- 41,804
- Household income
- $79,977
- Rent vs Own
- Severe rent burden
- 697.0
Population outlook (Brevard County) Hauer SSP2
- Today (2025)
- 623,254 people
- By 2030
- 648,420 · +4.0%
- By 2040
- 690,009 · +10.7%
- By 2050
- 715,669 · +14.8%
- By 2075
- 775,744 · +24.5%
- By 2100
- 776,687 · +24.6%
Race, ethnicity, and origin ACS 2023
- Neighborhood character
- Diverse neighborhood (Simpson 0.70)
- Race & ethnicity
- White 46% Black 21% Hispanic / Latino 20% Two or more races 16% Asian 4%
- Hispanic origin (detail)
- Mexican 2% Puerto Rican 8% Cuban 5%
- Common ancestry
- Hispanic 3% Slovak 2% Lithuanian 2%
- Foreign-born
- 17% · Canada, China, Jamaica
- Languages at home
- 84% English-only · Spanish 9% French/Haitian/Cajun 4% Chinese 1%
Political lean MEDSL · Brevard
- 2024 margin
- Strong R (+20.8) · D 39.1% · R 59.9% · Other 1.0%
- 2008→2024 swing
- -10.4pp toward R · 2008: -10.4pp · 2024: -20.8pp
- All cycles
- 2024: R+20.8 2020: R+16.4 2016: R+19.8 2012: R+12.7 2008: R+10.4
Not yet ingested
- Civics
- —
Market trends
- HPI YoY
- ▲ 18.81%
- Current HPI
- 330.8595
- Rent YoY
- ▲ 3.67%
- Metro
- Palm Bay-Melbourne-Titusville, FL
- State GDP YoY
- ▲ 3.28%
- F500 in state
- 36
Industry mix (Fortune 500 HQ in FL)
| Industry | F500 HQs | Revenue |
|---|---|---|
| Industrial Technology | 2 | $29B |
|
||
| Insurance | 2 | $17B |
|
||
| Retail | 1 | $60B |
|
||
| Technology Distribution | 1 | $58B |
|
||
| Homebuilding | 1 | $35B |
|
||
| Technology Manufacturing | 1 | $35B |
|
||
Price history
+2211.9% since first listed16 events — show timeline
- 2025-11-20 Listed $369,900 Stellar MLS as Distributed by MLS Grid
- 2025-02-20 Listing Removed — Stellar MLS as Distributed by MLS Grid
- 2024-03-25 Rental Removed $2,500 STELLARMLS
- 2024-03-18 Price Changed $2,500 STELLARMLS
- 2024-02-28 Listed for Rent $2,700 STELLARMLS
- 2024-02-20 Listed $400,000 Stellar MLS as Distributed by MLS Grid
- 2022-08-22 Sold (Public Records) $31,500 Public Records
- 2022-08-19 Sold (MLS) $31,500 SCMLS
- 2022-06-28 Contingent — SCMLS
- 2022-06-20 Relisted — SCMLS
- 2022-05-31 Contingent — SCMLS
- 2022-04-14 Relisted — SCMLS
- 2022-04-09 Listing Removed — SCMLS
- 2021-10-10 Listed $32,500 SCMLS
- 2004-10-05 Sold (Public Records) $22,500 Public Records
- 2004-08-02 Sold (Public Records) $16,000 Public Records
Property tax history
+42.4%/yrLatest (2025): $4,975 · +730.2% YoY. Source: county tax records.
Cash-flow waterfall
monthlySold comps — $/sqft
last 12 mo · ≤1 miLoading sold comps…