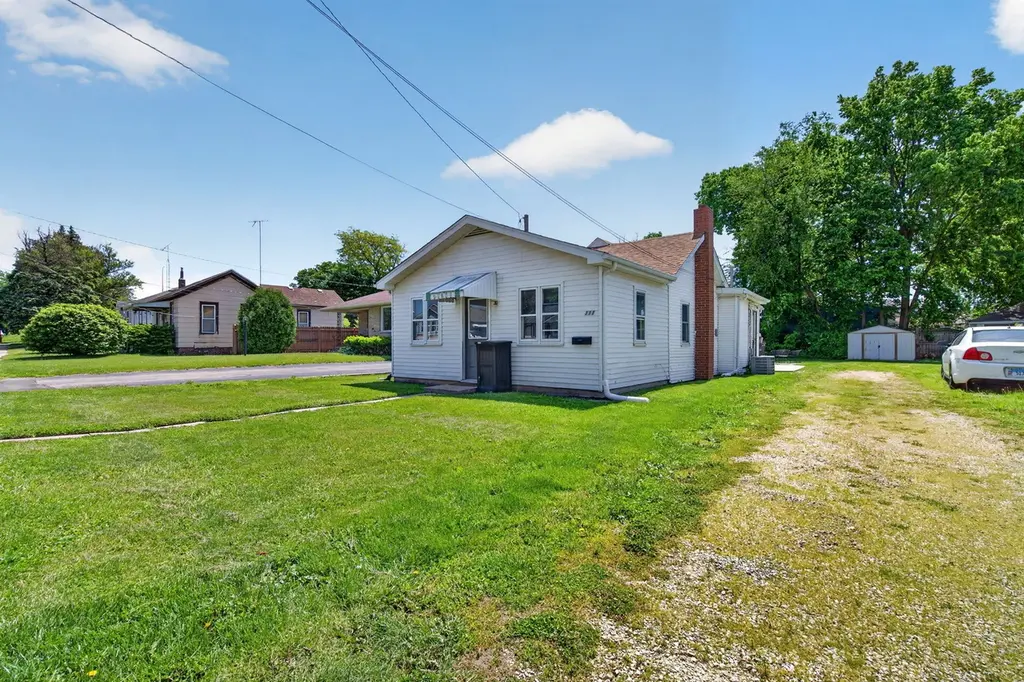
111 Buchanan St · Morris, IL
Flood risk 4/10 · Minor
- FEMA flood zone
- A
- Chance of flooding over 30 yrs
- 0.2%
- Est. flood insurance / yr
- $946 – $6,584
Fire risk 3/10 · Minor
- Est. fire insurance / yr
- $804 – $1,492
Heat risk 3/10 · Minor
- Hot days now (above 102°F)
- 7 days/yr
- Hot days in 30 yrs
- 16 days/yr
Wind risk 2/10 · Minimal
- Chance of severe wind over 30 yrs
- 1.0%
Air-quality risk 2/10 · Minimal
- Unhealthy air days now
- 1 days/yr
- Unhealthy air days in 30 yrs
- 2 days/yr
Risk factors via First Street. Map © Google.
Why this score? — see what drove the B- grade
The composite is a weighted blend of 9 inputs, each scored 0–100. Each bar is that input's sub-score; the figure is the points it added to the 100-point composite (weight × sub-score).
- Cash flow +24.7/30.0
- ARV discount +15.0/15.0
- DSCR +8.0/10.0
- 1% rule +6.5/10.0
- Livability +3.7/5.0
- Schools +2.7/10.0
- Rent growth +2.5/5.0
- Condition / age +2.5/5.0
- Appreciation +0.0/10.0
$140,000
🖨 Deal sheet (PDF) 📄 Offer letter ✓ Due diligence
Listing remarks MLS
Cheaper than rent! This adorable 2-3 bedroom ranch home is ready for you. Kitchen has ample cabinets and counter space. Nice sized dining room open to living room with French doors leading to master bedroom. Back porch/Mudroom is great for storage. Situated on a cozy street within walking distance to downtown, parks and hospital. Good sized yard with huge storage shed. All new flooring and paint. New central air unit being installed soon. New roof in 2019. Hot water heater 2021. Located just inside the flood plain, owner says they have never had water issues.
Key facts
- 8,330 sq ft lot
- 2 parking spots
- Built 1910
Property features AI
Finance
- HOA & community: No master association fee required
Exterior
- Parking: 2 parking spaces; Gravel off-street driveway (owned)
- Utilities: Public water; Public sewer
- Home design: Detached single-family home; One-story
- Construction: Vinyl siding; Over 100 years old; Built before 1978
- Exterior features: Lot approximately 49 x 170; Less than 0.25 acre; Flood zone; School bus service
Interior
- Kitchen: Kitchen (main level)
- Bedrooms: 2 bedrooms
- Flooring: Wood laminate in kitchen, dining room and laundry; Carpet in living room
- Bathrooms: 1 full bathroom
- Heating & cooling: Natural gas heating; Central air conditioning
- Interior features: 5 total rooms; Cellar basement
- Laundry & utility: Main-level laundry room (7 x 13)
Neighborhood map
What this means for you Summary
Snapshot
- This is a 3-bed/1.0-bath single-family listed at $140k.
Deal economics
- At list price, monthly cash flow is $-21 ($-254/yr) — negative.
- To cash-flow at today's rent, offer at most $136k (2.7% below list).
- Meets the 1% rule at list price ($2k rent vs $140k).
- Recommended offer: $136k (3.0% below list) — sets the bar for market timing.
- Cap rate 8.8% vs local median 3.5% in Morris — top-decile yield for the area; either an underpriced asset or a hidden risk that comps aren't pricing in. Stress-test before assuming the spread holds.
Location & tenants
- Location reads 74/100 on livability (#248 in IL, #4,532 nationally) — a middle-class / working-renter tenant base. Strengths: housing A+, health & safety A+, cost of living A; Watch: amenities F, commute F.
- Morris Chsd 101 (town): math 30% / reading 31% proficiency, ranked #230 of 620 in IL (top 37%) — families likely to look elsewhere, expect single-tenant / working-renter base with shorter leases.
- Zoned schools: White Oak Elementary (math 19% / reading 16%, grade F, #1,132 of 2,056 statewide, top 55%, 751 students, 0% FRL); Shabbona Middle School (math 18% / reading 31%, grade F, #332 of 665 statewide, top 55%, 327 students, 0% FRL); Morris Community High School (math 30% / reading 31%, grade F, #175 of 693 statewide, top 26%, 946 students, 0% FRL).
- Market conditions: 101 active listings in the ZIP; 5 comparable units currently listed for rent nearby; rentals leasing fast (median 6d on market — plan ~1-2 weeks tenant-placement turnaround); solid renter incomes; 84 units permitted in Grundy County in 2024 (0 in 5+ unit buildings).
Forward outlook
- Local home prices are declining (-3.0%/yr); year-one equity from $968 of loan paydown is wiped out by about $4k of value loss. Plan a longer hold.
- Grundy County population projected to shrink 9% by 2050 — rents likely to lag national; underwrite the cash flow, not the appreciation.
Negotiation context
- It's been on market 38 days — a 3% lower offer ($136k) is reasonable based on typical stale-listing flexibility.
- 2 sale attempts since 19y ago; this cycle's ask is 24% above the opening price — seller raised mid-cycle; expect resistance to lowballs.
- Current owner paid $108k; 29% above their basis — modest negotiation headroom, anchor on the comps not their cost.
Risks & watch-outs
- Watch-outs: flood insurance adds $314/mo; built in 1910 — expect roof / HVAC / electrical / plumbing capex.
- Climate carrying-cost: in FEMA flood zone A (mandatory federal flood insurance) — expect insurance premiums to compound above CPI over the hold.
Questions for the listing agent
- What do current leases actually rent for vs. the listed asking? Can we see a recent rent roll and the last 12 months of T-12 income?
- It's been on market 38 days. Have you received any prior offers? Is the seller open to a 3% concession, seller financing, or rate buy-down credit?
- Built in 1910 — when were the roof, HVAC, electrical panel, plumbing, and water heater last replaced?
- What's the actual annual flood-insurance premium (NFIP or private), and is the property in a SFHA with mandatory coverage?
- Is there a deadline driving the sale (1031 exchange, divorce, estate, relocation)? That informs how much negotiation room exists.
- What's the average days-on-market for RENTAL listings here right now (not sales)? A rising rental-DOM trend means longer vacancies and softer asking-rent achievability than the comps imply.
- What's the recent tenant-quality profile in this submarket — average credit score on applications, eviction rate, late-payment / NSF rate, and stable-employment percentage? A property-management company in the area should have these aggregated.
- How much new for-sale + rental construction is in the pipeline within 1–3 miles? Heavy new supply typically softens prices + rents 12–24 months out; constrained supply supports both.
Investment metrics
- 1% rule
- 1.15% ✓
- Cap rate
- 8.80%
- Cash-on-cash
- 8.96%
- DSCR
- 1.40
- GRM
- 7.3
CMA / ARV
- ARV (on-the-fly)
- $216,000
- Comps found
- 12
Show comp detail 12 sales within ~0.75 mi
| Address | Dist | Beds/Ba | Sqft | Sold | Price | $/sf | Match |
|---|---|---|---|---|---|---|---|
| 1208 Butler St | 0.21mi | 2/1.0 (-1) | 1,000 (0%) | 6mo | $226,000 | $226 | 80 |
| 329 Robinson Dr | 0.43mi | 3/1.0 | 1,000 (0%) | 1mo | $183,000 | $183 | 79 |
| 513 West Ave | 0.47mi | 3/1.0 | 1,000 (0%) | 8mo | $257,500 | $258 | 71 |
| 744 E Benton St | 0.46mi | 3/1.0 | 1,040 (+4%) | 3mo | $227,250 | $219 | 69 |
| 327 Robinson Dr | 0.44mi | 3/1.0 | 1,040 (+4%) | 8mo | $225,000 | $216 | 66 |
| 1429 Water St | 0.53mi | 3/1.0 | 1,040 (+4%) | 4mo | $222,000 | $213 | 65 |
| 1238 Wauponsee St | 0.21mi | 4/1.5 (+1) | 1,120 (+12%) | 1mo | $239,900 | $214 | 63 |
| 740 E Jackson St | 0.56mi | 2/1.0 (-1) | 1,064 (+6%) | 6mo | $229,500 | $216 | 53 |
| 816 2nd Ave | 0.54mi | 3/1.5 | 876 (-12%) | 1mo | $213,000 | $243 | 51 |
| 831 Douglas St | 0.58mi | 2/1.0 (-1) | 1,100 (+10%) | 2mo | $201,000 | $183 | 50 |
| 1252 Park Blvd | 0.71mi | 3/1.0 | 1,092 (+9%) | 4mo | $227,000 | $208 | 48 |
| 509 E Jefferson St | 0.52mi | 3/1.5 | 1,144 (+14%) | 8mo | $210,786 | $184 | 43 |
Match score weights: distance 35% · size 25% · config 20% · recency 20%. Top-matched comps best support the ARV.
Projected returns pro-forma
-3.0% appreciation · 3.0% rent growth · sell at horizon
- IRR
- -17.2%
- Equity multiple
- 0.39×
- Total profit
- $-23,811
- Equity at exit
- $20,874
- IRR
- -8.8%
- Equity multiple
- 0.45×
- Total profit
- $-21,568
- Equity at exit
- $12,105
Cash invested: $39,200 (down + closing). Projections, not guarantees.
Landlord ↔ Tenant lean methodology
- Overall (STATE)
- 43 Moderately Tenant-Leaning
- State Illinois
- 43 Moderately Tenant-Leaning · D+7
- County
- — inherits STATE
- City
- — inherits STATE
ZIP-level market 60450
- Active inventory
- 101
- Price-to-rent
- 7.3×
Monthly cashflow live
- Estimated rent
- $1,605 high interval (Pro) →
- Mortgage (P&I)
- −$734
- Tax from tax record
- −$183 /mo · $2,198/yr
- Insurance
- −$58
- Flood insurance flood zone
- −$314 /mo · $3,765/yr
- HOA
- −$0
- Vacancy / Maint / Mgmt
- −$337
- Net cashflow
- $-21
Break-even live
Sensitivity live
| Price | -10% $58 | -5% $18 | +0% $-21 | +5% $-61 | +10% $-100 |
|---|---|---|---|---|---|
| Rent | -10% $-148 | -5% $-85 | +0% $-21 | +5% $42 | +10% $106 |
| Rate | -1.0pp $49 | -0.5pp $14 | base $-21 | +0.5pp $-57 | +1.0pp $-94 |
UW: 25.0% down · 7.5% · 30yr · 1.5% tax · 5.0% vac · 8.0% maint · 8.0% mgmt
Financing live
Cash to close
- Down payment
- $35,000
- Closing costs
- $4,200
- Reserves months
- —
- Total cash needed
- —
Loan-product check · same deal, 3 products live
Conventional
25% down · 7.5% · 30yr
- Down + closing
- —
- Monthly P&I
- —
- Monthly cashflow
- —
- DSCR
- —
- Eligible?
- —
Personal DTI + credit; lowest rate.
DSCR
20% down · 8.5% · 30yr
- Down + closing
- —
- Monthly P&I
- —
- Monthly cashflow
- —
- DSCR
- —
- Eligible?
- —
No personal income docs; deal must DSCR.
Hard money
10% down · 12.0% · 12mo
- Down + closing
- —
- Monthly P&I
- —
- Monthly cashflow
- —
- DSCR
- —
- Eligible?
- —
Short-term bridge; refi at stabilization.
Rent comps 5 comps
| Address | Beds | Baths | Sqft | Rent | $/sqft | DOM | Units | Dist |
|---|---|---|---|---|---|---|---|---|
| 416 1/2 W Jackson St Morris, IL | 3.0 | 1.0 | 1230 | $1,600 | $1.30 | 20d | 1 | 0.46mi |
| 714 E Jackson St Unit 1 Morris, IL | 2.0 | 1.0 | 868 | $1,700 | $1.96 | 0d | 1 | 0.56mi |
| 241 Ottawa Bend Dr Morris, IL | 2.0 | 1.0 | 900 | $1,425 | $1.58 | 17d | 1 | 0.93mi |
| 2405 Ashland Cir Morris, IL | 2.0 | 1.0 | 900 | $1,400 | $1.56 | 0d | 1 | 1.21mi |
| 2405 Ashland Cir Unit 9 Morris, IL | 2.0 | 1.0 | 900 | $1,400 | $1.56 | 5d | 1 | 1.21mi |
Listing history 8 events
-
2026-06-22days on market $140,000 Contingent - Continue to Show 38 DOM
-
2026-06-22status $140,000 Contingent - Continue to Show 37 DOM
-
2026-06-21days on market $140,000 Active 37 DOM
-
2026-06-18days on market $140,000 Active 34 DOM
-
2026-06-17days on market $140,000 Active 33 DOM
-
2026-06-16days on market $140,000 Active 32 DOM
-
2026-06-16remarks 515-char remark
-
2026-06-16$140,000 Active 31 DOM
ⓘ Source: listings_history table (triggers on properties + properties_extension) + one-shot
backfill from property_details.listing_events for pre-trigger history.
Tax reassessment forecast IL · Partial reset (capped growth)
- Current annual tax
- $2,198 · $183/mo
- Projected year-2 tax
- $2,688 · $224/mo
- Expected delta
- +$490/yr (+$41/mo · 22.3%)
ⓘ Screening estimate from a state-policy table — verify with the county assessor before closing.
Climate risk First Street
- Flood 4/10 Moderate FEMA zone A · 20% chance over 30 yrs
- Wildfire 3/10 Moderate
- Heat 3/10 Moderate 7 d/yr ≥102°F today · 16 d/yr by 30 yrs out
- Wind 2/10 Low 100% chance of damaging wind over 30 yrs
- Air quality 2/10 Low 1 unhealthy d/yr today · 2 by 30 yrs out
Nearby sold comps map
Loading sold comps map…
Walkable amenities ~0.75 mi
Loading nearby amenities…
Taxation est. · year 1
- Rental income
- $19,264
- − Mortgage interest
- −$7,842
- − Property taxes
- −$2,198
- − Insurance
- −$4,465
- − Repairs & maintenance
- −$1,541
- − Management
- −$1,541
- − Depreciation
- −$4,073
- Taxable loss
- −$2,395
- Est. tax savings @ 24.0%
- +$575
- After-tax cash flow
- $321/yr
For passive investors: Depreciation is non-cash, so a rental often shows a tax loss while cash-flowing — sheltering income. Rental losses are passive: they offset passive income freely, and up to $25,000/yr can offset ordinary (W-2) income if you actively participate and your MAGI is under $100k (phasing out to $0 by $150k); unused losses carry forward. On sale, claimed depreciation is recaptured at up to 25%, and gains may owe capital-gains tax (a 1031 exchange can defer both). Figures are a year-1 estimate at your 24.0% rate — not tax advice; consult a CPA.
Schools (NCES district)
- District
- Morris Chsd 101
- NCES district ID
- 1726640
- Math proficiency
- 30% ▼ -12.00%
- Reading proficiency
- 31% ▼ -6.00%
- Median HH income
- $57,178
- Composite
- 27.31/100
- National rank
- #6995
- State rank
- #230 of 620 in IL
Livability — Morris
- Score
- 74/100
- State rank
- #248
- US rank
- #4532
Category grades
Schools grade is shown separately in the Schools card above.
Census & demographics
- Census place
- Morris, IL
- County
- Grundy County · 20,783 people
- City population
- 20,783
- Metro
- Chicago-Naperville-Elgin, IL-IN-WI
- Population (ZIP)
- 20,783
- Household income
- $81,777
- Rent vs Own
- Severe rent burden
- 722.0
Population outlook (Grundy County) Hauer SSP2
- Today (2025)
- 50,716 people
- By 2030
- 50,218 · -1.0%
- By 2040
- 48,599 · -4.2%
- By 2050
- 46,212 · -8.9%
- By 2075
- 40,033 · -21.1%
- By 2100
- 32,966 · -35.0%
Race, ethnicity, and origin ACS 2023
- Neighborhood character
- Predominantly White (85%)
- Race & ethnicity
- White 85% Hispanic / Latino 9% Two or more races 7% Black 2%
- Hispanic origin (detail)
- Mexican 8%
- Common ancestry
- Portuguese 10% Romanian 7% Iranian 2%
- Foreign-born
- 4% · Canada
- Languages at home
- 91% English-only · Spanish 6% Tagalog/Filipino 1% Other Indo-European 1%
Political lean MEDSL · Grundy
- 2024 margin
- Strong R (+29.6) · D 34.5% · R 64.0% · Other 1.5%
- 2008→2024 swing
- -31.3pp toward R · 2008: 1.7pp · 2024: -29.6pp
- All cycles
- 2024: R+29.6 2020: R+25.8 2016: R+23.6 2012: R+9.0 2008: D+1.7
Not yet ingested
- Civics
- —
Market trends
- HPI YoY
- ▼ -144.59%
- Current HPI
- 159.5402
- Rent YoY
- —
- Metro
- Chicago-Naperville-Elgin, IL-IN-WI
- State GDP YoY
- ▲ 1.59%
- F500 in state
- 60
Industry mix (Fortune 500 HQ in IL)
| Industry | F500 HQs | Revenue |
|---|---|---|
| Insurance | 4 | $201B |
|
||
| Consumer Goods | 4 | $87B |
|
||
| Industrial Machinery | 3 | $64B |
|
||
| Healthcare | 2 | $55B |
|
||
| Retail / Pharmacy | 1 | $148B |
|
||
| Agriculture / Food | 1 | $86B |
|
||
Price history
-9.7% since first listed8 events — show timeline
- 2021-10-01 Sold (Public Records) $108,411 Public Records
- 2021-09-28 Pending — MRED as Distributed by MLS Grid
- 2021-09-27 Sold (MLS) $108,411 MRED as Distributed by MLS Grid
- 2021-08-31 Pending — MRED as Distributed by MLS Grid
- 2021-08-26 Listed $112,900 MRED as Distributed by MLS Grid
- 2008-01-28 Listing Removed — MRED as Distributed by MLS Grid
- 2007-08-17 Listed — MRED as Distributed by MLS Grid
- 2005-10-27 Sold (Public Records) $120,000 Public Records
Property tax history
+2.2%/yrLatest (2024): $2,198 · +7.3% YoY. Source: county tax records.
Cash-flow waterfall
monthlySold comps — $/sqft
last 12 mo · ≤1 miLoading sold comps…