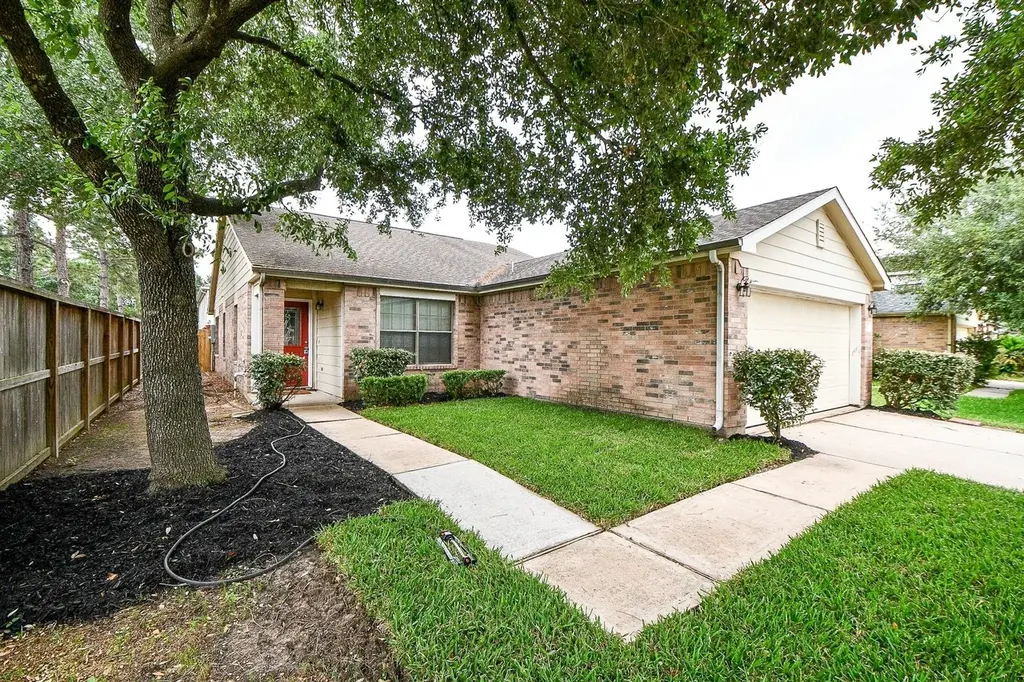
29530 Legends Glen Dr · Houston, TX
Flood risk 1/10 · Minimal
- FEMA flood zone
- X (unshaded)
- Chance of flooding over 30 yrs
- 0.0%
- Est. flood insurance / yr
- $507 – $1,088
Fire risk 4/10 · Minor
- Est. fire insurance / yr
- $1,222 – $2,270
Heat risk 9/10 · Severe
- Hot days now (above 110°F)
- 7 days/yr
- Hot days in 30 yrs
- 25 days/yr
Wind risk 8/10 · Major
- Chance of severe wind over 30 yrs
- 99.0%
Air-quality risk 3/10 · Minor
- Unhealthy air days now
- 3 days/yr
- Unhealthy air days in 30 yrs
- 3 days/yr
Risk factors via First Street. Map © Google.
Why this score? — see what drove the D- grade
The composite is a weighted blend of 9 inputs, each scored 0–100. Each bar is that input's sub-score; the figure is the points it added to the 100-point composite (weight × sub-score).
- ARV discount +9.3/15.0
- Cash flow +8.5/30.0
- Schools +5.1/10.0
- 1% rule +3.8/10.0
- Livability +3.7/5.0
- Rent growth +2.8/5.0
- Condition / age +2.5/5.0
- DSCR +2.3/10.0
- Appreciation +0.0/10.0
$244,500
🖨 Deal sheet (PDF) 📄 Offer letter ✓ Due diligence
Listing remarks
Welcome to the perfect home on a desirable corner lot! This charming 3-bedroom residence offers fresh updates and a bright, comfortable layout ideal for everyday living. Enjoy brand-new carpet in all bedrooms and a spacious living room filled with natural light. The kitchen and dining combo features a stylish tile backsplash, ample cabinet storage, and a convenient breakfast bar, creating a functional space for cooking, gathering, and entertaining. The primary suite includes a walk-in closet, while the secondary bedrooms offer generous space for family, guests, or a home office. Step outside to a covered patio overlooking a large backyard—perfect for relaxing, playtime, or hosting out
Key facts
- Walk-in closet
- Natural light
- Covered patio
Tags
Property features AI
Finance
- Other: Municipal utility district disclosure; Seller disclosure
- HOA & community: HOA managed by RealManage; HOA fee $500 annually
Exterior
- Parking: Attached garage; 2-car garage
- Security: Smoke detector(s)
- Utilities: Public water; Public sewer
- Home design: Residential property; Slab foundation; Composition roof; Built in 2006
- Construction: Brick construction
- Exterior features: Deck; Patio; Fenced backyard; Subdivision lot
Interior
- Kitchen: Dishwasher; Disposal; Gas oven; Gas range
- Bedrooms: 5 total rooms
- Flooring: Carpet; Plank; Vinyl
- Bathrooms: 2 full bathrooms
- Heating & cooling: Central heating (gas); Central air (electric); Programmable thermostat
- Interior features: Breakfast bar; Pantry; Tub with shower; Kitchen/dining combo; Programmable thermostat
- Laundry & utility: Washer hookup; Electric dryer hookup
Neighborhood map
What this means for you Summary
Snapshot
- This is a 3-bed/2.0-bath single-family listed at $244k.
Deal economics
- At list price, monthly cash flow is $-214 ($-3k/yr) — negative.
- To cash-flow at today's rent, offer at most $207k (15.5% below list).
- To meet the 1% rule (rent ≥ 1% of price), the offer needs to be $216k (11.9% below list).
- Recommended offer: $207k (15.5% below list) — sets the bar for cash-flow.
- Cap rate 5.2% vs local median 3.2% in Houston — top-decile yield for the area; either an underpriced asset or a hidden risk that comps aren't pricing in. Stress-test before assuming the spread holds.
Location & tenants
- Location reads 74/100 on livability (#184 in TX, #4,771 nationally) — a middle-class / working-renter tenant base. Strengths: amenities A+, cost of living A+, housing A+; Watch: crime F.
- Conroe ISD (other): math 57% / reading 57% proficiency, ranked #69 of 826 in TX (top 8%) — acceptable for families but not a draw, mixed tenant base, ~2y average lease.
- Zoned schools: Snyder El (math 70% / reading 73%, grade A-, #117 of 4,322 statewide, top 3%, 1,324 students, 11% FRL); York J H (math 71% / reading 65%, grade A-, #73 of 1,662 statewide, top 5%, 2,015 students, 22% FRL); Conroe H S (math 32% / reading 51%, grade F, #767 of 1,632 statewide, top 47%, 4,915 students, 61% FRL) — zoned schools at 32% FRL track the district average.
- Market conditions: Rents rising (+1.4%/yr); 747 active listings in the ZIP; 23 comparable units currently listed for rent nearby; rentals at typical pace (median 22d on market — plan ~3-4 weeks tenant-placement turnaround); high-income renter base; 13,259 units permitted in Montgomery County in 2024 (1,402 in 5+ unit buildings).
Forward outlook
- Local home prices are declining (-3.0%/yr); year-one equity from $2k of loan paydown is wiped out by about $7k of value loss. Plan a longer hold.
- Montgomery County population projected at +65% by 2050 — long-run rental-demand tailwind backs the buy-and-hold thesis.
Negotiation context
- It's been on market 18 days — a 2% lower offer ($241k) is reasonable based on typical stale-listing flexibility.
- 2 sale attempts with the ask held roughly flat each time — persistent listings suggest the price (not the market) is what's stuck; bring a comps-based counter.
Risks & watch-outs
- Climate carrying-cost: severe wind risk, 99% chance of damaging wind over 30y; extreme-heat days projected 7→25/yr by 2055 (HVAC capex compounding) — expect insurance premiums to compound above CPI over the hold.
Questions for the listing agent
- What do current leases actually rent for vs. the listed asking? Can we see a recent rent roll and the last 12 months of T-12 income?
- What does the HOA fee cover, when was the last increase, and are there any pending special assessments or reserve-fund shortfalls?
- Is there a deadline driving the sale (1031 exchange, divorce, estate, relocation)? That informs how much negotiation room exists.
- Schools are D-rated, which usually means shorter tenancies and higher turnover. Who's the typical renter profile here, and what's been the actual vacancy rate?
- Crime grade is F in this area — have there been break-ins, vandalism, or insurance claims at this property in the last 3 years? What carrier currently insures it and at what premium?
- The area grade is low — what's the realistic commute time and amenity access for the typical tenant pool here? Any planned neighborhood developments (good or bad) we should know about?
- What's the average days-on-market for RENTAL listings here right now (not sales)? A rising rental-DOM trend means longer vacancies and softer asking-rent achievability than the comps imply.
- What's the recent tenant-quality profile in this submarket — average credit score on applications, eviction rate, late-payment / NSF rate, and stable-employment percentage? A property-management company in the area should have these aggregated.
- How much new for-sale + rental construction is in the pipeline within 1–3 miles? Heavy new supply typically softens prices + rents 12–24 months out; constrained supply supports both.
Investment metrics
- 1% rule
- 0.88% ✗
- Cap rate
- 5.24%
- Cash-on-cash
- -3.75%
- DSCR
- 0.83
- GRM
- 9.5
CMA / ARV
- ARV (median comp)
- $254,520
- List price
- $244,500
- Delta
- -1.97%
- Verdict
- FAIR
- Comps
- 20 within 1.0 mi
Show comp detail 12 sales within ~0.75 mi
| Address | Dist | Beds/Ba | Sqft | Sold | Price | $/sf | Match |
|---|---|---|---|---|---|---|---|
| 3315 Legends Landing Dr | 0.14mi | 3/2.0 | 1,563 (-1%) | 5mo | $267,000 | $171 | 88 |
| 3314 Legends Shadow Dr | 0.13mi | 3/2.0 | 1,563 (-1%) | 8mo | $249,000 | $159 | 86 |
| 3310 Legends Wild Dr | 0.30mi | 4/2.0 (+1) | 1,575 (0%) | 1mo | $244,900 | $155 | 80 |
| 29703 Meridian Hill Dr | 0.41mi | 3/2.0 | 1,618 (+3%) | 2mo | $262,500 | $162 | 75 |
| 3522 Fuller Bluff Dr | 0.24mi | 3/2.5 | 1,631 (+4%) | 7mo | $249,900 | $153 | 75 |
| 29507 Evergreen Hills Dr | 0.13mi | 3/2.5 | 1,431 (-9%) | 4mo | $176,000 | $123 | 73 |
| 29257 Legends Worth Dr | 0.39mi | 3/2.0 | 1,659 (+5%) | 2mo | $229,000 | $138 | 71 |
| 29551 N Legends Bend Dr | 0.33mi | 3/2.5 | 1,723 (+9%) | 0mo | $269,000 | $156 | 66 |
| 3118 Dunsmore Manor Ct | 0.75mi | 3/2.0 | 1,604 (+2%) | 1mo | $295,000 | $184 | 61 |
| 30318 Mesa Valley Dr | 0.65mi | 3/2.0 | 1,799 (+14%) | 2mo | $292,000 | $162 | 45 |
| 29887 Woodsons Edge Way | 0.73mi | 3/2.0 | 1,749 (+11%) | 5mo | $320,000 | $183 | 44 |
| 29511 Water Willow Trace Dr | 0.69mi | 3/2.0 | 1,807 (+15%) | 1mo | $345,000 | $191 | 43 |
Match score weights: distance 35% · size 25% · config 20% · recency 20%. Top-matched comps best support the ARV.
Projected returns pro-forma
-3.0% appreciation · 1.35% rent growth · sell at horizon
- IRR
- -24.7%
- Equity multiple
- 0.17×
- Total profit
- $-56,608
- Equity at exit
- $36,456
- IRR
- -26.7%
- Equity multiple
- -0.17×
- Total profit
- $-80,132
- Equity at exit
- $21,140
Cash invested: $68,460 (down + closing). Projections, not guarantees.
Landlord ↔ Tenant lean methodology
- Overall (STATE)
- 87 Strongly Landlord-Friendly
- State Texas
- 87 Strongly Landlord-Friendly · R+5
- County
- — inherits STATE
- City
- — inherits STATE
ZIP-level market 77386
- Home prices YoY
- -13.6%
- Rents YoY
- 1.4%
- Active inventory
- 747
- Price-to-rent
- 9.5×
Monthly cashflow live
- Estimated rent
- $2,155 high interval (Pro) →
- Mortgage (P&I)
- −$1,282
- Tax from tax record
- −$491 /mo · $5,887/yr
- Insurance
- −$102
- HOA
- −$42
- Lot rent
- −$0
- Vacancy / Maint / Mgmt
- −$453
- Net cashflow
- $-214
Break-even live
Sensitivity live
| Price | -10% $-76 | -5% $-145 | +0% $-214 | +5% $-283 | +10% $-353 |
|---|---|---|---|---|---|
| Rent | -10% $-384 | -5% $-299 | +0% $-214 | +5% $-129 | +10% $-44 |
| Rate | -1.0pp $-91 | -0.5pp $-152 | base $-214 | +0.5pp $-278 | +1.0pp $-342 |
UW: 25.0% down · 7.5% · 30yr · 1.5% tax · 5.0% vac · 8.0% maint · 8.0% mgmt
Financing live
Cash to close
- Down payment
- $61,125
- Closing costs
- $7,335
- Reserves months
- —
- Total cash needed
- —
Loan-product check · same deal, 3 products live
Conventional
25% down · 7.5% · 30yr
- Down + closing
- —
- Monthly P&I
- —
- Monthly cashflow
- —
- DSCR
- —
- Eligible?
- —
Personal DTI + credit; lowest rate.
DSCR
20% down · 8.5% · 30yr
- Down + closing
- —
- Monthly P&I
- —
- Monthly cashflow
- —
- DSCR
- —
- Eligible?
- —
No personal income docs; deal must DSCR.
Hard money
10% down · 12.0% · 12mo
- Down + closing
- —
- Monthly P&I
- —
- Monthly cashflow
- —
- DSCR
- —
- Eligible?
- —
Short-term bridge; refi at stabilization.
Rent comps 23 comps
| Address | Beds | Baths | Sqft | Rent | $/sqft | DOM | Units | Dist |
|---|---|---|---|---|---|---|---|---|
| 29735 Legends Green Dr Spring, TX | 3.0 | 2.0 | 2180 | $3,300 | $1.51 | 27d | 1 | 0.13mi |
| 29635 Evergreen Hills Dr Spring, TX | 3.0 | 2.5 | 1433 | $1,836 | $1.28 | 1d | 1 | 0.14mi |
| 29311 Legends Hill Dr Spring, TX | 3.0 | 2.0 | 1768 | $1,901 | $1.08 | 1d | 1 | 0.20mi |
| 3543 Garrison Run Dr Spring, TX | 3.0 | 2.0 | 1400 | $1,636 | $1.17 | 27d | 1 | 0.22mi |
| 29726 Sullivan Oaks Dr Spring, TX | 3.0 | 3.0 | 1410 | $1,725 | $1.22 | 46d | 1 | 0.42mi |
| 3506 Cactus Creek Dr Spring, TX | 3.0 | 3.0 | 2000 | $1,950 | $0.97 | 46d | 1 | 0.44mi |
| 29418 Fox River Dr Spring, TX | 3.0 | 2.0 | 1907 | $1,779 | $0.93 | 5d | 1 | 0.53mi |
| 2815 Fox Mountain Dr Spring, TX | 3.0 | 2.0 | 1556 | $1,875 | $1.21 | 6d | 1 | 0.57mi |
| 29307 Atherstone St Spring, TX | 3.0 | 2.0 | 1764 | $1,745 | $0.99 | 24d | 1 | 0.70mi |
| 2625 Harmony Park Xing Unit 2658 Spring, TX | 3.0 | 2.0 | 1408 | $1,949 | $1.38 | 13d | 1 | 1.02mi |
| 2625 Harmony Park Xing Unit 3228 Spring, TX | 3.0 | 2.0 | 1408 | $1,960 | $1.39 | 0d | 1 | 1.02mi |
| 4506 Nueces River Loop Spring, TX | 3.0 | 2.0 | 1110 | $1,601 | $1.44 | 21d | 1 | 1.06mi |
| 2530 Fox River Ln Spring, TX | 3.0 | 2.0 | 1556 | $1,900 | $1.22 | 46d | 1 | 1.06mi |
| 3640 Harmony Commons Dr Spring, TX | 1.0–2.0 | 1.0–2.0 | 843 | $2,824 | $3.35 | 1d | 23 | 1.07mi |
| 3559 Discovery Creek Blvd Spring, TX | 2.0 | 2.0 | 1086 | $1,305 | $1.20 | 46d | 1 | 1.11mi |
| 3536 Discovery Creek Blvd Spring, TX | 2.0 | 2.0 | 1086 | $1,570 | $1.45 | 46d | 1 | 1.12mi |
| 3530 Discovery Creek Blvd Spring, TX | 1.0–3.0 | 1.0–2.0 | 1048 | $2,018 | $1.92 | 1d | 22 | 1.16mi |
| 2237 Riley Fuzzel Rd Spring, TX | 1.0–3.0 | 1.0–2.0 | 1084 | $2,435 | $2.25 | 1d | 34 | 1.16mi |
| 3323 Orchid Trace Dr Spring, TX | 3.0 | 2.0 | 2180 | $1,200 | $0.55 | 1d | 1 | 1.17mi |
| 28325 Birnham Woods Dr Spring, TX | 2.0–4.0 | 2.5–3.5 | 1397 | $2,566 | $1.84 | 1d | 14 | 1.36mi |
| 28328 Birnham Woods Dr Spring, TX | 4.0 | 4.0 | 1554 | $2,495 | $1.61 | 46d | 1 | 1.40mi |
| 2011 Rycroft Dr Spring, TX | 3.0 | 3.0 | 1700 | $1,949 | $1.15 | 22d | 1 | 1.41mi |
| 3122 Crescent Oaks Park Ln Spring, TX | 3.0 | 2.0 | 1745 | $2,100 | $1.20 | 24d | 1 | 1.43mi |
HOA detail
- Monthly dues
- $42 · $504/yr
Listing history 17 events
-
2026-06-22days on market $244,500 Active 18 DOM
-
2026-06-21days on market $244,500 Active 17 DOM
-
2026-06-18days on market $244,500 Active 14 DOM
-
2026-06-17remarks 693-char remark
-
2026-06-17days on market $244,500 Active 13 DOM
-
2026-06-16days on market $244,500 Active 12 DOM
-
2026-06-15days on market $244,500 Active 11 DOM
-
2026-06-13days on market $244,500 Active 9 DOM
-
2026-06-09days on market $244,500 Active 5 DOM
-
2026-06-08days on market $244,500 Active 4 DOM
-
2026-06-07pricedays on market $244,500 Active 3 DOM
-
2026-06-04days on market $249,500 Active 35 DOM
-
2026-06-03days on market $249,500 Active 34 DOM
-
2026-06-02days on market $249,500 Active 33 DOM
-
2026-06-01days on market $249,500 Active 32 DOM
-
2026-05-31days on market $249,500 Active 31 DOM
-
2026-04-30$249,500 Active 639-char remark
ⓘ Source: listings_history table (triggers on properties + properties_extension) + one-shot
backfill from property_details.listing_events for pre-trigger history.
Tax reassessment forecast TX · Resets to sale price
- Current annual tax
- $5,887 · $491/mo
- Projected year-2 tax
- $5,887 · $491/mo
- Expected delta
- $0/yr ($0/mo · 0.0%)
ⓘ Screening estimate from a state-policy table — verify with the county assessor before closing.
Climate risk First Street
- Flood 1/10 Low FEMA zone X (unshaded) · 0% chance over 30 yrs
- Wildfire 4/10 Moderate
- Heat 9/10 Extreme 7 d/yr ≥110°F today · 25 d/yr by 30 yrs out
- Wind 8/10 Severe 99% chance of damaging wind over 30 yrs
- Air quality 3/10 Moderate 3 unhealthy d/yr today · 3 by 30 yrs out
Nearby sold comps map
Loading sold comps map…
Walkable amenities ~0.75 mi
Loading nearby amenities…
Taxation est. · year 1
- Rental income
- $25,860
- − Mortgage interest
- −$13,696
- − Property taxes
- −$5,887
- − Insurance
- −$1,222
- − Repairs & maintenance
- −$2,069
- − Management
- −$2,069
- − HOA
- −$504
- − Depreciation
- −$7,113
- Taxable loss
- −$6,699
- Est. tax savings @ 24.0%
- +$1,608
- After-tax cash flow
- $-962/yr
For passive investors: Depreciation is non-cash, so a rental often shows a tax loss while cash-flowing — sheltering income. Rental losses are passive: they offset passive income freely, and up to $25,000/yr can offset ordinary (W-2) income if you actively participate and your MAGI is under $100k (phasing out to $0 by $150k); unused losses carry forward. On sale, claimed depreciation is recaptured at up to 25%, and gains may owe capital-gains tax (a 1031 exchange can defer both). Figures are a year-1 estimate at your 24.0% rate — not tax advice; consult a CPA.
Schools (NCES district)
- District
- Conroe ISD
- NCES district ID
- 4815000
- Math proficiency
- 57% ▼ -6.00%
- Reading proficiency
- 57% ▼ -1.00%
- Median HH income
- $71,541
- Composite
- 50.65/100
- National rank
- #1833
- State rank
- #69 of 826 in TX
Livability — Houston
- Score
- 74/100
- State rank
- #184
- US rank
- #4771
Category grades
Schools grade is shown separately in the Schools card above.
Census & demographics
- County
- Montgomery County · 663,713 people
- City population
- 3,226,434
- Metro
- Houston-The Woodlands-Sugar Land, TX
- Population (ZIP)
- 69,980
- Household income
- $132,469
- Rent vs Own
- Severe rent burden
- 1115.0
Population outlook (Montgomery County) Hauer SSP2
- Today (2025)
- 713,896 people
- By 2030
- 805,263 · +12.8%
- By 2040
- 992,708 · +39.1%
- By 2050
- 1,179,590 · +65.2%
- By 2075
- 1,628,084 · +128.1%
- By 2100
- 1,937,880 · +171.5%
Race, ethnicity, and origin ACS 2023
- Neighborhood character
- Diverse neighborhood (Simpson 0.61)
- Race & ethnicity
- White 58% Hispanic / Latino 22% Two or more races 14% Black 9% Asian 6%
- Hispanic origin (detail)
- Mexican 11% Cuban 1%
- Common ancestry
- Lithuanian 4% Romanian 2% Slovak 2%
- Foreign-born
- 15% · Canada, China, South Korea
- Languages at home
- 79% English-only · Spanish 12% Other Indo-European 3% Russian/Polish/Slavic 1%
Political lean MEDSL · Montgomery
- 2024 margin
- Solid R (+45.5) · D 26.8% · R 72.3%
- 2008→2024 swing
- +7.2pp toward D · 2008: -52.7pp · 2024: -45.5pp
- All cycles
- 2024: R+45.5 2020: R+43.8 2016: R+51.4 2012: R+60.7 2008: R+52.7
Not yet ingested
- Civics
- —
Market trends
- HPI YoY
- ▼ -35.74%
- Current HPI
- 226.3729
- Rent YoY
- ▲ 1.35%
- Metro
- Houston-The Woodlands-Sugar Land, TX
- State GDP YoY
- ▲ 3.95%
- F500 in state
- 110
Industry mix (Fortune 500 HQ in TX)
| Industry | F500 HQs | Revenue |
|---|---|---|
| Energy | 16 | $1,198B |
|
||
| Technology | 5 | $198B |
|
||
| Engineering / Construction | 4 | $72B |
|
||
| Energy Services | 3 | $60B |
|
||
| Utilities | 3 | $41B |
|
||
| Healthcare | 2 | $330B |
|
||
Price history
-2.0% since first listed3 events — show timeline
- 2026-06-04 Listed $244,500 HARMLS
- 2026-06-04 Listing Removed — HARMLS
- 2026-04-30 Listed $249,500 HARMLS
Property tax history
+3.5%/yrLatest (2025): $5,887 · -0.4% YoY. Source: county tax records.
Cash-flow waterfall
monthlySold comps — $/sqft
last 12 mo · ≤1 miLoading sold comps…