 Multi-family
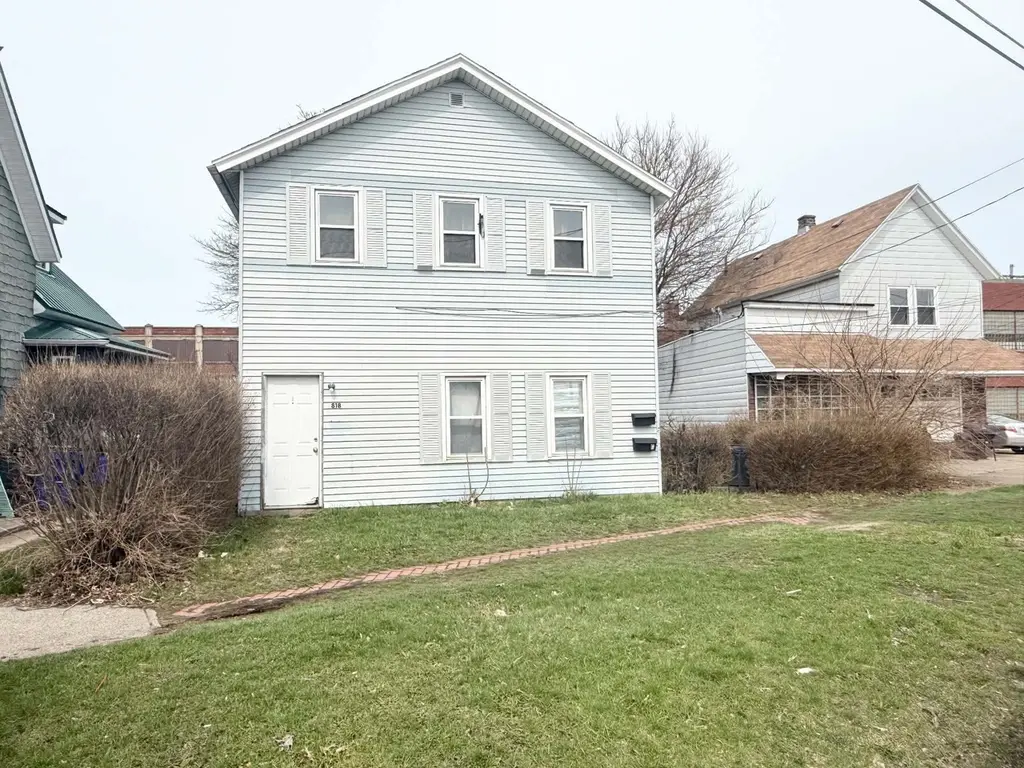
818 Brown Ave · Erie, PA
Flood risk 1/10 · Minimal
- FEMA flood zone
- X (unshaded)
- Chance of flooding over 30 yrs
- 0.0%
- Est. flood insurance / yr
- $473 – $860
Fire risk 1/10 · Minimal
- Est. fire insurance / yr
- $511 – $949
Heat risk 3/10 · Minor
- Hot days now (above 90°F)
- 7 days/yr
- Hot days in 30 yrs
- 17 days/yr
Wind risk 1/10 · Minimal
- Chance of severe wind over 30 yrs
- —
Air-quality risk 2/10 · Minimal
- Unhealthy air days now
- 1 days/yr
- Unhealthy air days in 30 yrs
- 3 days/yr
Risk factors via First Street. Map © Google.
Why this score? — see what drove the B- grade
The composite is a weighted blend of 9 inputs, each scored 0–100. Each bar is that input's sub-score; the figure is the points it added to the 100-point composite (weight × sub-score).
- Cash flow +30.0/30.0
- 1% rule +10.0/10.0
- DSCR +10.0/10.0
- ARV discount +6.9/15.0
- Livability +4.2/5.0
- Rent growth +3.2/5.0
- Condition / age +2.5/5.0
- Schools +1.3/10.0
- Appreciation +0.0/10.0
$114,900
🖨 Deal sheet (PDF) 📄 Offer letter ✓ Due diligence
Multi-family units
County records classify this as Multi-Family (2-4 Unit). Listing-text estimate: 1 unit. estimate disagrees with records
Listing remarks MLS
Newer Roof, Updated Windows with guarantee, and a newer furnace for lower level. Spacious multi-family property offering 5 bedrooms and 3 bathrooms across approximately 2,040 square feet, providing strong potential for both owner-occupants and investors. Built in 1873, this property blends classic character with functional living space and sits on a manageable city lot. With multiple units and solid rental potential, this is a great opportunity to generate income, expand your investment portfolio, or owner occupy.
Key facts
- 3,210 sq ft lot
- Built 1873
- Listed 88 days
Neighborhood map
What this means for you Summary
Snapshot
- This is a 5-bed/3.0-bath multifamily listed at $115k.
Deal economics
- At list price, monthly cash flow is $3k ($35k/yr) — positive.
- The deal already cash-flows at list — no discount required.
- Meets the 1% rule at list price ($5k rent vs $115k).
- Recommended offer: $108k (6.0% below list) — sets the bar for market timing.
- Cap rate 36.4% vs local median 5.1% in Erie — top-decile yield for the area; either an underpriced asset or a hidden risk that comps aren't pricing in. Stress-test before assuming the spread holds.
Location & tenants
- Location reads 83/100 on livability (#109 in PA, #840 nationally) — a professional / high-income tenant draw. Strengths: amenities A+, commute A+, cost of living A+; Watch: crime D+, employment F.
- Erie City SD (urban): math 12% / reading 19% proficiency, ranked #510 of 539 in PA (top 95%) — low school quality limits family demand, transient renter base, plan for 1-2y turnover; 81% free/reduced lunch — lower-income household profile, screen leases tightly.
- Zoned schools: Perry El Sch (math 8% / reading 17%, grade F, #1,362 of 1,518 statewide, top 92%, 462 students, 100% FRL); Northwest Pa Collegiate Academy (math 82%, 753 students, 100% FRL) — zoned schools average 100% FRL vs 81% district-wide (19 pts higher); higher-poverty schools than district average — tighter screening recommended.
- Market conditions: Rents rising (+3.0%/yr); 56 active listings in the ZIP; 2 comparable units currently listed for rent nearby; lower-income renter base — watch delinquency; 364 units permitted in Erie County in 2024 (188 in 5+ unit buildings).
- At $4,753/mo this rent would consume 148% of the median local household income ($39k/yr) (locally 1044% of renters already pay >50% of income on rent) — very limited rent-growth headroom before tenants either downsize or default.
Forward outlook
- Local home prices are declining (-3.0%/yr); year-one equity from $794 of loan paydown is wiped out by about $3k of value loss. Plan a longer hold.
- Erie County population projected at -14% by 2050 — secular population decline; favor cash flow + early exit over multi-decade hold.
- At projected returns (-3.0% appreciation + 3.0% rent growth), your $32k cash investment doubles in ~2 years — after that, you're playing with house money.
Negotiation context
- It's been on market 88 days — a 6% lower offer ($108k) is reasonable based on typical stale-listing flexibility.
- Current owner paid $42k; list at $115k implies a 174% gain — meaningful room to come down on a strong offer.
Risks & watch-outs
- Watch-outs: built in 1873 — expect roof / HVAC / electrical / plumbing capex.
Questions for the listing agent
- It's been on market 88 days. Have you received any prior offers? Is the seller open to a 6% concession, seller financing, or rate buy-down credit?
- Built in 1873 — when were the roof, HVAC, electrical panel, plumbing, and water heater last replaced?
- Why hasn't it sold? Are there any deal-killer items the seller is aware of (foundation, flood, title, zoning, code violations)?
- Is there a deadline driving the sale (1031 exchange, divorce, estate, relocation)? That informs how much negotiation room exists.
- Crime grade is D in this area — have there been break-ins, vandalism, or insurance claims at this property in the last 3 years? What carrier currently insures it and at what premium?
- What's the average days-on-market for RENTAL listings here right now (not sales)? A rising rental-DOM trend means longer vacancies and softer asking-rent achievability than the comps imply.
- What's the recent tenant-quality profile in this submarket — average credit score on applications, eviction rate, late-payment / NSF rate, and stable-employment percentage? A property-management company in the area should have these aggregated.
- How much new apartment / multifamily construction is in the pipeline within 1–3 miles? Heavy new supply (>2% of stock underway) typically softens rents 12–24 months out; light construction supports rent growth.
Investment metrics
- 1% rule
- 4.14% ✓
- Cap rate
- 36.40%
- Cash-on-cash
- 107.52%
- DSCR
- 5.78
- GRM
- 2.0
CMA / ARV
- ARV (median comp)
- $113,457
- List price
- $114,900
- Delta
- 1.27%
- Verdict
- FAIR
- Comps
- 20 within 1.0 mi
Show comp detail 12 sales within ~0.75 mi
| Address | Dist | Beds/Ba | Sqft | Sold | Price | $/sf | Match |
|---|---|---|---|---|---|---|---|
| 906 W 21st St | 0.06mi | 4/2.0 (-1) | 2,040 (0%) | 8mo | $150,000 | $74 | 82 |
| 721 W 19th St | 0.11mi | 6/2.0 (+1) | 2,010 (-2%) | 10mo | $120,000 | $60 | 75 |
| 1114 W 20th St | 0.35mi | 5/2.0 | 1,936 (-5%) | 4mo | $111,000 | $57 | 68 |
| 2124 Liberty St | 0.09mi | 4/2.0 (-1) | 2,260 (+11%) | 3mo | $95,000 | $42 | 66 |
| 1151 W 22nd St | 0.43mi | 5/2.0 | 2,112 (+4%) | 7mo | $114,000 | $54 | 64 |
| 821 W 23rd St | 0.17mi | 4/2.0 (-1) | 1,832 (-10%) | 5mo | $119,500 | $65 | 62 |
| 719 W 16th St | 0.28mi | 6/2.0 (+1) | 1,850 (-9%) | 1mo | $92,000 | $50 | 62 |
| 2916 Hazel St | 0.59mi | 6/2.0 (+1) | 2,032 (-0%) | 6mo | $121,000 | $60 | 58 |
| 649 W 21st St | 0.16mi | 4/2.0 (-1) | 2,308 (+13%) | 6mo | $170,000 | $74 | 57 |
| 2925 Cherry St | 0.64mi | 5/— | 1,848 (-9%) | 10mo | $135,000 | $73 | 46 |
| 421 W 16th St | 0.55mi | 5/2.0 | 1,760 (-14%) | 2mo | $79,500 | $45 | 46 |
| 1809 Myrtle St | 0.69mi | 6/2.0 (+1) | 1,842 (-10%) | 10mo | $79,500 | $43 | 34 |
Match score weights: distance 35% · size 25% · config 20% · recency 20%. Top-matched comps best support the ARV.
Projected returns pro-forma
-3.0% appreciation · 2.97% rent growth · sell at horizon
- IRR
- —
- Equity multiple
- 6.13×
- Total profit
- $164,961
- Equity at exit
- $17,132
- IRR
- —
- Equity multiple
- 12.81×
- Total profit
- $379,961
- Equity at exit
- $9,934
Cash invested: $32,172 (down + closing). Projections, not guarantees.
Landlord ↔ Tenant lean methodology
- Overall (STATE)
- 62 Landlord-Friendly
- State Pennsylvania
- 62 Landlord-Friendly · EVEN
- County
- — inherits STATE
- City
- — inherits STATE
ZIP-level market 16502
- Home prices YoY
- -30.5%
- Rents YoY
- 3.0%
- Active inventory
- 56
- Price-to-rent
- 12.1×
Monthly cashflow live
- Estimated rent
- $4,753 high interval (Pro) →
- Mortgage (P&I)
- −$603
- Tax from tax record
- −$222 /mo · $2,661/yr
- Insurance
- −$48
- HOA
- −$0
- Vacancy / Maint / Mgmt
- −$998
- Net cashflow
- $2,883
Break-even live
Sensitivity live
| Price | -10% $2,948 | -5% $2,915 | +0% $2,883 | +5% $2,850 | +10% $2,818 |
|---|---|---|---|---|---|
| Rent | -10% $2,507 | -5% $2,695 | +0% $2,883 | +5% $3,070 | +10% $3,258 |
| Rate | -1.0pp $2,941 | -0.5pp $2,912 | base $2,883 | +0.5pp $2,853 | +1.0pp $2,823 |
6-unit breakdown (identical units grouped — click to expand)
| Units | Beds | Baths | Est. rent |
|---|---|---|---|
| 6× units | 1 | 1 | $4,752 |
| #1 | 1 | 1 | $792 |
| #2 | 1 | 1 | $792 |
| #3 | 1 | 1 | $792 |
| #4 | 1 | 1 | $792 |
| #5 | 1 | 1 | $792 |
| #6 | 1 | 1 | $792 |
| Total (6 units) | $4,753 | ||
UW: 25.0% down · 7.5% · 30yr · 1.5% tax · 5.0% vac · 8.0% maint · 8.0% mgmt
Financing live
Cash to close
- Down payment
- $28,725
- Closing costs
- $3,447
- Reserves months
- —
- Total cash needed
- —
Loan-product check · same deal, 3 products live
Conventional
25% down · 7.5% · 30yr
- Down + closing
- —
- Monthly P&I
- —
- Monthly cashflow
- —
- DSCR
- —
- Eligible?
- —
Personal DTI + credit; lowest rate.
DSCR
20% down · 8.5% · 30yr
- Down + closing
- —
- Monthly P&I
- —
- Monthly cashflow
- —
- DSCR
- —
- Eligible?
- —
No personal income docs; deal must DSCR.
Hard money
10% down · 12.0% · 12mo
- Down + closing
- —
- Monthly P&I
- —
- Monthly cashflow
- —
- DSCR
- —
- Eligible?
- —
Short-term bridge; refi at stabilization.
Rent comps 2 comps
| Address | Beds | Baths | Sqft | Rent | $/sqft | DOM | Units | Dist |
|---|---|---|---|---|---|---|---|---|
| 729 W 9th St Erie, PA | 4.0 | 2.0 | 1782 | $3,000 | $1.68 | 45d | 1 | 0.77mi |
| 126 W 38th St Erie, PA | 4.0 | 2.0 | 1850 | $4,000 | $2.16 | 45d | 1 | 1.39mi |
Listing history 22 events
-
2026-06-21days on market $114,900 Active 88 DOM
-
2026-06-19days on market $114,900 Active 86 DOM
-
2026-06-18days on market $114,900 Active 85 DOM
-
2026-06-17days on market $114,900 Active 84 DOM
-
2026-06-16days on market $114,900 Active 83 DOM
-
2026-06-15days on market $114,900 Active 82 DOM
-
2026-06-14days on market $114,900 Active 80 DOM
-
2026-06-13days on market $114,900 Active 79 DOM
-
2026-06-10days on market $114,900 Active 77 DOM
-
2026-06-09days on market $114,900 Active 76 DOM
-
2026-06-08days on market $114,900 Active 75 DOM
-
2026-06-07days on market $114,900 Active 74 DOM
-
2026-06-05days on market $114,900 Active 71 DOM
-
2026-06-03days on market $114,900 Active 70 DOM
-
2026-06-02days on market $114,900 Active 69 DOM
-
2026-06-01days on market $114,900 Active 68 DOM
-
2026-05-31days on market $114,900 Active 67 DOM
-
2026-05-30days on market $114,900 Active 66 DOM
-
2026-03-25$114,900 Active 520-char remark
Show marketing remark (520 chars)
Newer Roof, Updated Windows with guarantee, and a newer furnace for lower level. Spacious multi-family property offering 5 bedrooms and 3 bathrooms across approximately 2,040 square feet, providing strong potential for both owner-occupants and investors. Built in 1873, this property blends classic character with functional living space and sits on a manageable city lot. With multiple units and solid rental potential, this is a great opportunity to generate income, expand your investment portfolio, or owner occupy.
-
2002-09-23soldstatus $42,000
-
2002-09-23soldstatus $42,000
-
1978-06-16soldstatus $39,000
ⓘ Source: listings_history table (triggers on properties + properties_extension) + one-shot
backfill from property_details.listing_events for pre-trigger history.
Tax reassessment forecast PA · Partial reset (capped growth)
- Current annual tax
- $2,661 · $222/mo
- Projected year-2 tax
- $2,661 · $222/mo
- Expected delta
- $0/yr ($0/mo · 0.0%)
ⓘ Screening estimate from a state-policy table — verify with the county assessor before closing.
Climate risk First Street
- Flood 1/10 Low FEMA zone X (unshaded) · 0% chance over 30 yrs
- Wildfire 1/10 Low
- Heat 3/10 Moderate 7 d/yr ≥90°F today · 17 d/yr by 30 yrs out
- Wind 1/10 Low
- Air quality 2/10 Low 1 unhealthy d/yr today · 3 by 30 yrs out
Nearby sold comps map
Loading sold comps map…
Walkable amenities ~0.75 mi
Loading nearby amenities…
Taxation est. · year 1
- Rental income
- $57,036
- − Mortgage interest
- −$6,436
- − Property taxes
- −$2,661
- − Insurance
- −$574
- − Repairs & maintenance
- −$4,563
- − Management
- −$4,563
- − Depreciation
- −$3,343
- Taxable income
- $34,896
- Est. tax owed @ 24.0%
- −$8,375
- After-tax cash flow
- $26,218/yr
For passive investors: Depreciation is non-cash, so a rental often shows a tax loss while cash-flowing — sheltering income. Rental losses are passive: they offset passive income freely, and up to $25,000/yr can offset ordinary (W-2) income if you actively participate and your MAGI is under $100k (phasing out to $0 by $150k); unused losses carry forward. On sale, claimed depreciation is recaptured at up to 25%, and gains may owe capital-gains tax (a 1031 exchange can defer both). Figures are a year-1 estimate at your 24.0% rate — not tax advice; consult a CPA.
Schools (NCES district)
- District
- Erie City SD
- NCES district ID
- 4209300
- Math proficiency
- 12% ▼ -11.00%
- Reading proficiency
- 19% ▼ -16.00%
- Median HH income
- $33,625
- Composite
- 12.59/100
- National rank
- #9617
- State rank
- #510 of 539 in PA
Livability — Erie
- Score
- 83/100
- State rank
- #109
- US rank
- #840
Category grades
Schools grade is shown separately in the Schools card above.
Census & demographics
- Census place
- Erie, PA
- County
- Erie County · 92,215 people
- City population
- 92,215
- Metro
- Erie, PA
- Population (ZIP)
- 15,995
- Household income
- $38,566
- Rent vs Own
- Severe rent burden
- 1044.0
Population outlook (Erie County) Hauer SSP2
- Today (2025)
- 272,159 people
- By 2030
- 266,299 · -2.2%
- By 2040
- 250,987 · -7.8%
- By 2050
- 234,925 · -13.7%
- By 2075
- 199,164 · -26.8%
- By 2100
- 162,985 · -40.1%
Race, ethnicity, and origin ACS 2023
- Neighborhood character
- Predominantly White (66%)
- Race & ethnicity
- White 66% Two or more races 16% Hispanic / Latino 13% Black 11% Asian 2%
- Hispanic origin (detail)
- Mexican 5% Puerto Rican 5%
- Common ancestry
- Romanian 7% Serbian 2% Italian 1%
- Foreign-born
- 5% · Canada
- Languages at home
- 89% English-only · Spanish 8% Other Indo-European 1% Russian/Polish/Slavic 1%
Political lean MEDSL · Erie
- 2024 margin
- Toss-up / Even · D 49.0% · R 50.0%
- 2008→2024 swing
- -20.9pp toward R · 2008: 19.9pp · 2024: -1.0pp
- All cycles
- 2024: R+1.0 2020: D+1.0 2016: R+2.0 2012: D+16.9 2008: D+19.9
Not yet ingested
- Civics
- —
Market trends
- HPI YoY
- ▼ -92.73%
- Current HPI
- 211.4408
- Rent YoY
- ▲ 2.97%
- Metro
- Erie, PA
- State GDP YoY
- ▲ 1.68%
- F500 in state
- 34
Industry mix (Fortune 500 HQ in PA)
| Industry | F500 HQs | Revenue |
|---|---|---|
| Healthcare | 2 | $309B |
|
||
| Insurance | 2 | $27B |
|
||
| Telecommunications / Media | 1 | $124B |
|
||
| Industrial Distribution | 1 | $22B |
|
||
| Financial Services | 1 | $20B |
|
||
| Chemicals / Materials | 1 | $18B |
|
||
Price history
+194.6% since first listed4 events — show timeline
- 2026-03-25 Listed $114,900 GEBOR
- 2002-09-23 Sold (Public Records) $42,000 Public Records
- 2002-09-23 Sold (Public Records) $42,000 Public Records
- 1978-06-16 Sold (Public Records) $39,000 Public Records
Property tax history
+1.9%/yrLatest (2026): $2,661 · +3.4% YoY. Source: county tax records.
Cash-flow waterfall
monthlySold comps — $/sqft
last 12 mo · ≤1 miLoading sold comps…