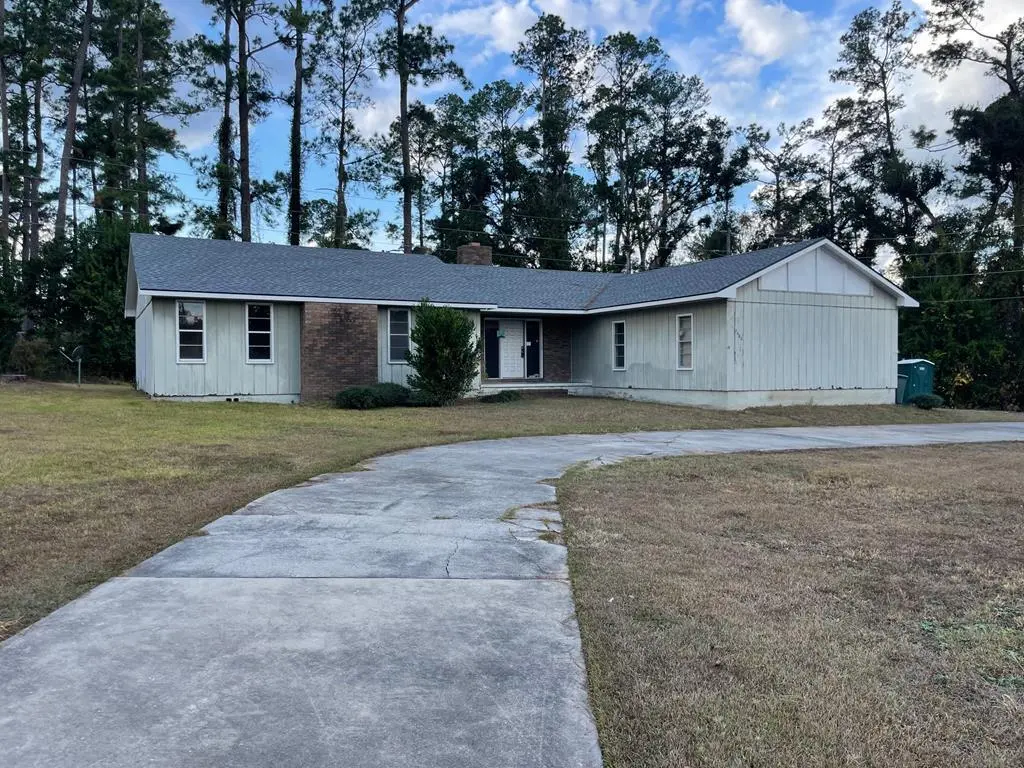
2402 Gornto Rd · Valdosta, GA
Flood risk 1/10 · Minimal
- FEMA flood zone
- X (unshaded)
- Chance of flooding over 30 yrs
- 0.0%
- Est. flood insurance / yr
- $507 – $1,088
Fire risk 5/10 · Moderate
- Est. fire insurance / yr
- $963 – $1,789
Heat risk 8/10 · Major
- Hot days now (above 108°F)
- 7 days/yr
- Hot days in 30 yrs
- 19 days/yr
Wind risk 8/10 · Major
- Chance of severe wind over 30 yrs
- 99.0%
Air-quality risk 6/10 · Moderate
- Unhealthy air days now
- 10 days/yr
- Unhealthy air days in 30 yrs
- 11 days/yr
Risk factors via First Street. Map © Google.
Why this score? — see what drove the C grade
The composite is a weighted blend of 9 inputs, each scored 0–100. Each bar is that input's sub-score; the figure is the points it added to the 100-point composite (weight × sub-score).
- Cash flow +20.9/30.0
- ARV discount +15.0/15.0
- DSCR +6.6/10.0
- 1% rule +5.4/10.0
- Rent growth +3.5/5.0
- Livability +3.0/5.0
- Condition / age +2.5/5.0
- Schools +1.5/10.0
- Appreciation +0.0/10.0
$159,900
🖨 Deal sheet 📄 Offer letter ✓ Due diligence
Listing remarks MLS
Calling all Remodelers and Investors!! This property has great potential and is in a great location! It definitely needs a remodeler's expertise but it has a Brand New Roof!! Don't miss it and come take a look!
Key facts
- Brand new roof
- 0.48 acre lot
- Built 1976
Tags
Neighborhood map
What this means for you Summary
Snapshot
- This is a 3-bed/2.0-bath single-family listed at $160k.
Deal economics
- At list price, monthly cash flow is $222 ($3k/yr) — positive.
- The deal already cash-flows at list — no discount required.
- Meets the 1% rule at list price ($2k rent vs $160k).
- Recommended offer: $141k (12.0% below list) — sets the bar for market timing.
- Cap rate 8.0% vs local median 4.3% in Valdosta — top-decile yield for the area; either an underpriced asset or a hidden risk that comps aren't pricing in. Stress-test before assuming the spread holds.
Location & tenants
- Location reads 60/100 on livability (#392 in GA) — a middle-class / working-renter tenant base. Strengths: cost of living A+, health & safety A+, housing A-; Watch: schools F, crime F, amenities F.
- Valdosta City (urban): math 15% / reading 22% proficiency, ranked #149 of 174 in GA (top 86%) — low school quality limits family demand, transient renter base, plan for 1-2y turnover; 74% free/reduced lunch — lower-income household profile, screen leases tightly.
- Market conditions: Rents rising fast (+4.2%/yr); 267 active listings in the ZIP; 18 comparable units currently listed for rent nearby; rentals lingering (median 44d on market — plan ~5-8 weeks vacancy on turnover, expect pricing pressure); 61% of comp listings sitting > 30 days — soft ceiling on asking rent; 896 units permitted in Lowndes County in 2024 (0 in 5+ unit buildings).
- This rent runs 35% of the median local income ($57k/yr) — at the standard rent-burdened threshold; future hikes will face affordability resistance.
Forward outlook
- Local home prices are declining (-3.0%/yr); year-one equity from $1k of loan paydown is wiped out by about $5k of value loss. Plan a longer hold.
- Lowndes County population projected at +10% by 2050 — modest demand growth; plan on rents tracking national, not racing it.
Negotiation context
- It's been on market 206 days — a 12% lower offer ($141k) is reasonable based on typical stale-listing flexibility.
- Current owner paid $125k; 28% above their basis — modest negotiation headroom, anchor on the comps not their cost.
Risks & watch-outs
- Climate carrying-cost: severe wind risk, 99% chance of damaging wind over 30y; moderate wildfire risk; extreme-heat days projected 7→19/yr by 2055 (HVAC capex compounding) — expect insurance premiums to compound above CPI over the hold.
Questions for the listing agent
- It's been on market 206 days. Have you received any prior offers? Is the seller open to a 12% concession, seller financing, or rate buy-down credit?
- Built in 1976 — when were the roof, HVAC, electrical panel, plumbing, and water heater last replaced?
- Why hasn't it sold? Are there any deal-killer items the seller is aware of (foundation, flood, title, zoning, code violations)?
- Is there a deadline driving the sale (1031 exchange, divorce, estate, relocation)? That informs how much negotiation room exists.
- Schools are F-rated, which usually means shorter tenancies and higher turnover. Who's the typical renter profile here, and what's been the actual vacancy rate?
- Crime grade is F in this area — have there been break-ins, vandalism, or insurance claims at this property in the last 3 years? What carrier currently insures it and at what premium?
- What's the average days-on-market for RENTAL listings here right now (not sales)? A rising rental-DOM trend means longer vacancies and softer asking-rent achievability than the comps imply.
- What's the recent tenant-quality profile in this submarket — average credit score on applications, eviction rate, late-payment / NSF rate, and stable-employment percentage? A property-management company in the area should have these aggregated.
- How much new for-sale + rental construction is in the pipeline within 1–3 miles? Heavy new supply typically softens prices + rents 12–24 months out; constrained supply supports both.
Investment metrics
- 1% rule
- 1.04% ✓
- Cap rate
- 7.96%
- Cash-on-cash
- 5.95%
- DSCR
- 1.26
- GRM
- 8.0
CMA / ARV
- ARV (median comp)
- $252,532
- List price
- $159,900
- Delta
- -36.68%
- Verdict
- UNDERPRICED
- Comps
- 20 within 1.0 mi
Show comp detail 12 sales within ~0.75 mi
| Address | Dist | Beds/Ba | Sqft | Sold | Price | $/sf | Match |
|---|---|---|---|---|---|---|---|
| 1809 S Sherwood Cir | 0.06mi | 3/2.0 | 1,844 (+1%) | 3mo | $259,000 | $140 | 93 |
| 2209 Pinecliff Dr | 0.18mi | 3/2.0 | 1,812 (-1%) | 1mo | $218,000 | $120 | 89 |
| 1810 Englewood Dr | 0.13mi | 3/2.0 | 1,912 (+5%) | 2mo | $284,900 | $149 | 85 |
| 2206 Gornto Rd | 0.20mi | 3/2.0 | 1,722 (-6%) | 3mo | $180,000 | $105 | 79 |
| 2209 S Sherwood Dr | 0.41mi | 3/2.0 | 1,740 (-5%) | 2mo | $230,000 | $132 | 71 |
| 2507 Lakewood Dr | 0.56mi | 3/2.0 | 1,839 (+1%) | 4mo | $210,000 | $114 | 69 |
| 2223 S Sherwood Dr | 0.31mi | 3/2.0 | 1,656 (-9%) | 2mo | $200,000 | $121 | 68 |
| 2213 Riverside Dr | 0.43mi | 3/2.0 | 1,656 (-9%) | 4mo | $242,500 | $146 | 62 |
| 2410 Riverside Dr | 0.57mi | 3/2.5 | 1,932 (+6%) | 1mo | $312,900 | $162 | 61 |
| 2432 Meadowbrook Dr | 0.60mi | 3/2.0 | 1,942 (+6%) | 2mo | $245,000 | $126 | 60 |
| 2121 Northwood Cir | 0.58mi | 3/2.0 | 2,075 (+14%) | 4mo | $246,900 | $119 | 47 |
| 2102 Park Ln | 0.70mi | 4/3.0 (+1) | 2,008 (+10%) | 0mo | $274,700 | $137 | 42 |
Match score weights: distance 35% · size 25% · config 20% · recency 20%. Top-matched comps best support the ARV.
Projected returns pro-forma
-3.0% appreciation · 4.19% rent growth · sell at horizon
- IRR
- -5.8%
- Equity multiple
- 0.78×
- Total profit
- $-9,741
- Equity at exit
- $23,842
- IRR
- 5.2%
- Equity multiple
- 1.41×
- Total profit
- $18,240
- Equity at exit
- $13,825
Cash invested: $44,772 (down + closing). Projections, not guarantees.
Landlord ↔ Tenant lean methodology
- Overall (STATE)
- 90 Strongly Landlord-Friendly
- State Georgia
- 90 Strongly Landlord-Friendly · R+3
- County
- — inherits STATE
- City
- — inherits STATE
ZIP-level market 31602
- Rents YoY
- 4.2%
- Active inventory
- 267
- Price-to-rent
- 8.0×
Monthly cashflow live
- Estimated rent
- $1,659 high interval (Pro) →
- Mortgage (P&I)
- −$839
- Tax from tax record
- −$183 /mo · $2,197/yr
- Insurance
- −$67
- HOA
- −$0
- Vacancy / Maint / Mgmt
- −$348
- Net cashflow
- $222
Break-even live
UW: 25.0% down · 7.5% · 30yr · 1.5% tax · 5.0% vac · 8.0% maint · 8.0% mgmt
Financing live
Cash to close
- Down payment
- $39,975
- Closing costs
- $4,797
- Reserves months
- —
- Total cash needed
- —
Loan-product check · same deal, 3 products live
Conventional
25% down · 7.5% · 30yr
- Down + closing
- —
- Monthly P&I
- —
- Monthly cashflow
- —
- DSCR
- —
- Eligible?
- —
Personal DTI + credit; lowest rate.
DSCR
20% down · 8.5% · 30yr
- Down + closing
- —
- Monthly P&I
- —
- Monthly cashflow
- —
- DSCR
- —
- Eligible?
- —
No personal income docs; deal must DSCR.
Hard money
10% down · 12.0% · 12mo
- Down + closing
- —
- Monthly P&I
- —
- Monthly cashflow
- —
- DSCR
- —
- Eligible?
- —
Short-term bridge; refi at stabilization.
Rent comps 18 comps
| Address | Beds | Baths | Sqft | Rent | $/sqft | DOM | Units | Dist |
|---|---|---|---|---|---|---|---|---|
| 2124 Northwood Cir Valdosta, GA | 3.0 | 2.5 | 2100 | $1,850 | $0.88 | 21d | 1 | 0.52mi |
| 1202 Kimberly Dr Valdosta, GA | 3.0 | 2.5 | 1989 | $1,600 | $0.80 | 43d | 1 | 0.54mi |
| 1921 Gornto Rd Valdosta, GA | 3.0 | 2.0 | 1316 | $1,195 | $0.91 | 43d | 1 | 0.57mi |
| 2409 Riverside Dr Valdosta, GA | 4.0 | 2.0 | 1955 | $1,950 | $1.00 | 21d | 1 | 0.60mi |
| 2 Westbrook Cir Apt B Valdosta, GA | 3.0 | 2.0 | 1469 | $1,350 | $0.92 | 43d | 1 | 0.60mi |
| 2201 Baytree Rd Valdosta, GA | 2.0–3.0 | 2.0–3.0 | 1103 | $1,750 | $1.59 | 21d | 12 | 0.80mi |
| 1716 Spring Hill Pl Unit C Valdosta, GA | 3.0 | 3.5 | 2300 | $1,500 | $0.65 | 21d | 1 | 0.92mi |
| 1708 Spring Hill Pl Valdosta, GA | 3.0 | 3.0 | 2300 | $1,500 | $0.65 | 43d | 1 | 0.94mi |
| 1213 McRee Dr Valdosta, GA | 4.0 | 2.0 | 1588 | $1,895 | $1.19 | 43d | 1 | 0.94mi |
| 1720 Spring Hill Pl Unit B Valdosta, GA | 3.0 | 3.5 | 2300 | $1,500 | $0.65 | 21d | 1 | 0.96mi |
| 2208 White Oak Dr Valdosta, GA | 3.0 | 2.5 | 2194 | $1,975 | $0.90 | 43d | 1 | 0.98mi |
| 1712 Spring Hill Pl Valdosta, GA | 3.0 | 3.5 | 2300 | $1,500 | $0.65 | 43d | 1 | 1.00mi |
| 702 Pineridge Dr Valdosta, GA | 3.0 | 2.0 | 1736 | $1,650 | $0.95 | 43d | 1 | 1.08mi |
| 2502 Berkley Dr Valdosta, GA | 3.0 | 2.0 | 1484 | $1,650 | $1.11 | 21d | 1 | 1.16mi |
| 1018 Cherokee St Valdosta, GA | 3.0 | 1.5 | 1225 | $1,375 | $1.12 | 21d | 1 | 1.30mi |
| 607 Parker Mathis Dr Valdosta, GA | 3.0 | 1.5 | 1395 | $1,495 | $1.07 | 43d | 1 | 1.41mi |
| 1903 Azalea Dr Valdosta, GA | 3.0 | 2.0 | 2128 | $2,500 | $1.17 | 43d | 1 | 1.46mi |
| 1612 Garland Pl Valdosta, GA | 3.0 | 2.0 | 1268 | $1,295 | $1.02 | 43d | 1 | 1.48mi |
Listing history 23 events
-
2026-06-19days on market $159,900 Active 206 DOM
-
2026-06-18days on market $159,900 Active 205 DOM
-
2026-06-17days on market $159,900 Active 204 DOM
-
2026-06-16days on market $159,900 Active 203 DOM
-
2026-06-15days on market $159,900 Active 202 DOM
-
2026-06-14days on market $159,900 Active 200 DOM
-
2026-06-13days on market $159,900 Active 199 DOM
-
2026-06-10days on market $159,900 Active 197 DOM
-
2026-06-09days on market $159,900 Active 196 DOM
-
2026-06-08days on market $159,900 Active 195 DOM
-
2026-06-07days on market $159,900 Active 194 DOM
-
2026-06-05days on market $159,900 Active 191 DOM
-
2026-06-03days on market $159,900 Active 190 DOM
-
2026-06-02days on market $159,900 Active 189 DOM
-
2026-06-01days on market $159,900 Active 188 DOM
-
2026-05-31days on market $159,900 Active 187 DOM
-
2026-05-30days on market $159,900 Active 186 DOM
-
2026-02-08price $159,900 213-char remark
Show marketing remark (213 chars)
Calling all Remodelers and Investors!! This property has great potential and is in a great location! It definitely needs a remodeler's expertise but it has a Brand New Roof!! Don't miss it and come take a look!
-
2025-11-25$169,900 Active 213-char remark
Show marketing remark (213 chars)
Calling all Remodelers and Investors!! This property has great potential and is in a great location! It definitely needs a remodeler's expertise but it has a Brand New Roof!! Don't miss it and come take a look!
-
2021-05-17soldstatus $125,000
-
2006-04-17soldstatus $507,000
-
2003-08-04soldstatus $93,000
-
1987-04-01soldstatus $75,900
ⓘ Source: listings_history table (triggers on properties + properties_extension) + one-shot
backfill from property_details.listing_events for pre-trigger history.
Tax reassessment forecast GA · Resets to sale price
- Current annual tax
- $2,197 · $183/mo
- Projected year-2 tax
- $2,197 · $183/mo
- Expected delta
- $0/yr ($0/mo · 0.0%)
ⓘ Screening estimate from a state-policy table — verify with the county assessor before closing.
Climate risk First Street
- Flood 1/10 Low FEMA zone X (unshaded) · 0% chance over 30 yrs
- Wildfire 5/10 Major
- Heat 8/10 Severe 7 d/yr ≥108°F today · 19 d/yr by 30 yrs out
- Wind 8/10 Severe 99% chance of damaging wind over 30 yrs
- Air quality 6/10 Major 10 unhealthy d/yr today · 11 by 30 yrs out
Nearby sold comps map
Loading sold comps map…
Walkable amenities ~0.75 mi
Loading nearby amenities…
Taxation est. · year 1
- Rental income
- $19,903
- − Mortgage interest
- −$8,957
- − Property taxes
- −$2,197
- − Insurance
- −$800
- − Repairs & maintenance
- −$1,592
- − Management
- −$1,592
- − Depreciation
- −$4,652
- Taxable income
- $114
- Est. tax owed @ 24.0%
- −$27
- After-tax cash flow
- $2,638/yr
For passive investors: Depreciation is non-cash, so a rental often shows a tax loss while cash-flowing — sheltering income. Rental losses are passive: they offset passive income freely, and up to $25,000/yr can offset ordinary (W-2) income if you actively participate and your MAGI is under $100k (phasing out to $0 by $150k); unused losses carry forward. On sale, claimed depreciation is recaptured at up to 25%, and gains may owe capital-gains tax (a 1031 exchange can defer both). Figures are a year-1 estimate at your 24.0% rate — not tax advice; consult a CPA.
Schools (NCES district)
- District
- Valdosta City
- NCES district ID
- 1305310
- Math proficiency
- 15% ▼ -12.00%
- Reading proficiency
- 22% ▼ -7.00%
- Median HH income
- $30,634
- Composite
- 14.79/100
- National rank
- #9388
- State rank
- #149 of 174 in GA
Livability — Valdosta
- Score
- 60/100
- State rank
- #392
- US rank
- #19544
Category grades
Schools grade is shown separately in the Schools card above.
Census & demographics
- Census place
- Valdosta, GA
- County
- Lowndes County · 107,801 people
- City population
- 91,859
- Metro
- Valdosta, GA
- Population (ZIP)
- 35,728
- Household income
- $56,939
- Rent vs Own
- Severe rent burden
- 2034.0
Population outlook (Lowndes County) Hauer SSP2
- Today (2025)
- 120,348 people
- By 2030
- 123,469 · +2.6%
- By 2040
- 128,482 · +6.8%
- By 2050
- 131,907 · +9.6%
- By 2075
- 139,080 · +15.6%
- By 2100
- 133,649 · +11.1%
Race, ethnicity, and origin ACS 2023
- Neighborhood character
- Diverse neighborhood (Simpson 0.61)
- Race & ethnicity
- White 45% Black 42% Hispanic / Latino 7% Two or more races 5% Asian 2%
- Hispanic origin (detail)
- Mexican 3% Puerto Rican 1%
- Common ancestry
- Italian 1% Slovak 1% Lithuanian 1%
- Foreign-born
- 4% · Canada
- Languages at home
- 94% English-only · Spanish 3% Other Indo-European 1% French/Haitian/Cajun 1%
Political lean MEDSL · Lowndes
- 2024 margin
- R (+18.0) · D 40.8% · R 58.8%
- 2008→2024 swing
- -8.6pp toward R · 2008: -9.4pp · 2024: -18.0pp
- All cycles
- 2024: R+18.0 2020: R+12.0 2016: R+18.2 2012: R+10.5 2008: R+9.4
Not yet ingested
- Civics
- —
Market trends
- HPI YoY
- ▼ -150.60%
- Current HPI
- 188.2012
- Rent YoY
- ▲ 4.19%
- Metro
- Valdosta, GA
- State GDP YoY
- ▲ 2.66%
- F500 in state
- 28
Industry mix (Fortune 500 HQ in GA)
| Industry | F500 HQs | Revenue |
|---|---|---|
| Paper / Packaging | 2 | $29B |
|
||
| Retail | 1 | $160B |
|
||
| Transportation / Logistics | 1 | $91B |
|
||
| Airlines | 1 | $62B |
|
||
| Consumer Goods | 1 | $47B |
|
||
| Utilities | 1 | $25B |
|
||
Price history
+110.7% since first listed6 events — show timeline
- 2026-02-08 Price Changed $159,900 SGMLS
- 2025-11-25 Listed $169,900 SGMLS
- 2021-05-17 Sold (Public Records) $125,000 Public Records
- 2006-04-17 Sold (Public Records) $507,000 Public Records
- 2003-08-04 Sold (Public Records) $93,000 Public Records
- 1987-04-01 Sold (Public Records) $75,900 Public Records
Property tax history
+1.7%/yrLatest (2025): $2,197 · +3.3% YoY. Source: county tax records.
Cash-flow waterfall
monthlySold comps — $/sqft
last 12 mo · ≤1 miLoading sold comps…