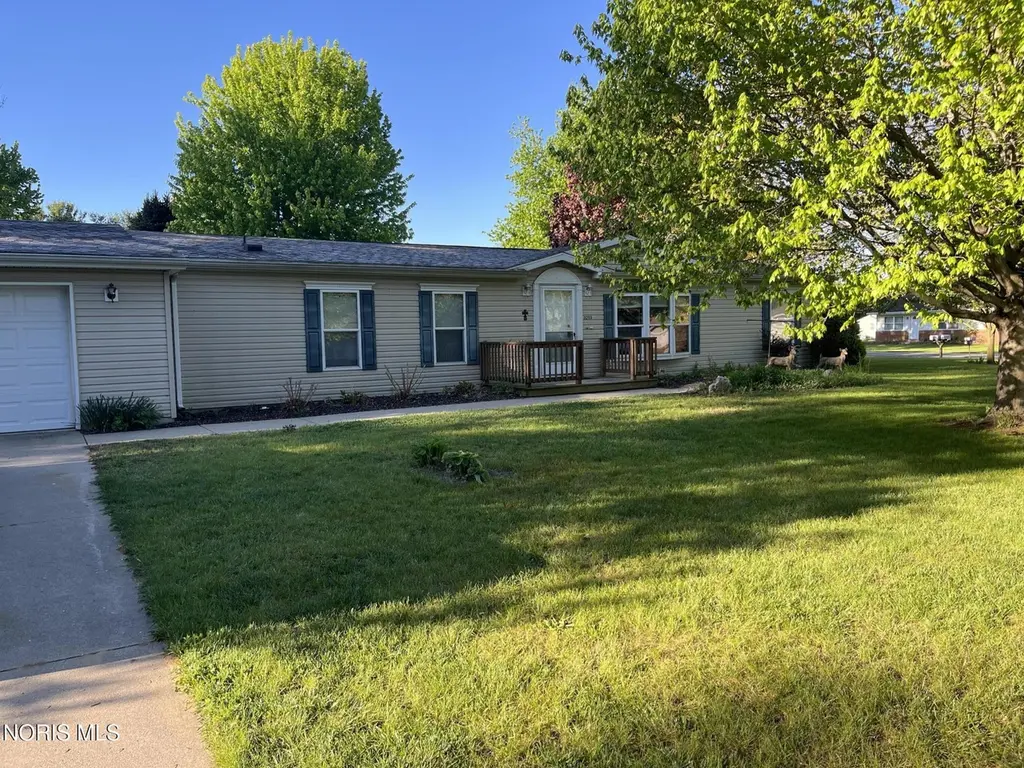
3203 Circle Dr · Delta, OH
Flood risk 1/10 · Minimal
- FEMA flood zone
- X (unshaded)
- Chance of flooding over 30 yrs
- 0.0%
- Est. flood insurance / yr
- $507 – $1,088
Fire risk 3/10 · Minor
- Est. fire insurance / yr
- $713 – $1,323
Heat risk 3/10 · Minor
- Hot days now (above 99°F)
- 7 days/yr
- Hot days in 30 yrs
- 17 days/yr
Wind risk 2/10 · Minimal
- Chance of severe wind over 30 yrs
- —
Air-quality risk 2/10 · Minimal
- Unhealthy air days now
- 1 days/yr
- Unhealthy air days in 30 yrs
- 2 days/yr
Risk factors via First Street. Map © Google.
Why this score? — see what drove the D- grade
The composite is a weighted blend of 9 inputs, each scored 0–100. Each bar is that input's sub-score; the figure is the points it added to the 100-point composite (weight × sub-score).
- ARV discount +15.0/15.0
- Cash flow +6.6/30.0
- Schools +6.0/10.0
- Livability +3.9/5.0
- Rent growth +2.5/5.0
- Condition / age +2.5/5.0
- 1% rule +1.8/10.0
- DSCR +0.9/10.0
- Appreciation +0.0/10.0
$198,900
🖨 Deal sheet (PDF) 📄 Offer letter ✓ Due diligence
Listing remarks
Charming 3-bedroom, 2 full bathroom home offering 1,680 sq. ft. of comfortable living space, nestled in a peaceful rural community with a private sewer system. Whether you're looking to downsize or searching for the perfect affordable starter home, this property is full of warmth and potential. Enjoy the spacious kitchen featuring an open-concept design that flows effortlessly into the inviting living room, creating the perfect space for gathering and entertaining. Just off the living room, the bright sunroom welcomes an abundance of natural light, filling the home with a warm and airy atmosphere. Special assessment for private sewer system.
Key facts
- 0.42 acre lot
- 2 garage spots
- Built 2001
Property features AI
Finance
- Other: Living area reported as 1,680 (source: public records)
Exterior
- Parking: Attached garage (2 spaces); Total parking for 6 vehicles; Driveway; Concrete parking; Accessible parking
- Security: Other security features
- Utilities: Well water; Private sewer; Electricity connected (150 amp, circuit breakers); Natural gas connected; Cable available
- Home design: Single-family house; One story; No shared/common walls
- Construction: Vinyl siding; Batts insulation; Block foundation; Asphalt shingle roof; Built (year source: public records)
- Exterior features: Private yard; Corner, level lot; Front porch; Glass-enclosed patio; Shed(s)
Interior
- Kitchen: Gas cooktop; Gas oven; Dishwasher; Refrigerator; Eat-in kitchen
- Bedrooms: All bedrooms on main level; Bedroom 2 on main level; Bedroom 3 on main level
- Flooring: Carpet; Linoleum
- Bathrooms: 2 full bathrooms
- Heating & cooling: Central heating (forced air, natural gas); Central air conditioning
- Interior features: Eat-in kitchen; Open floor plan; Walk-in closet(s); Cathedral ceilings; Double-pane insulated windows
- Laundry & utility: Washer and dryer included; Main-level laundry; Water heater
Neighborhood map
What this means for you Summary
Snapshot
- This is a 3-bed/2.0-bath single-family listed at $199k.
Deal economics
- At list price, monthly cash flow is $-324 ($-4k/yr) — negative.
- To cash-flow at today's rent, offer at most $142k (28.8% below list).
- To meet the 1% rule (rent ≥ 1% of price), the offer needs to be $135k (31.9% below list).
- Recommended offer: $135k (31.9% below list) — sets the bar for 1% rule.
Location & tenants
- Location reads 77/100 on livability (#192 in OH, #2,924 nationally) — a middle-class / working-renter tenant base. Strengths: crime A+, cost of living A+, housing A+; Watch: amenities F, commute F, health & safety F.
- Pike-Delta-York Local (town): math 71% / reading 70% proficiency, ranked #142 of 656 in OH (top 22%) — strong family-tenant draw, lease renewals of 3-5y typical.
- Zoned schools: Delta Elementary School (math 67% / reading 52%, grade B-, #670 of 1,584 statewide, top 45%, 399 students, 32% FRL); Pike-Delta-York Middle School (math 75% / reading 76%, grade A, #78 of 654 statewide, top 12%, 348 students, 32% FRL); Pike-Delta-York High School (math 62% / reading 82%, grade B+, #89 of 781 statewide, top 12%, 373 students, 24% FRL).
- Market conditions: 26 active listings in the ZIP; solid renter incomes; 24 units permitted in Fulton County in 2024 (0 in 5+ unit buildings).
Forward outlook
- Local home prices are declining (-3.0%/yr); year-one equity from $1k of loan paydown is wiped out by about $6k of value loss. Plan a longer hold.
- Fulton County population projected at -14% by 2050 — secular population decline; favor cash flow + early exit over multi-decade hold.
Negotiation context
- It's been on market 48 days — a 3% lower offer ($193k) is reasonable based on typical stale-listing flexibility.
- Current owner paid $16k; list at $199k implies a 1143% gain — meaningful room to come down on a strong offer.
Questions for the listing agent
- What do current leases actually rent for vs. the listed asking? Can we see a recent rent roll and the last 12 months of T-12 income?
- It's been on market 48 days. Have you received any prior offers? Is the seller open to a 32% concession, seller financing, or rate buy-down credit?
- Is there a deadline driving the sale (1031 exchange, divorce, estate, relocation)? That informs how much negotiation room exists.
- Schools are A-rated — typically a magnet for longer-tenancy family renters. What's the average tenant stay here, and is there a school-zone premium baked into asking?
- The area grade is low — what's the realistic commute time and amenity access for the typical tenant pool here? Any planned neighborhood developments (good or bad) we should know about?
- What's the average days-on-market for RENTAL listings here right now (not sales)? A rising rental-DOM trend means longer vacancies and softer asking-rent achievability than the comps imply.
- What's the recent tenant-quality profile in this submarket — average credit score on applications, eviction rate, late-payment / NSF rate, and stable-employment percentage? A property-management company in the area should have these aggregated.
- How much new for-sale + rental construction is in the pipeline within 1–3 miles? Heavy new supply typically softens prices + rents 12–24 months out; constrained supply supports both.
Investment metrics
- 1% rule
- 0.68% ✗
- Cap rate
- 4.34%
- Cash-on-cash
- -6.98%
- DSCR
- 0.69
- GRM
- 12.2
CMA / ARV
- ARV (median comp)
- $293,185
- List price
- $198,900
- Delta
- -32.16%
- Verdict
- UNDERPRICED
- Comps
- 9 within 1.0 mi
Show comp detail 2 sales within ~0.75 mi
| Address | Dist | Beds/Ba | Sqft | Sold | Price | $/sf | Match |
|---|---|---|---|---|---|---|---|
| 6130 County Road C | 0.22mi | 3/1.5 | 1,716 (+2%) | 18mo | $275,000 | $160 | 69 |
| 2850 County Rd 6 | 0.26mi | 3/2.0 | 1,751 (+4%) | 17mo | $307,000 | $175 | 67 |
Match score weights: distance 35% · size 25% · config 20% · recency 20%. Top-matched comps best support the ARV.
Projected returns pro-forma
-3.0% appreciation · 3.0% rent growth · sell at horizon
- IRR
- -28.4%
- Equity multiple
- 0.05×
- Total profit
- $-52,828
- Equity at exit
- $29,657
- IRR
- -27.6%
- Equity multiple
- -0.30×
- Total profit
- $-72,435
- Equity at exit
- $17,197
Cash invested: $55,692 (down + closing). Projections, not guarantees.
Landlord ↔ Tenant lean methodology
- Overall (STATE)
- 73 Landlord-Friendly
- State Ohio
- 73 Landlord-Friendly · R+6
- County
- — inherits STATE
- City
- — inherits STATE
ZIP-level market 43515
- Home prices YoY
- -14.4%
- Active inventory
- 26
- Price-to-rent
- 12.2×
Monthly cashflow live
- Estimated rent
- $1,355 medium interval (Pro) →
- Mortgage (P&I)
- −$1,043
- Tax from tax record
- −$268 /mo · $3,218/yr
- Insurance
- −$83
- HOA
- −$0
- Vacancy / Maint / Mgmt
- −$284
- Net cashflow
- $-324
Break-even live
Sensitivity live
| Price | -10% $-211 | -5% $-268 | +0% $-324 | +5% $-380 | +10% $-437 |
|---|---|---|---|---|---|
| Rent | -10% $-431 | -5% $-377 | +0% $-324 | +5% $-270 | +10% $-217 |
| Rate | -1.0pp $-224 | -0.5pp $-273 | base $-324 | +0.5pp $-375 | +1.0pp $-428 |
UW: 25.0% down · 7.5% · 30yr · 1.5% tax · 5.0% vac · 8.0% maint · 8.0% mgmt
Financing live
Cash to close
- Down payment
- $49,725
- Closing costs
- $5,967
- Reserves months
- —
- Total cash needed
- —
Loan-product check · same deal, 3 products live
Conventional
25% down · 7.5% · 30yr
- Down + closing
- —
- Monthly P&I
- —
- Monthly cashflow
- —
- DSCR
- —
- Eligible?
- —
Personal DTI + credit; lowest rate.
DSCR
20% down · 8.5% · 30yr
- Down + closing
- —
- Monthly P&I
- —
- Monthly cashflow
- —
- DSCR
- —
- Eligible?
- —
No personal income docs; deal must DSCR.
Hard money
10% down · 12.0% · 12mo
- Down + closing
- —
- Monthly P&I
- —
- Monthly cashflow
- —
- DSCR
- —
- Eligible?
- —
Short-term bridge; refi at stabilization.
Listing history 20 events
-
2026-06-21days on market $198,900 Active 48 DOM
-
2026-06-21days on market $198,900 Active 47 DOM
-
2026-06-18days on market $198,900 Active 45 DOM
-
2026-06-17days on market $198,900 Active 44 DOM
-
2026-06-16days on market $198,900 Active 43 DOM
-
2026-06-15days on market $198,900 Active 42 DOM
-
2026-06-13days on market $198,900 Active 40 DOM
-
2026-06-12remarks 649-char remark
-
2026-06-12pricedays on market $198,900 Active 39 DOM
-
2026-06-09days on market $224,900 Active 36 DOM
-
2026-06-08days on market $224,900 Active 35 DOM
-
2026-06-08days on market $224,900 Active 34 DOM
-
2026-06-07days on market $224,900 Active 33 DOM
-
2026-06-04days on market $224,900 Active 30 DOM
-
2026-06-02days on market $224,900 Active 29 DOM
-
2026-06-01days on market $224,900 Active 28 DOM
-
2026-05-31days on market $224,900 Active 27 DOM
-
2026-05-04$224,900 Active 150-char remark
-
2026-04-21historical $224,900 150-char remark
-
2000-09-08soldstatus $16,000
ⓘ Source: listings_history table (triggers on properties + properties_extension) + one-shot
backfill from property_details.listing_events for pre-trigger history.
Tax reassessment forecast OH · Partial reset (capped growth)
- Current annual tax
- $3,218 · $268/mo
- Projected year-2 tax
- $3,218 · $268/mo
- Expected delta
- $0/yr ($0/mo · 0.0%)
ⓘ Screening estimate from a state-policy table — verify with the county assessor before closing.
Climate risk First Street
- Flood 1/10 Low FEMA zone X (unshaded) · 0% chance over 30 yrs
- Wildfire 3/10 Moderate
- Heat 3/10 Moderate 7 d/yr ≥99°F today · 17 d/yr by 30 yrs out
- Wind 2/10 Low
- Air quality 2/10 Low 1 unhealthy d/yr today · 2 by 30 yrs out
Nearby sold comps map
Loading sold comps map…
Walkable amenities ~0.75 mi
Loading nearby amenities…
Taxation est. · year 1
- Rental income
- $16,256
- − Mortgage interest
- −$11,141
- − Property taxes
- −$3,218
- − Insurance
- −$994
- − Repairs & maintenance
- −$1,301
- − Management
- −$1,301
- − Depreciation
- −$5,786
- Taxable loss
- −$7,485
- Est. tax savings @ 24.0%
- +$1,796
- After-tax cash flow
- $-2,091/yr
For passive investors: Depreciation is non-cash, so a rental often shows a tax loss while cash-flowing — sheltering income. Rental losses are passive: they offset passive income freely, and up to $25,000/yr can offset ordinary (W-2) income if you actively participate and your MAGI is under $100k (phasing out to $0 by $150k); unused losses carry forward. On sale, claimed depreciation is recaptured at up to 25%, and gains may owe capital-gains tax (a 1031 exchange can defer both). Figures are a year-1 estimate at your 24.0% rate — not tax advice; consult a CPA.
Schools (NCES district)
- District
- Pike-Delta-York Local
- NCES district ID
- 3904708
- Math proficiency
- 71% ▼ -8.00%
- Reading proficiency
- 70% ▼ -10.00%
- Median HH income
- $54,734
- Composite
- 60.24/100
- National rank
- #860
- State rank
- #142 of 656 in OH
Livability — Delta
- Score
- 77/100
- State rank
- #192
- US rank
- #2924
Category grades
Schools grade is shown separately in the Schools card above.
Census & demographics
- County
- Fulton · 33,657 people
- Metro
- Toledo, OH
- Population (ZIP)
- 8,139
- Household income
- $77,654
- Rent vs Own
- Severe rent burden
- 3.9
Population outlook (Fulton County) Hauer SSP2
- Today (2025)
- 41,958 people
- By 2030
- 41,130 · -2.0%
- By 2040
- 38,760 · -7.6%
- By 2050
- 36,040 · -14.1%
- By 2075
- 30,793 · -26.6%
- By 2100
- 25,429 · -39.4%
Race, ethnicity, and origin ACS 2023
- Neighborhood character
- Predominantly White (89%)
- Race & ethnicity
- White 89% Hispanic / Latino 9% Two or more races 6% Native American 1%
- Hispanic origin (detail)
- Mexican 8%
- Common ancestry
- Romanian 5% Slovak 3% Lithuanian 2%
- Foreign-born
- 1% · Canada
- Languages at home
- 97% English-only · Spanish 3%
Political lean MEDSL · Fulton
- 2024 margin
- Solid R (+42.4) · D 28.4% · R 70.8%
- 2008→2024 swing
- -34.3pp toward R · 2008: -8.1pp · 2024: -42.4pp
- All cycles
- 2024: R+42.4 2020: R+39.8 2016: R+36.0 2012: R+13.2 2008: R+8.1
Not yet ingested
- Civics
- —
Market trends
- HPI YoY
- ▼ -36.56%
- Current HPI
- 217.8733
- Rent YoY
- —
- Metro
- —
- State GDP YoY
- ▲ 1.98%
- F500 in state
- 48
Industry mix (Fortune 500 HQ in OH)
| Industry | F500 HQs | Revenue |
|---|---|---|
| Insurance | 3 | $145B |
|
||
| Industrial Machinery | 3 | $49B |
|
||
| Financial Services | 3 | $24B |
|
||
| Consumer Goods | 2 | $93B |
|
||
| Aerospace / Defense | 2 | $47B |
|
||
| Utilities | 2 | $33B |
|
||
Price history
+1143.1% since first listed4 events — show timeline
- 2026-06-11 Price Changed $198,900 NORIS
- 2026-05-04 Listed $224,900 NORIS
- 2026-04-21 Coming Soon $224,900 NORIS
- 2000-09-08 Sold (Public Records) $16,000 Public Records
Property tax history
+3.8%/yrLatest (2025): $3,218 · -5.6% YoY. Source: county tax records.
Cash-flow waterfall
monthlySold comps — $/sqft
last 12 mo · ≤1 miLoading sold comps…