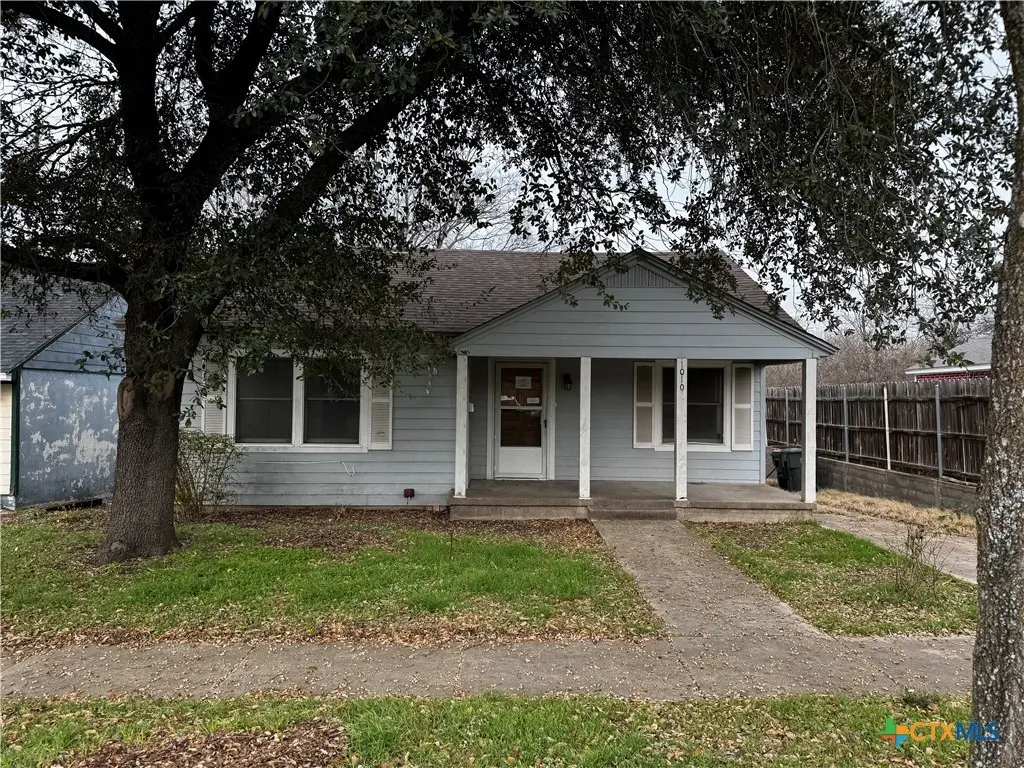
1010 S 17th St · Temple, TX
Flood risk 1/10 · Minimal
- FEMA flood zone
- X (unshaded)
- Chance of flooding over 30 yrs
- 0.0%
- Est. flood insurance / yr
- $507 – $1,088
Fire risk 1/10 · Minimal
- Est. fire insurance / yr
- $1,222 – $2,270
Heat risk 7/10 · Major
- Hot days now (above 108°F)
- 6 days/yr
- Hot days in 30 yrs
- 21 days/yr
Wind risk 6/10 · Moderate
- Chance of severe wind over 30 yrs
- 70.0%
Air-quality risk 2/10 · Minimal
- Unhealthy air days now
- 0 days/yr
- Unhealthy air days in 30 yrs
- 1 days/yr
Risk factors via First Street. Map © Google.
Why this score? — see what drove the B- grade
The composite is a weighted blend of 9 inputs, each scored 0–100. Each bar is that input's sub-score; the figure is the points it added to the 100-point composite (weight × sub-score).
- Cash flow +23.8/30.0
- ARV discount +15.0/15.0
- 1% rule +8.3/10.0
- DSCR +7.7/10.0
- Livability +3.8/5.0
- Schools +2.7/10.0
- Rent growth +2.6/5.0
- Condition / age +2.5/5.0
- Appreciation +0.0/10.0
$85,000
🖨 Deal sheet 📄 Offer letter ✓ Due diligence
Listing remarks
Check out this cozy 2 bed, 1 bath home in Temple. Add your own special touches to make it yours!!! 2 bedrooms, good size living room, eat in kitchen. Outside you have 2 storage buildings and trees. Don't wait to call!!!
Key facts
- 5,501 sq ft lot
- Built 1934
- Listed 38 days
Property features AI
Finance
- Other: City lot, less than quarter acre; Chain link fencing in back yard; City street frontage
Exterior
- Utilities: Public water; Public sewer; Public trash collection
- Home design: Single-story; Frame construction
- Construction: Frame construction; Composition/Shingle roof; Pillar/post/pier foundation; Built year source: Assessor
- Exterior features: Covered porch; Porch
Interior
- Kitchen: Kitchen (eat-in)
- Bedrooms: Two bedrooms (one labeled 'Bedroom', one labeled 'Bedroom 2')
- Flooring: Linoleum; Wood
- Bathrooms: One full bathroom
- Heating & cooling: Heating present; One cooling unit
- Interior features: Eat-in kitchen
- Laundry & utility: Dedicated laundry room; Water heater
Neighborhood map
What this means for you Summary
Snapshot
- This is a 2-bed/1.0-bath single-family listed at $85k.
Deal economics
- At list price, monthly cash flow is $164 ($2k/yr) — positive.
- The deal already cash-flows at list — no discount required.
- Meets the 1% rule at list price ($1k rent vs $85k).
- Recommended offer: $82k (3.0% below list) — sets the bar for market timing.
- Cap rate 8.6% vs local median 3.6% in Temple — top-decile yield for the area; either an underpriced asset or a hidden risk that comps aren't pricing in. Stress-test before assuming the spread holds.
Location & tenants
- Location reads 75/100 on livability (#122 in TX, #3,814 nationally) — a middle-class / working-renter tenant base. Strengths: cost of living A+, housing A+, health & safety A+; Watch: schools C-, commute C-, crime D+.
- Temple ISD (urban): math 32% / reading 31% proficiency, ranked #590 of 826 in TX (top 71%) — families likely to look elsewhere, expect single-tenant / working-renter base with shorter leases; 66% free/reduced lunch — lower-income household profile, screen leases tightly.
- Market conditions: Rents flat; 276 active listings in the ZIP; 40 comparable units currently listed for rent nearby; rentals at typical pace (median 21d on market — plan ~3-4 weeks tenant-placement turnaround); 3,222 units permitted in Bell County in 2024 (246 in 5+ unit buildings).
Forward outlook
- Local home prices are declining (-3.0%/yr); year-one equity from $588 of loan paydown is wiped out by about $3k of value loss. Plan a longer hold.
- Bell County population projected at +21% by 2050 — long-run rental-demand tailwind backs the buy-and-hold thesis.
Negotiation context
- It's been on market 38 days — a 3% lower offer ($82k) is reasonable based on typical stale-listing flexibility.
- 3 sale attempts since 2y ago; this cycle's ask has dropped $5k (6%) from the opening price — seller is motivated, your offer sets the floor, not the list.
Risks & watch-outs
- Watch-outs: property tax is 3.5% of price; built in 1934 — expect roof / HVAC / electrical / plumbing capex.
- Climate carrying-cost: major wind risk, 70% chance of damaging wind over 30y; extreme-heat days projected 6→21/yr by 2055 (HVAC capex compounding) — expect insurance premiums to compound above CPI over the hold.
Questions for the listing agent
- It's been on market 38 days. Have you received any prior offers? Is the seller open to a 3% concession, seller financing, or rate buy-down credit?
- Built in 1934 — when were the roof, HVAC, electrical panel, plumbing, and water heater last replaced?
- Property tax is high relative to price — has the assessment been appealed recently, and will the sale trigger a re-assessment?
- Is there a deadline driving the sale (1031 exchange, divorce, estate, relocation)? That informs how much negotiation room exists.
- Crime grade is D in this area — have there been break-ins, vandalism, or insurance claims at this property in the last 3 years? What carrier currently insures it and at what premium?
- What's the average days-on-market for RENTAL listings here right now (not sales)? A rising rental-DOM trend means longer vacancies and softer asking-rent achievability than the comps imply.
- What's the recent tenant-quality profile in this submarket — average credit score on applications, eviction rate, late-payment / NSF rate, and stable-employment percentage? A property-management company in the area should have these aggregated.
- How much new for-sale + rental construction is in the pipeline within 1–3 miles? Heavy new supply typically softens prices + rents 12–24 months out; constrained supply supports both.
Investment metrics
- 1% rule
- 1.33% ✓
- Cap rate
- 8.60%
- Cash-on-cash
- 8.25%
- DSCR
- 1.37
- GRM
- 6.3
CMA / ARV
- ARV (median comp)
- $132,500
- List price
- $85,000
- Delta
- -35.85%
- Verdict
- UNDERPRICED
- Comps
- 20 within 1.0 mi
Show comp detail 10 sales within ~0.75 mi
| Address | Dist | Beds/Ba | Sqft | Sold | Price | $/sf | Match |
|---|---|---|---|---|---|---|---|
| 806 S 23rd St | 0.27mi | 2/1.0 | 973 (+6%) | 8mo | $55,000 | $57 | 72 |
| 1014 S 29th St | 0.41mi | 2/1.0 | 981 (+7%) | 1mo | $60,000 | $61 | 69 |
| 1506 S 9th St | 0.37mi | 2/1.0 | 830 (-10%) | 0mo | $150,000 | $181 | 66 |
| 202 S 25th St | 0.68mi | 2/1.0 | 904 (-2%) | 8mo | $90,000 | $100 | 59 |
| 1514 S 13th St | 0.33mi | 3/1.0 (+1) | 999 (+9%) | 9mo | $150,000 | $150 | 57 |
| 1814 S 7th St | 0.59mi | 2/1.0 | 840 (-9%) | 8mo | $159,900 | $190 | 51 |
| 718 S 19th St | 0.23mi | 3/2.0 (+1) | 1,000 (+9%) | 20mo | $61,000 | $61 | 50 |
| 1907 S 15th St | 0.57mi | 2/1.0 | 784 (-15%) | 7mo | $100,000 | $128 | 43 |
| 1506 S 11th St | 0.34mi | 3/1.5 (+1) | 1,056 (+15%) | 22mo | $185,000 | $175 | 34 |
| 309 S 31st St | 0.70mi | 1/1.0 (-1) | 788 (-14%) | 6mo | $75,000 | $95 | 33 |
Match score weights: distance 35% · size 25% · config 20% · recency 20%. Top-matched comps best support the ARV.
Projected returns pro-forma
-3.0% appreciation · 0.33% rent growth · sell at horizon
- IRR
- -7.3%
- Equity multiple
- 0.74×
- Total profit
- $-6,203
- Equity at exit
- $12,674
- IRR
- -2.2%
- Equity multiple
- 0.87×
- Total profit
- $-3,059
- Equity at exit
- $7,349
Cash invested: $23,800 (down + closing). Projections, not guarantees.
Landlord ↔ Tenant lean methodology
- Overall (STATE)
- 87 Strongly Landlord-Friendly
- State Texas
- 87 Strongly Landlord-Friendly · R+5
- County
- — inherits STATE
- City
- — inherits STATE
ZIP-level market 76504
- Rents YoY
- 0.3%
- Active inventory
- 276
- Price-to-rent
- 6.3×
Monthly cashflow live
- Estimated rent
- $1,130 high interval (Pro) →
- Mortgage (P&I)
- −$446
- Tax from tax record
- −$248 /mo · $2,976/yr
- Insurance
- −$35
- HOA
- −$0
- Vacancy / Maint / Mgmt
- −$237
- Net cashflow
- $164
Break-even live
UW: 25.0% down · 7.5% · 30yr · 1.5% tax · 5.0% vac · 8.0% maint · 8.0% mgmt
Financing live
Cash to close
- Down payment
- $21,250
- Closing costs
- $2,550
- Reserves months
- —
- Total cash needed
- —
Loan-product check · same deal, 3 products live
Conventional
25% down · 7.5% · 30yr
- Down + closing
- —
- Monthly P&I
- —
- Monthly cashflow
- —
- DSCR
- —
- Eligible?
- —
Personal DTI + credit; lowest rate.
DSCR
20% down · 8.5% · 30yr
- Down + closing
- —
- Monthly P&I
- —
- Monthly cashflow
- —
- DSCR
- —
- Eligible?
- —
No personal income docs; deal must DSCR.
Hard money
10% down · 12.0% · 12mo
- Down + closing
- —
- Monthly P&I
- —
- Monthly cashflow
- —
- DSCR
- —
- Eligible?
- —
Short-term bridge; refi at stabilization.
Rent comps 40 comps
| Address | Beds | Baths | Sqft | Rent | $/sqft | DOM | Units | Dist |
|---|---|---|---|---|---|---|---|---|
| 1205 S 17th St Temple, TX | 2.0 | 1.0 | 840 | $625 | $0.74 | 23d | 1 | 0.07mi |
| 1305 S 21st St Temple, TX | 2.0 | 1.0 | 900 | $1,150 | $1.28 | 43d | 1 | 0.18mi |
| 902 S 23rd St Temple, TX | 3.0 | 1.0 | 1040 | $1,200 | $1.15 | 23d | 1 | 0.25mi |
| 1117 S 9th St Unit B Temple, TX | 3.0 | 1.0 | 900 | $850 | $0.94 | 23d | 1 | 0.26mi |
| 1201 S 25th St Temple, TX | 2.0 | 1.0 | 852 | $1,265 | $1.48 | 23d | 1 | 0.26mi |
| 806 S 23rd St Temple, TX | 3.0 | 2.0 | 1000 | $1,445 | $1.45 | 13d | 1 | 0.29mi |
| 1511 S 11th St Temple, TX | 2.0 | 1.0 | 735 | $1,095 | $1.49 | 13d | 1 | 0.34mi |
| 1001 S 29th St Temple, TX | 3.0 | 1.0 | 1080 | $1,400 | $1.30 | 23d | 1 | 0.41mi |
| 1615 S 11th St Temple, TX | 2.0 | 1.0 | 1076 | $1,995 | $1.85 | 13d | 1 | 0.41mi |
| 1518 S 7th St Temple, TX | 2.0 | 1.0 | 965 | $1,100 | $1.14 | 23d | 1 | 0.41mi |
| 1107 S 33rd St Unit B Temple, TX | 2.0 | 2.0 | 1009 | $1,150 | $1.14 | 13d | 1 | 0.53mi |
| 1404 West Ave E Unit A Temple, TX | 1.0 | 1.0 | 800 | $895 | $1.12 | 13d | 1 | 0.58mi |
| 1404 West Ave E Unit B Temple, TX | 1.0 | 1.0 | 800 | $995 | $1.24 | 13d | 1 | 0.58mi |
| 1002 S 2nd St Temple, TX | 3.0 | 1.0 | 1064 | $1,325 | $1.25 | 21d | 1 | 0.59mi |
| 1409 S 35th St Temple, TX | 2.0 | 1.0 | 1000 | $1,195 | $1.20 | 43d | 1 | 0.65mi |
| 1802 West Avenue H Unit A Temple, TX | 1.0 | 1.0 | 730 | $700 | $0.96 | 43d | 1 | 0.67mi |
| 1802 West Avenue H Unit D Temple, TX | 2.0 | 1.0 | 700 | $850 | $1.21 | 43d | 1 | 0.67mi |
| 1321 S 39th St Temple, TX | 2.0 | 2.0 | 1006 | $1,200 | $1.19 | 43d | 1 | 0.76mi |
| 1118 Martin Luther King Junior Dr Unit D Temple, TX | 1.0 | 1.0 | 572 | $750 | $1.31 | 13d | 1 | 0.77mi |
| 814 S Martin Luther King Blvd Temple, TX | 3.0 | 2.0 | 1035 | $1,100 | $1.06 | 13d | 1 | 0.79mi |
| 1219 S 10th St Temple, TX | 3.0 | 1.0 | 1080 | $1,050 | $0.97 | 43d | 1 | 0.87mi |
| 2405 S 13th St Temple, TX | 1.0–2.0 | 1.0–2.0 | 835 | $1,065 | $1.28 | 13d | 4 | 0.91mi |
| 603 East Avenue M Unit B Temple, TX | 3.0 | 1.0 | 900 | $945 | $1.05 | 43d | 1 | 0.96mi |
| 205 N 21st St Temple, TX | 3.0 | 1.0 | 950 | $998 | $1.05 | 43d | 1 | 0.99mi |
| 2102 Scott Blvd Temple, TX | 1.0–3.0 | 1.0–2.0 | 924 | $1,717 | $1.86 | 13d | 22 | 1.01mi |
| 4 N 4th St Temple, TX | 1.0 | 1.0 | 752 | $1,400 | $1.86 | 43d | 1 | 1.04mi |
| 640 SW H K Dodgen Loop Temple, TX | 1.0–2.0 | 1.0–2.0 | 857 | $1,899 | $2.22 | 13d | 1 | 1.07mi |
| 703 S 16th St Temple, TX | 3.0 | 2.0 | 1090 | $1,035 | $0.95 | 13d | 1 | 1.10mi |
| 708 Henderson St Temple, TX | 3.0 | 2.0 | 1090 | $1,025 | $0.94 | 13d | 1 | 1.12mi |
| 15 S 10th St Temple, TX | 3.0 | 1.0 | 916 | $950 | $1.04 | 43d | 1 | 1.13mi |
| 509 S 16th St Temple, TX | 3.0 | 2.0 | 1090 | $1,065 | $0.98 | 13d | 1 | 1.14mi |
| 505 S 16th St Temple, TX | 3.0 | 2.0 | 1090 | $1,070 | $0.98 | 13d | 1 | 1.15mi |
| 2510 S 31st St Temple, TX | 1.0–3.0 | 1.0–2.0 | 987 | $1,318 | $1.34 | 13d | 26 | 1.16mi |
| 503 Henderson St Temple, TX | 3.0 | 2.0 | 1090 | $1,015 | $0.93 | 13d | 1 | 1.19mi |
| 518 S Knob St Unit B Temple, TX | 3.0 | 2.0 | 1090 | $1,015 | $0.93 | 13d | 1 | 1.20mi |
| 514 E Central Ave Unit B Temple, TX | 1.0 | 1.0 | 560 | $695 | $1.24 | 13d | 1 | 1.20mi |
| 510 S Knob St Unit A Temple, TX | 1.0 | 1.0 | 560 | $650 | $1.16 | 43d | 1 | 1.21mi |
| 701 East Avenue A Unit A Temple, TX | 3.0 | 2.0 | 1090 | $1,349 | $1.24 | 13d | 1 | 1.22mi |
| 513 S Knob St Unit B Temple, TX | 1.0 | 1.0 | 560 | $550 | $0.98 | 43d | 1 | 1.23mi |
| 714 S 20th St Unit B Temple, TX | 2.0 | 1.0 | 650 | $750 | $1.15 | 43d | 1 | 1.25mi |
Listing history 23 events
-
2026-06-18status $85,000 Pending 38 DOM
-
2026-06-18days on market $85,000 Active 38 DOM
-
2026-06-17days on market $85,000 Active 37 DOM
-
2026-06-16days on market $85,000 Active 36 DOM
-
2026-06-15days on market $85,000 Active 35 DOM
-
2026-06-14days on market $85,000 Active 33 DOM
-
2026-06-10days on market $85,000 Active 30 DOM
-
2026-06-09days on market $85,000 Active 29 DOM
-
2026-06-08days on market $85,000 Active 28 DOM
-
2026-06-07days on market $85,000 Active 27 DOM
-
2026-06-03days on market $85,000 Active 23 DOM
-
2026-06-02days on market $85,000 Active 22 DOM
-
2026-06-01days on market $85,000 Active 21 DOM
-
2026-05-31days on market $85,000 Active 20 DOM
-
2026-05-30days on market $85,000 Active 19 DOM
-
2026-05-18price $85,000 219-char remark
-
2026-05-11$90,000 Active 219-char remark
-
2026-04-07historical
-
2026-02-19$90,000 Active
-
2024-05-01status Pending
-
2024-04-30soldstatus
-
2024-04-09historical Active Under Contract
-
2024-03-24$139,000 Active
ⓘ Source: listings_history table (triggers on properties + properties_extension) + one-shot
backfill from property_details.listing_events for pre-trigger history.
Tax reassessment forecast TX · Resets to sale price
- Current annual tax
- $2,976 · $248/mo
- Projected year-2 tax
- $2,976 · $248/mo
- Expected delta
- $0/yr ($0/mo · 0.0%)
ⓘ Screening estimate from a state-policy table — verify with the county assessor before closing.
Climate risk First Street
- Flood 1/10 Low FEMA zone X (unshaded) · 0% chance over 30 yrs
- Wildfire 1/10 Low
- Heat 7/10 Severe 6 d/yr ≥108°F today · 21 d/yr by 30 yrs out
- Wind 6/10 Major 70% chance of damaging wind over 30 yrs
- Air quality 2/10 Low 0 unhealthy d/yr today · 1 by 30 yrs out
Nearby sold comps map
Loading sold comps map…
Walkable amenities ~0.75 mi
Loading nearby amenities…
Taxation est. · year 1
- Rental income
- $13,563
- − Mortgage interest
- −$4,761
- − Property taxes
- −$2,976
- − Insurance
- −$425
- − Repairs & maintenance
- −$1,085
- − Management
- −$1,085
- − Depreciation
- −$2,473
- Taxable income
- $757
- Est. tax owed @ 24.0%
- −$182
- After-tax cash flow
- $1,782/yr
For passive investors: Depreciation is non-cash, so a rental often shows a tax loss while cash-flowing — sheltering income. Rental losses are passive: they offset passive income freely, and up to $25,000/yr can offset ordinary (W-2) income if you actively participate and your MAGI is under $100k (phasing out to $0 by $150k); unused losses carry forward. On sale, claimed depreciation is recaptured at up to 25%, and gains may owe capital-gains tax (a 1031 exchange can defer both). Figures are a year-1 estimate at your 24.0% rate — not tax advice; consult a CPA.
Schools (NCES district)
- District
- Temple ISD
- NCES district ID
- 4842330
- Math proficiency
- 32% ▼ -8.00%
- Reading proficiency
- 31% ▼ -4.00%
- Median HH income
- $43,120
- Composite
- 26.8/100
- National rank
- #7123
- State rank
- #590 of 826 in TX
Livability — Temple
- Score
- 75/100
- State rank
- #122
- US rank
- #3814
Category grades
Schools grade is shown separately in the Schools card above.
Census & demographics
- Census place
- Temple, TX
- County
- Bell County · 345,090 people
- City population
- 96,587
- Metro
- Killeen-Temple, TX
- Population (ZIP)
- 26,166
- Household income
- $52,803
- Rent vs Own
- Severe rent burden
- 1489.0
Population outlook (Bell County) Hauer SSP2
- Today (2025)
- 371,114 people
- By 2030
- 389,104 · +4.8%
- By 2040
- 420,592 · +13.3%
- By 2050
- 447,779 · +20.7%
- By 2075
- 499,130 · +34.5%
- By 2100
- 505,680 · +36.3%
Race, ethnicity, and origin ACS 2023
- Neighborhood character
- Diverse neighborhood (Simpson 0.65)
- Race & ethnicity
- White 49% Hispanic / Latino 29% Black 15% Two or more races 14% Asian 1%
- Hispanic origin (detail)
- Mexican 24% Puerto Rican 2%
- Common ancestry
- Italian 2% Romanian 2% Lithuanian 1%
- Foreign-born
- 8% · Canada
- Languages at home
- 81% English-only · Spanish 17% Other Indo-European 1%
Political lean MEDSL · Bell
- 2024 margin
- R (+16.2) · D 41.3% · R 57.6% · Other 1.1%
- 2008→2024 swing
- -6.5pp toward R · 2008: -9.8pp · 2024: -16.2pp
- All cycles
- 2024: R+16.2 2020: R+8.5 2016: R+15.1 2012: R+16.4 2008: R+9.8
Not yet ingested
- Civics
- —
Market trends
- HPI YoY
- ▼ -159.28%
- Current HPI
- 186.1148
- Rent YoY
- ▲ 0.33%
- Metro
- Killeen-Temple, TX
- State GDP YoY
- ▲ 3.95%
- F500 in state
- 110
Industry mix (Fortune 500 HQ in TX)
| Industry | F500 HQs | Revenue |
|---|---|---|
| Energy | 16 | $1,198B |
|
||
| Technology | 5 | $198B |
|
||
| Engineering / Construction | 4 | $72B |
|
||
| Energy Services | 3 | $60B |
|
||
| Utilities | 3 | $41B |
|
||
| Healthcare | 2 | $330B |
|
||
Price history
-38.8% since first listed8 events — show timeline
- 2026-05-18 Price Changed $85,000 CTXMLS
- 2026-05-11 Listed $90,000 CTXMLS
- 2026-04-07 Listing Removed — CTXMLS
- 2026-02-19 Listed $90,000 CTXMLS
- 2024-05-01 Pending — CTXMLS
- 2024-04-30 Sold (Public Records) — Public Records
- 2024-04-09 Contingent — CTXMLS
- 2024-03-24 Listed $139,000 CTXMLS
Property tax history
+8.4%/yrLatest (2026): $2,976 · -7.8% YoY. Source: county tax records.
Cash-flow waterfall
monthlySold comps — $/sqft
last 12 mo · ≤1 miLoading sold comps…