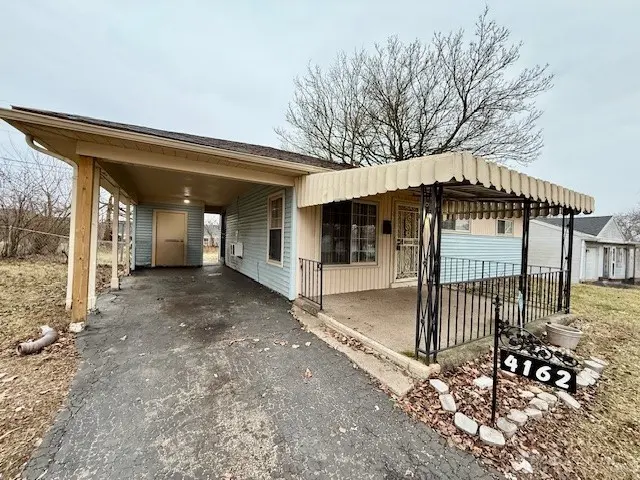
4162 Redonda Ln · Trotwood, OH
Flood risk 1/10 · Minimal
- FEMA flood zone
- X (unshaded)
- Chance of flooding over 30 yrs
- 0.0%
- Est. flood insurance / yr
- $507 – $1,088
Fire risk 1/10 · Minimal
- Est. fire insurance / yr
- $713 – $1,323
Heat risk 3/10 · Minor
- Hot days now (above 103°F)
- 7 days/yr
- Hot days in 30 yrs
- 18 days/yr
Wind risk 2/10 · Minimal
- Chance of severe wind over 30 yrs
- —
Air-quality risk 3/10 · Minor
- Unhealthy air days now
- 3 days/yr
- Unhealthy air days in 30 yrs
- 4 days/yr
Risk factors via First Street. Map © Google.
Why this score? — see what drove the D grade
The composite is a weighted blend of 9 inputs, each scored 0–100. Each bar is that input's sub-score; the figure is the points it added to the 100-point composite (weight × sub-score).
- Cash flow +22.1/30.0
- DSCR +7.1/10.0
- 1% rule +5.0/10.0
- Livability +3.0/5.0
- Rent growth +2.5/5.0
- Condition / age +2.5/5.0
- Schools +1.3/10.0
- ARV discount +0.0/15.0
- Appreciation +0.0/10.0
$115,000
🖨 Deal sheet (PDF) 📄 Offer letter ✓ Due diligence
Listing remarks MLS
Refreshed home located in Trotwood. Updates in the last year include new carpet, interior paint, vanity, ceiling fans, painted kitchen cabinets and appliances. Enjoy a fence in yard with a concrete pad making it a great place to entertain. The home has a covered front porch. The attached carport provides protection from the elements, and this property also includes two sheds. Tucked Ina location close to grocery stores, restaurants, and everyday essentials. Seller prefers signed contract before disrupting the tenant. Currently rented at $1100.00 and lease ends 2/28/27.
Key facts
- Covered front porch
- Concrete pad
- Attached carport
Tags
Neighborhood map
What this means for you Summary
Snapshot
- This is a 3-bed/1.5-bath single-family listed at $115k.
Deal economics
- At list price, monthly cash flow is $185 ($2k/yr) — positive.
- The deal already cash-flows at list — no discount required.
- Meets the 1% rule at list price ($1k rent vs $115k).
- Recommended offer: $108k (6.0% below list) — sets the bar for market timing.
- Cap rate 8.2% vs local median 6.5% in Trotwood — meaningfully above typical; check what's discounted (condition, days-on-market, listing class) to confirm the premium yield is real.
Location & tenants
- Location reads 59/100 on livability (#1,014 in OH) — a working-class tenant base; expect higher turnover. Strengths: cost of living A+, housing A; Watch: employment D, crime F, amenities F.
- Dayton City (urban): math 12% / reading 21% proficiency, ranked #641 of 656 in OH (top 98%) — low school quality limits family demand, transient renter base, plan for 1-2y turnover; 74% free/reduced lunch — lower-income household profile, screen leases tightly.
- Zoned schools: River'S Edge Montessori Elementary School (math 22% / reading 32%, grade F, #1,193 of 1,584 statewide, top 76%, 494 students, 0% FRL); Belmont High School (math 5% / reading 20%, grade F, #720 of 781 statewide, top 93%, 1,100 students, 0% FRL) — zoned schools average 0% FRL vs 74% district-wide (74 pts lower); this property's tenant base skews higher-income than the district average.
- Market conditions: 30 active listings in the ZIP; 21 comparable units currently listed for rent nearby; rentals at typical pace (median 26d on market — plan ~3-4 weeks tenant-placement turnaround); 907 units permitted in Montgomery County in 2024 (416 in 5+ unit buildings).
Forward outlook
- Local home prices are declining (-3.0%/yr); year-one equity from $795 of loan paydown is wiped out by about $3k of value loss. Plan a longer hold.
- Montgomery County population projected at -10% by 2050 — secular population decline; favor cash flow + early exit over multi-decade hold.
Negotiation context
- It's been on market 85 days — a 6% lower offer ($108k) is reasonable based on typical stale-listing flexibility.
- 11 sale attempts since 3y ago with the ask held roughly flat each time — persistent listings suggest the price (not the market) is what's stuck; bring a comps-based counter.
- Current owner paid $67k; list at $115k implies a 72% gain — meaningful room to come down on a strong offer.
Risks & watch-outs
- Watch-outs: built in 1954 — expect roof / HVAC / electrical / plumbing capex.
Questions for the listing agent
- It's been on market 85 days. Have you received any prior offers? Is the seller open to a 6% concession, seller financing, or rate buy-down credit?
- Built in 1954 — when were the roof, HVAC, electrical panel, plumbing, and water heater last replaced?
- Why hasn't it sold? Are there any deal-killer items the seller is aware of (foundation, flood, title, zoning, code violations)?
- Is there a deadline driving the sale (1031 exchange, divorce, estate, relocation)? That informs how much negotiation room exists.
- Schools are F-rated, which usually means shorter tenancies and higher turnover. Who's the typical renter profile here, and what's been the actual vacancy rate?
- Crime grade is F in this area — have there been break-ins, vandalism, or insurance claims at this property in the last 3 years? What carrier currently insures it and at what premium?
- The area grade is low — what's the realistic commute time and amenity access for the typical tenant pool here? Any planned neighborhood developments (good or bad) we should know about?
- What's the average days-on-market for RENTAL listings here right now (not sales)? A rising rental-DOM trend means longer vacancies and softer asking-rent achievability than the comps imply.
- What's the recent tenant-quality profile in this submarket — average credit score on applications, eviction rate, late-payment / NSF rate, and stable-employment percentage? A property-management company in the area should have these aggregated.
- How much new for-sale + rental construction is in the pipeline within 1–3 miles? Heavy new supply typically softens prices + rents 12–24 months out; constrained supply supports both.
Investment metrics
- 1% rule
- 1.00% ✓
- Cap rate
- 8.22%
- Cash-on-cash
- 6.88%
- DSCR
- 1.31
- GRM
- 8.3
CMA / ARV
- ARV (median comp)
- $94,375
- List price
- $115,000
- Delta
- 21.85%
- Verdict
- OVERPRICED
- Comps
- 20 within 1.0 mi
Show comp detail 12 sales within ~0.75 mi
| Address | Dist | Beds/Ba | Sqft | Sold | Price | $/sf | Match |
|---|---|---|---|---|---|---|---|
| 3678 Wilmore St | 0.14mi | 3/1.5 | 864 (0%) | 3mo | $131,900 | $153 | 91 |
| 4288 Redonda Ln | 0.12mi | 3/2.0 | 864 (0%) | 4mo | $125,000 | $145 | 89 |
| 4460 Curundu Ave | 0.30mi | 3/1.0 | 864 (0%) | 3mo | $80,000 | $93 | 81 |
| 4563 Nevada Ave | 0.42mi | 3/1.0 | 884 (+2%) | 0mo | $94,000 | $106 | 74 |
| 4601 Curundu Ave | 0.43mi | 3/1.0 | 884 (+2%) | 5mo | $92,000 | $104 | 70 |
| 2660 Grant Ave | 0.47mi | 3/1.5 | 912 (+6%) | 2mo | $78,000 | $86 | 67 |
| 3997 Mayview Dr | 0.55mi | 3/1.0 | 884 (+2%) | 3mo | $81,000 | $92 | 66 |
| 4703 Natchez Ave | 0.59mi | 3/1.0 | 884 (+2%) | 5mo | $83,000 | $94 | 62 |
| 3538 Pittsburg Ave | 0.65mi | 2/1.0 (-1) | 864 (0%) | 3mo | $109,900 | $127 | 60 |
| 3656 Detroit Ave | 0.47mi | 2/1.0 (-1) | 967 (+12%) | 3mo | $102,000 | $105 | 49 |
| 3942 Beatty Dr | 0.59mi | 2/1.0 (-1) | 768 (-11%) | 0mo | $33,110 | $43 | 47 |
| 4247 Otis Dr | 0.71mi | 3/1.0 | 984 (+14%) | 2mo | $120,000 | $122 | 40 |
Match score weights: distance 35% · size 25% · config 20% · recency 20%. Top-matched comps best support the ARV.
Projected returns pro-forma
-3.0% appreciation · 3.0% rent growth · sell at horizon
- IRR
- -5.8%
- Equity multiple
- 0.79×
- Total profit
- $-6,902
- Equity at exit
- $17,147
- IRR
- 3.9%
- Equity multiple
- 1.28×
- Total profit
- $9,031
- Equity at exit
- $9,943
Cash invested: $32,200 (down + closing). Projections, not guarantees.
Landlord ↔ Tenant lean methodology
- Overall (STATE)
- 73 Landlord-Friendly
- State Ohio
- 73 Landlord-Friendly · R+6
- County
- — inherits STATE
- City
- — inherits STATE
ZIP-level market 45416
- Home prices YoY
- -26.1%
- Active inventory
- 30
- Price-to-rent
- 8.3×
Monthly cashflow live
- Estimated rent
- $1,154 high interval (Pro) →
- Mortgage (P&I)
- −$603
- Tax from tax record
- −$76 /mo · $911/yr
- Insurance
- −$48
- HOA
- −$0
- Vacancy / Maint / Mgmt
- −$242
- Net cashflow
- $185
Break-even live
Sensitivity live
| Price | -10% $250 | -5% $217 | +0% $185 | +5% $152 | +10% $119 |
|---|---|---|---|---|---|
| Rent | -10% $93 | -5% $139 | +0% $185 | +5% $230 | +10% $276 |
| Rate | -1.0pp $243 | -0.5pp $214 | base $185 | +0.5pp $155 | +1.0pp $124 |
UW: 25.0% down · 7.5% · 30yr · 1.5% tax · 5.0% vac · 8.0% maint · 8.0% mgmt
Financing live
Cash to close
- Down payment
- $28,750
- Closing costs
- $3,450
- Reserves months
- —
- Total cash needed
- —
Loan-product check · same deal, 3 products live
Conventional
25% down · 7.5% · 30yr
- Down + closing
- —
- Monthly P&I
- —
- Monthly cashflow
- —
- DSCR
- —
- Eligible?
- —
Personal DTI + credit; lowest rate.
DSCR
20% down · 8.5% · 30yr
- Down + closing
- —
- Monthly P&I
- —
- Monthly cashflow
- —
- DSCR
- —
- Eligible?
- —
No personal income docs; deal must DSCR.
Hard money
10% down · 12.0% · 12mo
- Down + closing
- —
- Monthly P&I
- —
- Monthly cashflow
- —
- DSCR
- —
- Eligible?
- —
Short-term bridge; refi at stabilization.
Rent comps 21 comps
| Address | Beds | Baths | Sqft | Rent | $/sqft | DOM | Units | Dist |
|---|---|---|---|---|---|---|---|---|
| 4132 Natchez Ave Dayton, OH | 3.0 | 1.5 | 991 | $1,250 | $1.26 | 5d | 1 | 0.31mi |
| 3711 Pittsburg Ave Dayton, OH | 2.0 | 1.0 | 800 | $875 | $1.09 | 45d | 1 | 0.39mi |
| 3858 Haney Rd Dayton, OH | 2.0 | 1.0 | 850 | $825 | $0.97 | 4d | 1 | 0.50mi |
| 4527 Channing Ln Dayton, OH | 3.0 | 1.0 | 946 | $1,600 | $1.69 | 45d | 1 | 0.65mi |
| 2408 Falmouth Ave Dayton, OH | 2.0 | 1.0 | 806 | $950 | $1.18 | 25d | 1 | 0.70mi |
| 2609 Fairport Ave Dayton, OH | 3.0 | 1.0 | 1000 | $1,025 | $1.02 | 4d | 1 | 0.73mi |
| 2501 Fairport Ave Dayton, OH | 2.0 | 1.0 | 605 | $850 | $1.40 | 45d | 1 | 0.73mi |
| 4161 Mapleleaf Dr Dayton, OH | 3.0 | 1.0 | 960 | $1,250 | $1.30 | 4d | 1 | 0.79mi |
| 4365 Parkway Dr Trotwood, OH | 2.0 | 1.0 | 600 | $800 | $1.33 | 45d | 1 | 0.80mi |
| 4425 Thompson Dr Dayton, OH | 3.0 | 1.0 | 864 | $1,150 | $1.33 | 4d | 1 | 0.81mi |
| 5112 W Hillcrest Ave Unit 1 Dayton, OH | 3.0 | 1.0 | 972 | $700 | $0.72 | 25d | 1 | 0.82mi |
| 4003 Whitestone Ct Dayton, OH | 3.0 | 1.0 | 1096 | $1,275 | $1.16 | 45d | 1 | 0.85mi |
| 4446 Waymire Ave Dayton, OH | 3.0 | 1.0 | 1100 | $1,100 | $1.00 | 23d | 1 | 0.89mi |
| 2002 Val Vista Ct Dayton, OH | 3.0 | 1.0 | 975 | $1,095 | $1.12 | 23d | 1 | 0.95mi |
| 2014 Hickorydale Dr Unit 2016 Dayton, OH | 2.0 | 1.0 | 800 | $900 | $1.12 | 45d | 1 | 1.03mi |
| 4629 Queens Ave Dayton, OH | 2.0 | 1.0 | 900 | $1,100 | $1.22 | 45d | 1 | 1.09mi |
| 1720 Kings Mill Ct Dayton, OH | 2.0 | 1.5 | 975 | $925 | $0.95 | 25d | 1 | 1.39mi |
| 5200 Greencroft Dr Dayton, OH | 2.0 | 2.0 | 1116 | $1,200 | $1.08 | 4d | 1 | 1.46mi |
| 5200 Greencroft Dr Dayton, OH | 2.0 | 2.0 | 1115 | $1,200 | $1.08 | 23d | 1 | 1.46mi |
| 2109 Victoria Ave Dayton, OH | 2.0 | 1.0 | 714 | $950 | $1.33 | 5d | 1 | 1.47mi |
| 3537 Otterbein Ave Unit d Dayton, OH | 2.0 | 1.0 | 900 | $925 | $1.03 | 45d | 1 | 1.47mi |
Listing history 40 events
-
2026-06-22days on market $115,000 Active 85 DOM
-
2026-06-18days on market $115,000 Active 82 DOM
-
2026-06-17days on market $115,000 Active 81 DOM
-
2026-06-16days on market $115,000 Active 80 DOM
-
2026-06-15days on market $115,000 Active 79 DOM
-
2026-06-14days on market $115,000 Active 77 DOM
-
2026-06-13days on market $115,000 Active 76 DOM
-
2026-06-10days on market $115,000 Active 74 DOM
-
2026-06-09days on market $115,000 Active 73 DOM
-
2026-06-08days on market $115,000 Active 72 DOM
-
2026-06-07days on market $115,000 Active 71 DOM
-
2026-06-05days on market $115,000 Active 68 DOM
-
2026-06-03days on market $115,000 Active 67 DOM
-
2026-06-02days on market $115,000 Active 66 DOM
-
2026-06-01days on market $115,000 Active 65 DOM
-
2026-05-31days on market $115,000 Active 64 DOM
-
2026-03-26$115,000 Active 576-char remark
Show marketing remark (576 chars)
Refreshed home located in Trotwood. Updates in the last year include new carpet, interior paint, vanity, ceiling fans, painted kitchen cabinets and appliances. Enjoy a fence in yard with a concrete pad making it a great place to entertain. The home has a covered front porch. The attached carport provides protection from the elements, and this property also includes two sheds. Tucked Ina location close to grocery stores, restaurants, and everyday essentials. Seller prefers signed contract before disrupting the tenant. Currently rented at $1100.00 and lease ends 2/28/27.
-
2026-03-23historical $1,100
-
2026-03-20$1,100
-
2026-02-04historical $1,100
-
2026-01-29$1,100
-
2025-03-06historical $1,100
-
2025-03-02historical $1,100
-
2025-03-02$1,100
-
2025-03-02$1,100
-
2025-02-01historical $1,100
-
2025-02-01historical $1,100
-
2025-02-01$1,100
-
2025-01-30$1,100
-
2025-01-27historical $1,100
-
2025-01-26$1,100
-
2025-01-12historical $1,100
-
2025-01-12historical $1,100
-
2025-01-12$1,100
-
2025-01-05price $1,100
-
2024-12-23$1,050
-
2024-01-01historical $1,000
-
2023-12-22$1,000
-
2023-12-07soldstatus $67,000
-
1993-03-16soldstatus $30,000
ⓘ Source: listings_history table (triggers on properties + properties_extension) + one-shot
backfill from property_details.listing_events for pre-trigger history.
Tax reassessment forecast OH · Partial reset (capped growth)
- Current annual tax
- $911 · $76/mo
- Projected year-2 tax
- $1,353 · $113/mo
- Expected delta
- +$441/yr (+$37/mo · 48.4%)
ⓘ Screening estimate from a state-policy table — verify with the county assessor before closing.
Climate risk First Street
- Flood 1/10 Low FEMA zone X (unshaded) · 0% chance over 30 yrs
- Wildfire 1/10 Low
- Heat 3/10 Moderate 7 d/yr ≥103°F today · 18 d/yr by 30 yrs out
- Wind 2/10 Low
- Air quality 3/10 Moderate 3 unhealthy d/yr today · 4 by 30 yrs out
Nearby sold comps map
Loading sold comps map…
Walkable amenities ~0.75 mi
Loading nearby amenities…
Taxation est. · year 1
- Rental income
- $13,846
- − Mortgage interest
- −$6,442
- − Property taxes
- −$911
- − Insurance
- −$575
- − Repairs & maintenance
- −$1,108
- − Management
- −$1,108
- − Depreciation
- −$3,345
- Taxable income
- $357
- Est. tax owed @ 24.0%
- −$86
- After-tax cash flow
- $2,129/yr
For passive investors: Depreciation is non-cash, so a rental often shows a tax loss while cash-flowing — sheltering income. Rental losses are passive: they offset passive income freely, and up to $25,000/yr can offset ordinary (W-2) income if you actively participate and your MAGI is under $100k (phasing out to $0 by $150k); unused losses carry forward. On sale, claimed depreciation is recaptured at up to 25%, and gains may owe capital-gains tax (a 1031 exchange can defer both). Figures are a year-1 estimate at your 24.0% rate — not tax advice; consult a CPA.
Schools (NCES district)
- District
- Dayton City
- NCES district ID
- 3904384
- Math proficiency
- 12% ▼ -12.00%
- Reading proficiency
- 21% ▼ -11.00%
- Median HH income
- $28,688
- Composite
- 12.94/100
- National rank
- #9579
- State rank
- #641 of 656 in OH
Livability — Trotwood
- Score
- 59/100
- State rank
- #1014
- US rank
- #20073
Category grades
Schools grade is shown separately in the Schools card above.
Census & demographics
- Census place
- Trotwood, OH
- County
- Montgomery County · 459,541 people
- City population
- 19,754
- Metro
- Dayton-Kettering, OH
- Population (ZIP)
- 5,640
- Household income
- $46,174
- Rent vs Own
- Severe rent burden
- 172.0
Population outlook (Montgomery County) Hauer SSP2
- Today (2025)
- 523,241 people
- By 2030
- 514,948 · -1.6%
- By 2040
- 493,378 · -5.7%
- By 2050
- 469,639 · -10.2%
- By 2075
- 418,360 · -20.0%
- By 2100
- 353,315 · -32.5%
Race, ethnicity, and origin ACS 2023
- Neighborhood character
- Diverse neighborhood (Simpson 0.58)
- Race & ethnicity
- Black 62% White 18% Two or more races 15% Hispanic / Latino 5%
- Hispanic origin (detail)
- Mexican 1% Puerto Rican 2%
- Common ancestry
- Lithuanian 1%
- Foreign-born
- 2%
- Languages at home
- 95% English-only · Spanish 3% French/Haitian/Cajun 1% Other Indo-European 1%
Political lean MEDSL · Montgomery
- 2024 margin
- Toss-up / Even · D 49.8% · R 49.3%
- 2008→2024 swing
- -5.8pp toward R · 2008: 6.2pp · 2024: 0.5pp
- All cycles
- 2024: D+0.5 2020: D+2.2 2016: R+1.2 2012: D+3.1 2008: D+6.2
Not yet ingested
- Civics
- —
Market trends
- HPI YoY
- ▼ -61.27%
- Current HPI
- 173.5938
- Rent YoY
- —
- Metro
- Dayton-Kettering, OH
- State GDP YoY
- ▲ 1.98%
- F500 in state
- 48
Industry mix (Fortune 500 HQ in OH)
| Industry | F500 HQs | Revenue |
|---|---|---|
| Insurance | 3 | $145B |
|
||
| Industrial Machinery | 3 | $49B |
|
||
| Financial Services | 3 | $24B |
|
||
| Consumer Goods | 2 | $93B |
|
||
| Aerospace / Defense | 2 | $47B |
|
||
| Utilities | 2 | $33B |
|
||
Price history
+283.3% since first listed24 events — show timeline
- 2026-03-26 Listed $115,000 Dayton MLS
- 2026-03-23 Rental Removed $1,100 TURBOTENANT
- 2026-03-20 Listed for Rent $1,100 TURBOTENANT
- 2026-02-04 Rental Removed $1,100 TURBOTENANT
- 2026-01-29 Listed for Rent $1,100 TURBOTENANT
- 2025-03-06 Rental Removed $1,100 RENTALBEAST
- 2025-03-02 Rental Removed $1,100 TURBOTENANT
- 2025-03-02 Listed for Rent $1,100 TURBOTENANT
- 2025-03-02 Listed for Rent $1,100 RENTALBEAST
- 2025-02-01 Rental Removed $1,100 TURBOTENANT
- 2025-02-01 Rental Removed $1,100 RENTALBEAST
- 2025-02-01 Listed for Rent $1,100 RENTALBEAST
- 2025-01-30 Listed for Rent $1,100 TURBOTENANT
- 2025-01-27 Rental Removed $1,100 RENTALBEAST
- 2025-01-26 Listed for Rent $1,100 RENTALBEAST
- 2025-01-12 Rental Removed $1,100 TURBOTENANT
- 2025-01-12 Rental Removed $1,100 RENTALBEAST
- 2025-01-12 Listed for Rent $1,100 RENTALBEAST
- 2025-01-05 Price Changed $1,100 TURBOTENANT
- 2024-12-23 Listed for Rent $1,050 TURBOTENANT
- 2024-01-01 Rental Removed $1,000 TURBOTENANT
- 2023-12-22 Listed for Rent $1,000 TURBOTENANT
- 2023-12-07 Sold (Public Records) $67,000 Public Records
- 1993-03-16 Sold (Public Records) $30,000 Public Records
Property tax history
+4.8%/yrLatest (2025): $911 · -0.2% YoY. Source: county tax records.
Cash-flow waterfall
monthlySold comps — $/sqft
last 12 mo · ≤1 miLoading sold comps…