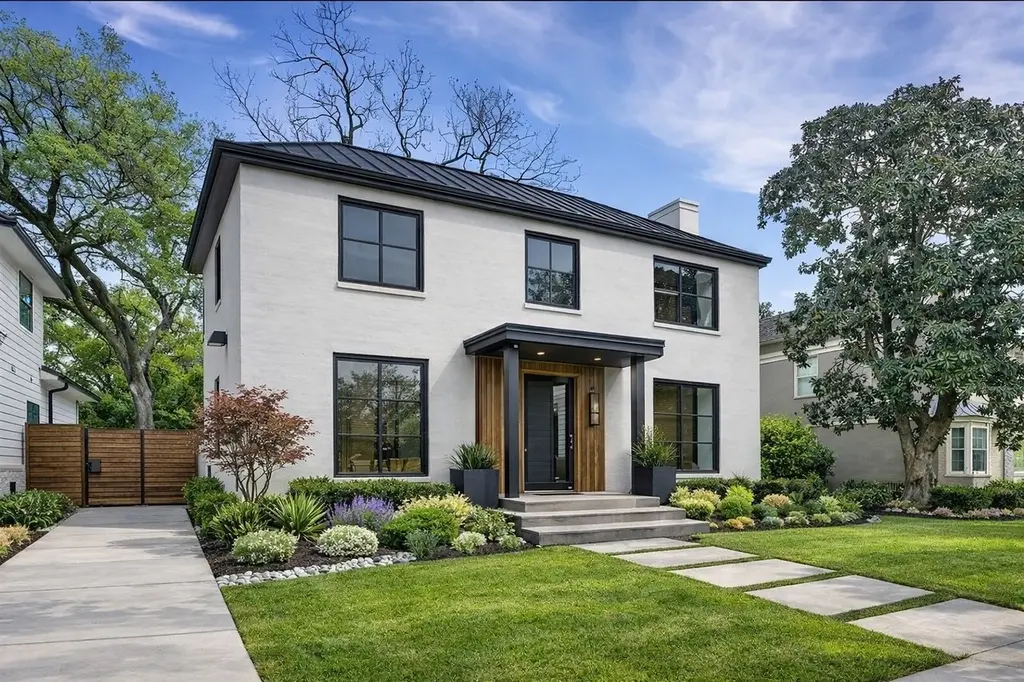
3215 Milburn St · Houston, TX
Flood risk 7/10 · Major
- FEMA flood zone
- X (unshaded)
- Chance of flooding over 30 yrs
- 0.99%
- Est. flood insurance / yr
- $507 – $1,088
Fire risk 1/10 · Minimal
- Est. fire insurance / yr
- $1,222 – $2,270
Heat risk 9/10 · Severe
- Hot days now (above 109°F)
- 7 days/yr
- Hot days in 30 yrs
- 24 days/yr
Wind risk 9/10 · Severe
- Chance of severe wind over 30 yrs
- 99.0%
Air-quality risk 2/10 · Minimal
- Unhealthy air days now
- 2 days/yr
- Unhealthy air days in 30 yrs
- 2 days/yr
Risk factors via First Street. Map © Google.
Why this score? — see what drove the C grade
The composite is a weighted blend of 9 inputs, each scored 0–100. Each bar is that input's sub-score; the figure is the points it added to the 100-point composite (weight × sub-score).
- Cash flow +17.1/30.0
- ARV discount +15.0/15.0
- 1% rule +5.8/10.0
- DSCR +5.3/10.0
- Livability +3.7/5.0
- Rent growth +3.0/5.0
- Schools +2.7/10.0
- Condition / age +2.5/5.0
- Appreciation +0.0/10.0
$425,000
🖨 Deal sheet (PDF) 📄 Offer letter ✓ Due diligence
Listing remarks
MULTIPLE OFFERS RECEIVED! Welcome to 3215 Milburn St in Historic Riverside Terrace. Located just 2 blocks away from Macgregor Dr, this traditional home is perfect for the discerning buyer looking to put a personal touch on a blank slate. With hardwood flooring throughout, formals, a home office, as well as an oversized family room at the rear of the home, this property is both spacious and functional. Right under 3,000 sq ft with 4 true bedrooms along with 2.5 bathrooms provide the space needed for both families and individuals. Light remodeling has already been done to the home and it is now ready for a new buyer to finish the job. An oversized pool ready backyard with. detached garage ar
Key facts
- Hardwood flooring
- Inviting front porch
- Home office
Tags
Property features AI
Finance
- Other: Lease not considered
Exterior
- Parking: Detached garage; 2-car garage
- Security: Smoke detectors
- Utilities: Public water; Public sewer
- Home design: Residential property; North-facing
- Construction: Brick construction; Composition roof; Slab foundation; Built in 1949
- Exterior features: Private yard; Fence; Back yard fencing; Subdivision lot
Interior
- Kitchen: Double oven; Dishwasher; Gas cooktop; Disposal; Microwave; Refrigerator
- Bedrooms: Primary bedroom on second level (17x16); Bedroom on second level (13x12); Bedroom on second level (17x13); Additional bedrooms (dimensions available)
- Flooring: Slate; Tile; Wood
- Bathrooms: 2 full bathrooms; 1 half bathroom
- Heating & cooling: Central heating (gas); Central air conditioning (electric)
- Interior features: Breakfast bar; Balcony; Dry bar; Granite counters; Kitchen island; Kitchen/family room combo; Primary bedroom with bath; Soaking tub; Separate shower; Tub/shower; Gas log fireplace (1)
- Laundry & utility: Washer hookup; Electric dryer hookup; Washer; Dryer
Neighborhood map
What this means for you Summary
Snapshot
- This is a 4-bed/2.5-bath single-family listed at $425k.
Deal economics
- At list price, monthly cash flow is $229 ($3k/yr) — positive.
- The deal already cash-flows at list — no discount required.
- Meets the 1% rule at list price ($5k rent vs $425k).
- Recommended offer: $419k (1.5% below list) — sets the bar for market timing.
- Cap rate 7.1% vs local median 3.2% in Houston — top-decile yield for the area; either an underpriced asset or a hidden risk that comps aren't pricing in. Stress-test before assuming the spread holds.
Location & tenants
- Location reads 74/100 on livability (#184 in TX, #4,771 nationally) — a middle-class / working-renter tenant base. Strengths: amenities A+, cost of living A+, housing A+; Watch: crime F.
- Houston ISD (urban): math 27% / reading 35% proficiency, ranked #593 of 826 in TX (top 72%) — families likely to look elsewhere, expect single-tenant / working-renter base with shorter leases; 71% free/reduced lunch — lower-income household profile, screen leases tightly.
- Zoned schools: Thompson El (math 22% / reading 32%, grade F, #2,791 of 4,322 statewide, top 68%, 401 students, 99% FRL); Cullen Middle (math 6% / reading 14%, grade F, #1,641 of 1,662 statewide, top 99%, 324 students, 100% FRL); Yates H S (math 12% / reading 23%, grade F, #1,451 of 1,632 statewide, top 89%, 851 students, 96% FRL) — zoned schools average 98% FRL vs 71% district-wide (27 pts higher); higher-poverty schools than district average — tighter screening recommended.
- Zoned-school proficiency averages 18% at this address vs 31% district-wide (-13 pts) — the specific schools serving this property underperform the Houston ISD average; the district grade overstates school quality for this exact location.
- Market conditions: Rents rising (+2.2%/yr); 472 active listings in the ZIP; 25 comparable units currently listed for rent nearby; rentals at typical pace (median 15d on market — plan ~3-4 weeks tenant-placement turnaround); 29,883 units permitted in Harris County in 2024 (8,621 in 5+ unit buildings).
- At $4,607/mo this rent would consume 121% of the median local household income ($46k/yr) (locally 2532% of renters already pay >50% of income on rent) — very limited rent-growth headroom before tenants either downsize or default.
Forward outlook
- Local home prices are declining (-3.0%/yr); year-one equity from $3k of loan paydown is wiped out by about $13k of value loss. Plan a longer hold.
- Harris County population projected at +47% by 2050 — long-run rental-demand tailwind backs the buy-and-hold thesis.
Negotiation context
- It's been on market 24 days — a 2% lower offer ($419k) is reasonable based on typical stale-listing flexibility.
- 20 sale attempts since 19y ago with the ask held roughly flat each time — persistent listings suggest the price (not the market) is what's stuck; bring a comps-based counter.
Risks & watch-outs
- Watch-outs: property tax is 2.6% of price; flood insurance adds $66/mo; built in 1949 — expect roof / HVAC / electrical / plumbing capex.
- Climate carrying-cost: major flood risk; severe wind risk, 99% chance of damaging wind over 30y; extreme-heat days projected 7→24/yr by 2055 (HVAC capex compounding) — expect insurance premiums to compound above CPI over the hold.
Questions for the listing agent
- Built in 1949 — when were the roof, HVAC, electrical panel, plumbing, and water heater last replaced?
- Property tax is high relative to price — has the assessment been appealed recently, and will the sale trigger a re-assessment?
- What's the actual annual flood-insurance premium (NFIP or private), and is the property in a SFHA with mandatory coverage?
- Is there a deadline driving the sale (1031 exchange, divorce, estate, relocation)? That informs how much negotiation room exists.
- Schools are D-rated, which usually means shorter tenancies and higher turnover. Who's the typical renter profile here, and what's been the actual vacancy rate?
- Crime grade is F in this area — have there been break-ins, vandalism, or insurance claims at this property in the last 3 years? What carrier currently insures it and at what premium?
- What's the average days-on-market for RENTAL listings here right now (not sales)? A rising rental-DOM trend means longer vacancies and softer asking-rent achievability than the comps imply.
- What's the recent tenant-quality profile in this submarket — average credit score on applications, eviction rate, late-payment / NSF rate, and stable-employment percentage? A property-management company in the area should have these aggregated.
- How much new for-sale + rental construction is in the pipeline within 1–3 miles? Heavy new supply typically softens prices + rents 12–24 months out; constrained supply supports both.
Investment metrics
- 1% rule
- 1.08% ✓
- Cap rate
- 7.13%
- Cash-on-cash
- 2.98%
- DSCR
- 1.13
- GRM
- 7.7
CMA / ARV
- ARV (on-the-fly)
- $640,074
- Comps found
- 12
Show comp detail 12 sales within ~0.75 mi
| Address | Dist | Beds/Ba | Sqft | Sold | Price | $/sf | Match |
|---|---|---|---|---|---|---|---|
| 3215 Milburn St | 0.00mi | 4/2.5 | 2,991 (0%) | 1mo | $425,000 | $142 | 99 |
| 3332 Ozark St | 0.21mi | 4/3.5 | 3,360 (+12%) | 1mo | $730,000 | $217 | 65 |
| 3217 Calumet St | 0.50mi | 4/2.5 | 2,754 (-8%) | 3mo | $289,999 | $105 | 61 |
| 2515 N Macgregor Way | 0.50mi | 3/3.5 (-1) | 2,926 (-2%) | 5mo | $749,000 | $256 | 60 |
| 6403 Bowling Green St | 0.30mi | 3/3.5 (-1) | 2,689 (-10%) | 1mo | $455,000 | $169 | 60 |
| 2324 Camden Dr Unit C | 0.53mi | 4/4.5 | 3,139 (+5%) | 2mo | $584,990 | $186 | 57 |
| 3209 Binz St | 0.45mi | 4/4.5 | 2,745 (-8%) | 2mo | $715,000 | $260 | 56 |
| 3417 Charleston St | 0.44mi | 3/2.0 (-1) | 2,768 (-8%) | 7mo | $450,000 | $163 | 55 |
| 2431 Calumet St | 0.70mi | 3/3.5 (-1) | 3,106 (+4%) | 1mo | $799,000 | $257 | 51 |
| 6326 Mystic Bridge Dr | 0.42mi | 4/4.5 | 3,389 (+13%) | 5mo | $725,000 | $214 | 46 |
| 2414 Charleston St Unit C | 0.45mi | 3/3.5 (-1) | 2,559 (-14%) | 1mo | $415,000 | $162 | 45 |
| 6306 Mystic Bridge Dr | 0.41mi | 4/4.5 | 3,369 (+13%) | 10mo | $760,000 | $226 | 43 |
Match score weights: distance 35% · size 25% · config 20% · recency 20%. Top-matched comps best support the ARV.
Projected returns pro-forma
-3.0% appreciation · 2.17% rent growth · sell at horizon
- IRR
- -13.6%
- Equity multiple
- 0.51×
- Total profit
- $-57,730
- Equity at exit
- $63,369
- IRR
- -6.2%
- Equity multiple
- 0.62×
- Total profit
- $-45,414
- Equity at exit
- $36,746
Cash invested: $119,000 (down + closing). Projections, not guarantees.
Landlord ↔ Tenant lean methodology
- Overall (STATE)
- 87 Strongly Landlord-Friendly
- State Texas
- 87 Strongly Landlord-Friendly · R+5
- County
- — inherits STATE
- City
- — inherits STATE
ZIP-level market 77021
- Home prices YoY
- -23.6%
- Rents YoY
- 2.2%
- Active inventory
- 472
- Price-to-rent
- 7.7×
Monthly cashflow live
- Estimated rent
- $4,607 high interval (Pro) →
- Mortgage (P&I)
- −$2,229
- Tax from tax record
- −$938 /mo · $11,255/yr
- Insurance
- −$177
- Flood insurance flood zone
- −$66 /mo · $798/yr
- HOA
- −$0
- Vacancy / Maint / Mgmt
- −$967
- Net cashflow
- $229
Break-even live
Sensitivity live
| Price | -10% $470 | -5% $349 | +0% $229 | +5% $109 | +10% $-11 |
|---|---|---|---|---|---|
| Rent | -10% $-135 | -5% $47 | +0% $229 | +5% $411 | +10% $593 |
| Rate | -1.0pp $443 | -0.5pp $337 | base $229 | +0.5pp $119 | +1.0pp $7 |
UW: 25.0% down · 7.5% · 30yr · 1.5% tax · 5.0% vac · 8.0% maint · 8.0% mgmt
Financing live
Cash to close
- Down payment
- $106,250
- Closing costs
- $12,750
- Reserves months
- —
- Total cash needed
- —
Loan-product check · same deal, 3 products live
Conventional
25% down · 7.5% · 30yr
- Down + closing
- —
- Monthly P&I
- —
- Monthly cashflow
- —
- DSCR
- —
- Eligible?
- —
Personal DTI + credit; lowest rate.
DSCR
20% down · 8.5% · 30yr
- Down + closing
- —
- Monthly P&I
- —
- Monthly cashflow
- —
- DSCR
- —
- Eligible?
- —
No personal income docs; deal must DSCR.
Hard money
10% down · 12.0% · 12mo
- Down + closing
- —
- Monthly P&I
- —
- Monthly cashflow
- —
- DSCR
- —
- Eligible?
- —
Short-term bridge; refi at stabilization.
Rent comps 25 comps
| Address | Beds | Baths | Sqft | Rent | $/sqft | DOM | Units | Dist |
|---|---|---|---|---|---|---|---|---|
| 5505 Zoemark Ln Houston, TX | 3.0 | 3.5 | 2477 | $2,850 | $1.15 | 45d | 1 | 0.27mi |
| 6318 Grand Blvd Houston, TX | 3.0 | 3.5 | 2325 | $2,999 | $1.29 | 6d | 1 | 0.37mi |
| 5927 Almeda Rd Unit AHP3 Houston, TX | 4.0 | 4.5 | 3055 | $7,635 | $2.50 | 5d | 1 | 0.61mi |
| 5927 Almeda Rd Houston, TX | 2.0–4.0 | 2.5–4.0 | 3055 | $7,635 | $2.50 | 14d | 2 | 0.62mi |
| 5927 Almeda Rd Houston, TX | 1.0–4.0 | 1.0–4.0 | 3055 | $7,635 | $2.50 | 0d | 4 | 0.62mi |
| 5927 Almeda Rd Houston, TX | 1.0–4.0 | 1.0–4.0 | 3055 | $7,635 | $2.50 | 1d | 3 | 0.62mi |
| 5927 Almeda Rd Houston, TX | 4.0 | 4.0 | 3055 | $7,635 | $2.50 | 45d | 1 | 0.63mi |
| 5927 Almeda Rd Houston, TX | 4.0 | 4.0 | 3055 | $7,635 | $2.50 | 26d | 1 | 0.63mi |
| 5933 Almeda Rd Unit 2-1405 Houston, TX | 4.0 | 4.0 | 3055 | $7,442 | $2.44 | 45d | 1 | 0.64mi |
| 3024 Charline Ave Houston, TX | 3.0 | 3.5 | 1995 | $2,950 | $1.48 | 46d | 1 | 0.89mi |
| 3731 Alsace St Unit 1560804P Houston, TX | 3.0 | 2.0 | 2002 | $3,387 | $1.69 | 4d | 1 | 0.94mi |
| 2403 Arbor St Houston, TX | 3.0 | 2.5 | 2344 | $2,800 | $1.19 | 45d | 1 | 1.02mi |
| 2703 Blodgett St Unit 1047952P Houston, TX | 1.0–5.0 | 1.5–5.5 | 2497 | $14,025 | $5.62 | 0d | 2 | 1.03mi |
| 1910 Oakdale St Unit A Houston, TX | 3.0 | 3.5 | 2452 | $3,890 | $1.59 | 13d | 1 | 1.04mi |
| 1818 Prospect St Houston, TX | 3.0 | 2.0 | 2923 | $3,400 | $1.16 | 5d | 1 | 1.06mi |
| 3535 Wentworth St Houston, TX | 4.0 | 3.0 | 2600 | $2,650 | $1.02 | 23d | 1 | 1.10mi |
| 4306 Ennis St Houston, TX | 3.0 | 3.0 | 1989 | $2,500 | $1.26 | 45d | 1 | 1.14mi |
| 1904 Lauderdale St Houston, TX | 3.0 | 3.5 | 2223 | $3,000 | $1.35 | 22d | 1 | 1.22mi |
| 5350 Crawford St Unit 5383 Houston, TX | 3.0 | 2.0 | 1991 | $4,460 | $2.24 | 12d | 1 | 1.25mi |
| 5350 Crawford St Unit 3165 Houston, TX | 3.0 | 2.0 | 1991 | $4,420 | $2.22 | 0d | 1 | 1.25mi |
| 4135 DuPont St Houston, TX | 3.0 | 4.0 | 2395 | $2,499 | $1.04 | 45d | 1 | 1.28mi |
| 7016 Staffordshire Blvd Unit B Houston, TX | 3.0 | 3.5 | 2527 | $4,295 | $1.70 | 6d | 1 | 1.31mi |
| 4908 Crawford St Houston, TX | 3.0 | 2.0 | 2526 | $3,250 | $1.29 | 45d | 1 | 1.35mi |
| 3615 Dreyfus St Houston, TX | 3.0 | 3.0 | 2011 | $2,800 | $1.39 | 45d | 1 | 1.42mi |
| 5280 Caroline St Houston, TX | 1.0–3.0 | 1.0–3.5 | 1880 | $6,216 | $3.31 | 0d | 22 | 1.42mi |
Listing history 50 events
-
2026-05-12status Pending
-
2026-04-29status Pending
-
2026-04-17$425,000 Active
-
2026-04-17historical
-
2026-03-05$480,000 Active
-
2026-02-23historical
-
2026-02-23$480,000
-
2025-09-30historical
-
2025-09-16historical $3,000
-
2025-08-05$3,000
-
2025-08-04status Active
-
2025-08-04$520,000 Active
-
2025-08-04historical
-
2025-05-20historical $3,500
-
2025-05-20historical
-
2025-05-16$3,500
-
2025-03-12$521,000 Active
-
2024-10-08historical
-
2024-10-01price $499,900
-
2024-07-13price $550,000
-
2024-06-14status Active
-
2024-06-13$620,000 Active
-
2024-06-13historical
-
2023-03-21historical
-
2023-02-12price $610,000
-
2023-01-20$680,000 Active
-
2022-08-03soldstatus
-
2022-08-01soldstatus Sold
-
2022-06-27status Pending
-
2022-06-01price $515,000
-
2022-05-20price $535,000
-
2022-04-21$544,800 Active
-
2022-03-13historical
-
2021-12-30status Active
-
2021-12-30status Pending
-
2021-12-20status Option Pending
-
2021-11-11$529,000 Active
-
2021-11-11historical
-
2021-09-18price $529,000
-
2021-08-25$540,000 Active
-
2012-06-28historical
-
2012-06-11historical
-
2012-05-05$275,000
-
2012-01-04$280,000
-
2008-05-20historical
-
2008-04-21$265,000
-
2008-02-28historical
-
2007-10-18$279,500
-
2007-10-04historical
-
2007-03-09$299,000
ⓘ Source: listings_history table (triggers on properties + properties_extension) + one-shot
backfill from property_details.listing_events for pre-trigger history.
Tax reassessment forecast TX · Resets to sale price
- Current annual tax
- $11,255 · $938/mo
- Projected year-2 tax
- $11,255 · $938/mo
- Expected delta
- $0/yr ($0/mo · 0.0%)
ⓘ Screening estimate from a state-policy table — verify with the county assessor before closing.
Climate risk First Street
- Flood 7/10 Severe FEMA zone X (unshaded) · 99% chance over 30 yrs
- Wildfire 1/10 Low
- Heat 9/10 Extreme 7 d/yr ≥109°F today · 24 d/yr by 30 yrs out
- Wind 9/10 Extreme 99% chance of damaging wind over 30 yrs
- Air quality 2/10 Low 2 unhealthy d/yr today · 2 by 30 yrs out
Nearby sold comps map
Loading sold comps map…
Walkable amenities ~0.75 mi
Loading nearby amenities…
Taxation est. · year 1
- Rental income
- $55,281
- − Mortgage interest
- −$23,807
- − Property taxes
- −$11,255
- − Insurance
- −$2,922
- − Repairs & maintenance
- −$4,422
- − Management
- −$4,422
- − Depreciation
- −$12,364
- Taxable loss
- −$3,912
- Est. tax savings @ 24.0%
- +$939
- After-tax cash flow
- $3,688/yr
For passive investors: Depreciation is non-cash, so a rental often shows a tax loss while cash-flowing — sheltering income. Rental losses are passive: they offset passive income freely, and up to $25,000/yr can offset ordinary (W-2) income if you actively participate and your MAGI is under $100k (phasing out to $0 by $150k); unused losses carry forward. On sale, claimed depreciation is recaptured at up to 25%, and gains may owe capital-gains tax (a 1031 exchange can defer both). Figures are a year-1 estimate at your 24.0% rate — not tax advice; consult a CPA.
Schools (NCES district)
- District
- Houston ISD
- NCES district ID
- 4823640
- Math proficiency
- 27% ▼ -18.00%
- Reading proficiency
- 35% ▼ -6.00%
- Median HH income
- $46,054
- Composite
- 26.63/100
- National rank
- #7173
- State rank
- #593 of 826 in TX
Livability — Houston
- Score
- 74/100
- State rank
- #184
- US rank
- #4771
Category grades
Schools grade is shown separately in the Schools card above.
Census & demographics
- Census place
- Houston, TX
- County
- Harris County · 4,702,590 people
- City population
- 3,226,434
- Metro
- Houston-The Woodlands-Sugar Land, TX
- Population (ZIP)
- 26,153
- Household income
- $45,574
- Rent vs Own
- Severe rent burden
- 2532.0
Population outlook (Harris County) Hauer SSP2
- Today (2025)
- 5,571,493 people
- By 2030
- 6,089,821 · +9.3%
- By 2040
- 7,142,806 · +28.2%
- By 2050
- 8,185,864 · +46.9%
- By 2075
- 10,574,329 · +89.8%
- By 2100
- 12,109,958 · +117.4%
Race, ethnicity, and origin ACS 2023
- Neighborhood character
- Diverse neighborhood (Simpson 0.55)
- Race & ethnicity
- Black 62% Hispanic / Latino 22% Two or more races 12% White 10% Asian 2%
- Hispanic origin (detail)
- Mexican 15%
- Common ancestry
- Italian 1% Romanian 1% Lithuanian 1%
- Foreign-born
- 11% · Canada
- Languages at home
- 77% English-only · Spanish 19% French/Haitian/Cajun 1% Other Indo-European 1%
Political lean MEDSL · Harris
- 2024 margin
- Lean D (+5.5) · D 52.0% · R 46.4% · Other 1.6%
- 2008→2024 swing
- +3.9pp toward D · 2008: 1.6pp · 2024: 5.5pp
- All cycles
- 2024: D+5.5 2020: D+13.3 2016: D+12.4 2012: D+0.1 2008: D+1.6
Not yet ingested
- Civics
- —
Market trends
- HPI YoY
- ▼ -71.22%
- Current HPI
- 230.2869
- Rent YoY
- ▲ 2.17%
- Metro
- Houston-The Woodlands-Sugar Land, TX
- State GDP YoY
- ▲ 3.95%
- F500 in state
- 110
Industry mix (Fortune 500 HQ in TX)
| Industry | F500 HQs | Revenue |
|---|---|---|
| Energy | 16 | $1,198B |
|
||
| Technology | 5 | $198B |
|
||
| Engineering / Construction | 4 | $72B |
|
||
| Energy Services | 3 | $60B |
|
||
| Utilities | 3 | $41B |
|
||
| Healthcare | 2 | $330B |
|
||
Price history
+42.1% since first listed52 events — show timeline
- 2026-05-12 Pending — HARMLS
- 2026-04-29 Pending — HARMLS
- 2026-04-17 Listing Removed — HARMLS
- 2026-04-17 Listed $425,000 HARMLS
- 2026-03-05 Listed $480,000 HARMLS
- 2026-02-23 Listed $480,000 HARMLS
- 2026-02-23 Listing Removed — HARMLS
- 2025-09-30 Listing Removed — HARMLS
- 2025-09-16 Rental Removed $3,000 HARMLS
- 2025-08-05 Listed for Rent $3,000 HARMLS
- 2025-08-04 Relisted — HARMLS
- 2025-08-04 Listing Removed — HARMLS
- 2025-08-04 Listed $520,000 HARMLS
- 2025-05-20 Rental Removed $3,500 HARMLS
- 2025-05-20 Listing Removed — HARMLS
- 2025-05-16 Listed for Rent $3,500 HARMLS
- 2025-03-12 Listed $521,000 HARMLS
- 2024-10-08 Listing Removed — HARMLS
- 2024-10-01 Price Changed $499,900 HARMLS
- 2024-07-13 Price Changed $550,000 HARMLS
- 2024-06-14 Relisted — HARMLS
- 2024-06-13 Listing Removed — HARMLS
- 2024-06-13 Listed $620,000 HARMLS
- 2023-03-21 Listing Removed — HARMLS
- 2023-02-12 Price Changed $610,000 HARMLS
- 2023-01-20 Listed $680,000 HARMLS
- 2022-08-03 Sold (Public Records) — Public Records
- 2022-08-01 Sold (MLS) — HARMLS
- 2022-06-27 Pending — HARMLS
- 2022-06-01 Price Changed $515,000 HARMLS
- 2022-05-20 Price Changed $535,000 HARMLS
- 2022-04-21 Listed $544,800 HARMLS
- 2022-03-13 Listing Removed — HARMLS
- 2021-12-30 Relisted — HARMLS
- 2021-12-30 Pending — HARMLS
- 2021-12-20 Pending — HARMLS
- 2021-11-11 Listing Removed — HARMLS
- 2021-11-11 Listed $529,000 HARMLS
- 2021-09-18 Price Changed $529,000 HARMLS
- 2021-08-25 Listed $540,000 HARMLS
- 2012-06-28 Listing Removed — HARMLS
- 2012-06-11 Listing Removed — HARMLS
- 2012-05-05 Listed $275,000 HARMLS
- 2012-01-04 Listed $280,000 HARMLS
- 2008-05-20 Listing Removed — HARMLS
- 2008-04-21 Listed $265,000 HARMLS
- 2008-02-28 Listing Removed — HARMLS
- 2007-10-18 Listed $279,500 HARMLS
- 2007-10-04 Listing Removed — HARMLS
- 2007-03-09 Listed $299,000 HARMLS
- 2004-04-13 Sold (Public Records) — Public Records
- 1988-01-02 Sold (Public Records) — Public Records
Property tax history
+4.2%/yrLatest (2025): $11,255 · +1.5% YoY. Source: county tax records.
Cash-flow waterfall
monthlySold comps — $/sqft
last 12 mo · ≤1 miLoading sold comps…