100 E Thomas Pl Unit 2051-13 · Avon, CO
Flood risk 10/10 · Severe
- FEMA flood zone
- X (unshaded)
- Chance of flooding over 30 yrs
- 0.99%
- Est. flood insurance / yr
- $507 – $1,088
Fire risk 4/10 · Minor
- Est. fire insurance / yr
- $939 – $1,743
Heat risk 1/10 · Minimal
- Hot days now (above 74°F)
- 14 days/yr
- Hot days in 30 yrs
- 37 days/yr
Wind risk 1/10 · Minimal
- Chance of severe wind over 30 yrs
- —
Air-quality risk 2/10 · Minimal
- Unhealthy air days now
- 1 days/yr
- Unhealthy air days in 30 yrs
- 2 days/yr
Risk factors via First Street. Map © Google.
Why this score? — see what drove the C- grade
The composite is a weighted blend of 9 inputs, each scored 0–100. Each bar is that input's sub-score; the figure is the points it added to the 100-point composite (weight × sub-score).
- Cash flow +15.0/30.0
- Appreciation +8.3/10.0
- ARV discount +7.5/15.0
- 1% rule +5.0/10.0
- DSCR +5.0/10.0
- Livability +3.1/5.0
- Schools +3.0/10.0
- Rent growth +2.5/5.0
- Condition / age +2.5/5.0
$75,000
🖨 Deal sheet 📄 Offer letter ✓ Due diligence
Listing remarks
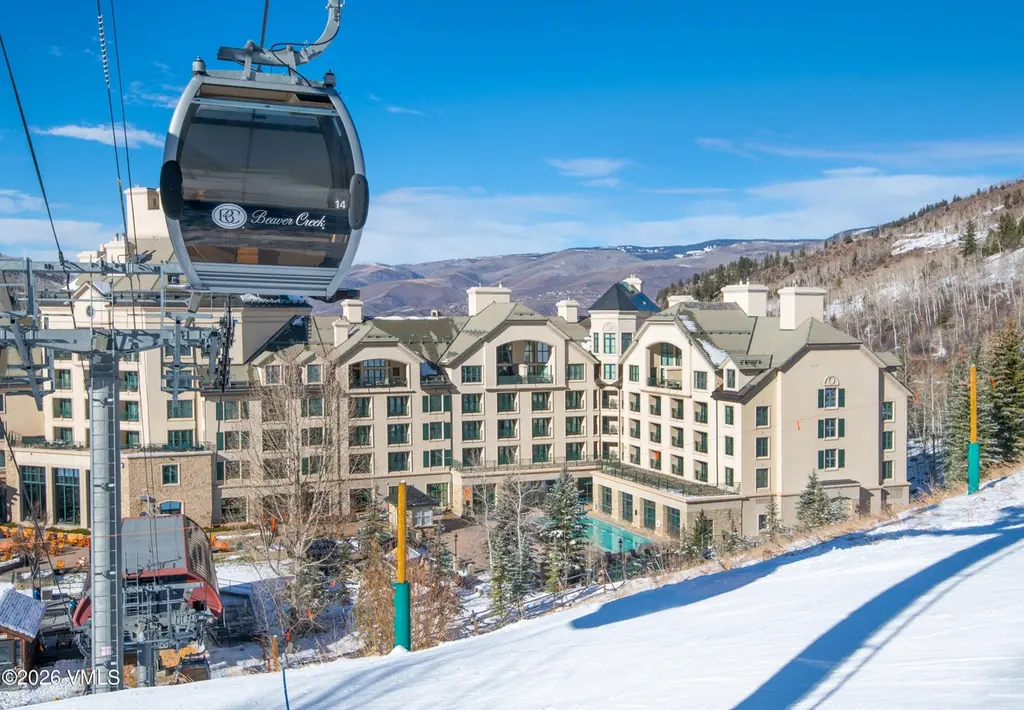
Enjoy the luxury, comfort and convenience of the Residences at Park Hyatt Beaver Creek. With all the Park Hyatt amenities, ski-in ski-out and ski valet, restaurants, Exhale Spa and walking distance to the village, your vacation will be seamless. Week 13 is early April and often a holiday week. Additional points may be used year round in Beaver Creek or one of many other Hyatt Vacation Club properties
Key facts
- Ski valet
- Ski-in ski-out
- 1,133 sq ft lot
Tags
Property features AI
Finance
- HOA & community: Homeowners association with an annual fee of 7,839.73
Exterior
- Utilities: Cable available; Electricity available; Natural gas available; Phone available; Sewer available; Snow removal; Trash service; Water available
- Home design: Multifamily zoning
- Construction: Tile roof; Poured-in-place foundation
- Exterior features: Community clubhouse, fishing, fitness center, golf, pool, shuttle service, tennis courts, and trails
Interior
- Bedrooms: 2 bedrooms
- Flooring: Carpet; Marble; Wood
- Bathrooms: 2 full bathrooms and 1 half bathroom
- Heating & cooling: Central heating; Central air conditioning
- Interior features: Carpet, marble, and wood flooring
Neighborhood map
What this means for you Summary
Snapshot
- This is a 2-bed/2.5-bath timeshare listed at $75k.
Deal economics
- At list price, monthly cash flow is $2k ($27k/yr) — positive.
- The deal already cash-flows at list — no discount required.
- Meets the 1% rule at list price ($4k rent vs $75k).
- Recommended offer: $73k (3.0% below list) — sets the bar for market timing.
- Cap rate 43.8% vs local median 2.3% in Avon — top-decile yield for the area; either an underpriced asset or a hidden risk that comps aren't pricing in. Stress-test before assuming the spread holds.
Location & tenants
- Location reads 61/100 on livability (#220 in CO) — a middle-class / working-renter tenant base. Strengths: commute A+, health & safety A+, housing B; Watch: schools F, crime D-, amenities F.
- Eagle County School District No. RE-50 (town): math 22% / reading 42% proficiency, ranked #39 of 86 in CO (top 45%) — families likely to look elsewhere, expect single-tenant / working-renter base with shorter leases.
- Market conditions: 448 active listings in the ZIP; solid renter incomes; 387 units permitted in Eagle County in 2024 (256 in 5+ unit buildings).
- At $4,447/mo this rent would consume 52% of the median local household income ($103k/yr) (locally 744% of renters already pay >50% of income on rent) — very limited rent-growth headroom before tenants either downsize or default.
Forward outlook
- In year one you build about $5k of equity ($519 loan paydown + $5k appreciation (6.6% local appreciation)).
- Eagle County population projected at +4% by 2050 — modest demand growth; plan on rents tracking national, not racing it.
- At projected returns (6.6% appreciation + 3.0% rent growth), your $21k cash investment doubles in ~1 year — after that, you're playing with house money.
- By year 6, paydown + projected appreciation supports a ~$30k cash-out refi (75% LTV) — recoverable capital for the next deal without selling this one.
Negotiation context
- It's been on market 38 days — a 3% lower offer ($73k) is reasonable based on typical stale-listing flexibility.
Risks & watch-outs
- Watch-outs: flood insurance adds $66/mo.
- Climate carrying-cost: severe flood risk — expect insurance premiums to compound above CPI over the hold.
Questions for the listing agent
- It's been on market 38 days. Have you received any prior offers? Is the seller open to a 3% concession, seller financing, or rate buy-down credit?
- What's the actual annual flood-insurance premium (NFIP or private), and is the property in a SFHA with mandatory coverage?
- What does the HOA fee cover, when was the last increase, and are there any pending special assessments or reserve-fund shortfalls?
- Is there a deadline driving the sale (1031 exchange, divorce, estate, relocation)? That informs how much negotiation room exists.
- Schools are F-rated, which usually means shorter tenancies and higher turnover. Who's the typical renter profile here, and what's been the actual vacancy rate?
- Crime grade is D in this area — have there been break-ins, vandalism, or insurance claims at this property in the last 3 years? What carrier currently insures it and at what premium?
- What's the average days-on-market for RENTAL listings here right now (not sales)? A rising rental-DOM trend means longer vacancies and softer asking-rent achievability than the comps imply.
- What's the recent tenant-quality profile in this submarket — average credit score on applications, eviction rate, late-payment / NSF rate, and stable-employment percentage? A property-management company in the area should have these aggregated.
- How much new for-sale + rental construction is in the pipeline within 1–3 miles? Heavy new supply typically softens prices + rents 12–24 months out; constrained supply supports both.
Investment metrics
- 1% rule
- 5.93% ✓
- Cap rate
- 43.76%
- Cash-on-cash
- 133.82%
- DSCR
- 6.95
- GRM
- 1.4
CMA / ARV
- ARV (on-the-fly)
- $21,285
- Comps found
- 12
Show comp detail 12 sales within ~0.75 mi
| Address | Dist | Beds/Ba | Sqft | Sold | Price | $/sf | Match |
|---|---|---|---|---|---|---|---|
| 100 E Thomas Pl #4053-Week 50 | 0.03mi | 2/2.0 | 1,410 (-1%) | 10mo | $65,000 | $46 | 87 |
| 46 Avondale Ln Unit 410 Calendar | 0.08mi | 2/2.0 | 1,355 (-4%) | 1mo | $20,000 | $15 | 86 |
| 46 Avondale Ln #304 Calendar Weeks 13&14 | 0.08mi | 2/— | 1,379 (-3%) | 8mo | $19,900 | $14 | 85 |
| 46 Avondale Ln | 0.08mi | 2/2.0 | 1,355 (-4%) | 4mo | $19,900 | $15 | 84 |
| 46 Avondale Ln #403 Calendar Weeks 47&48 | 0.08mi | 2/2.0 | 1,379 (-3%) | 7mo | $18,000 | $13 | 83 |
| 46 Avondale #R-312 | 0.08mi | 2/2.0 | 1,353 (-5%) | 7mo | $125,000 | $92 | 80 |
| 46 Avondale Ln #410 Calendar Weeks 9&10 | 0.08mi | 2/2.0 | 1,528 (+8%) | 8mo | $135,000 | $88 | 74 |
| 210 Offerson Rd #303 | 0.10mi | 2/2.0 | 1,256 (-12%) | 1mo | $10,750 | $9 | 73 |
| 210 Offerson Rd #209 - week 11 | 0.10mi | 2/3.0 | 1,300 (-8%) | 8mo | $35,000 | $27 | 73 |
| 210 Offerson Rd #R-108, Week 31 | 0.10mi | 2/3.0 | 1,300 (-8%) | 10mo | $2,650 | $2 | 71 |
| 210 Offerson Rd #R-119, Week 31 | 0.10mi | 2/3.0 | 1,300 (-8%) | 10mo | $2,850 | $2 | 71 |
| 00063B Avondale Ln #436 / Week 5 | 0.10mi | 3/3.0 (+1) | 1,317 (-7%) | 9mo | $25,000 | $19 | 69 |
Match score weights: distance 35% · size 25% · config 20% · recency 20%. Top-matched comps best support the ARV.
Projected returns pro-forma
6.63% appreciation · 3.0% rent growth · sell at horizon
- IRR
- —
- Equity multiple
- 9.09×
- Total profit
- $169,939
- Equity at exit
- $50,184
- IRR
- —
- Equity multiple
- 19.42×
- Total profit
- $386,764
- Equity at exit
- $93,749
Cash invested: $21,000 (down + closing). Projections, not guarantees.
Landlord ↔ Tenant lean methodology
- Overall (STATE)
- 38 Tenant-Leaning
- State Colorado
- 38 Tenant-Leaning · D+4
- County
- — inherits STATE
- City
- — inherits STATE
ZIP-level market 81620
- Home prices YoY
- 1.9%
- Active inventory
- 448
- Price-to-rent
- 1.4×
Monthly cashflow live
- Estimated rent
- $4,447 medium interval (Pro) →
- Mortgage (P&I)
- −$393
- Tax est. 1.5%
- −$94 /mo · $1,125/yr
- Insurance
- −$31
- Flood insurance flood zone
- −$66 /mo · $798/yr
- HOA
- −$653
- Vacancy / Maint / Mgmt
- −$934
- Net cashflow
- $2,275
Break-even live
UW: 25.0% down · 7.5% · 30yr · 1.5% tax · 5.0% vac · 8.0% maint · 8.0% mgmt
Financing live
Cash to close
- Down payment
- $18,750
- Closing costs
- $2,250
- Reserves months
- —
- Total cash needed
- —
Loan-product check · same deal, 3 products live
Conventional
25% down · 7.5% · 30yr
- Down + closing
- —
- Monthly P&I
- —
- Monthly cashflow
- —
- DSCR
- —
- Eligible?
- —
Personal DTI + credit; lowest rate.
DSCR
20% down · 8.5% · 30yr
- Down + closing
- —
- Monthly P&I
- —
- Monthly cashflow
- —
- DSCR
- —
- Eligible?
- —
No personal income docs; deal must DSCR.
Hard money
10% down · 12.0% · 12mo
- Down + closing
- —
- Monthly P&I
- —
- Monthly cashflow
- —
- DSCR
- —
- Eligible?
- —
Short-term bridge; refi at stabilization.
HOA detail
- Monthly dues
- $653 · $7,836/yr
Listing history 17 events
-
2026-06-19days on market $75,000 Active 38 DOM
-
2026-06-18days on market $75,000 Active 37 DOM
-
2026-06-17days on market $75,000 Active 36 DOM
-
2026-06-16days on market $75,000 Active 35 DOM
-
2026-06-15days on market $75,000 Active 34 DOM
-
2026-06-14days on market $75,000 Active 32 DOM
-
2026-06-12days on market $75,000 Active 31 DOM
-
2026-06-09days on market $75,000 Active 28 DOM
-
2026-06-08days on market $75,000 Active 27 DOM
-
2026-06-07days on market $75,000 Active 26 DOM
-
2026-06-05days on market $75,000 Active 23 DOM
-
2026-06-03days on market $75,000 Active 22 DOM
-
2026-06-02days on market $75,000 Active 21 DOM
-
2026-06-01days on market $75,000 Active 20 DOM
-
2026-05-31days on market $75,000 Active 19 DOM
-
2026-05-30days on market $75,000 Active 18 DOM
-
2026-05-12$75,000 Active
ⓘ Source: listings_history table (triggers on properties + properties_extension) + one-shot
backfill from property_details.listing_events for pre-trigger history.
Climate risk First Street
- Flood 10/10 Extreme FEMA zone X (unshaded) · 99% chance over 30 yrs
- Wildfire 4/10 Moderate
- Heat 1/10 Low 14 d/yr ≥74°F today · 37 d/yr by 30 yrs out
- Wind 1/10 Low
- Air quality 2/10 Low 1 unhealthy d/yr today · 2 by 30 yrs out
Nearby sold comps map
Loading sold comps map…
Walkable amenities ~0.75 mi
Loading nearby amenities…
Taxation est. · year 1
- Rental income
- $53,365
- − Mortgage interest
- −$4,201
- − Property taxes
- −$1,125
- − Insurance
- −$1,172
- − Repairs & maintenance
- −$4,269
- − Management
- −$4,269
- − HOA
- −$7,836
- − Depreciation
- −$2,182
- Taxable income
- $28,310
- Est. tax owed @ 24.0%
- −$6,794
- After-tax cash flow
- $20,511/yr
For passive investors: Depreciation is non-cash, so a rental often shows a tax loss while cash-flowing — sheltering income. Rental losses are passive: they offset passive income freely, and up to $25,000/yr can offset ordinary (W-2) income if you actively participate and your MAGI is under $100k (phasing out to $0 by $150k); unused losses carry forward. On sale, claimed depreciation is recaptured at up to 25%, and gains may owe capital-gains tax (a 1031 exchange can defer both). Figures are a year-1 estimate at your 24.0% rate — not tax advice; consult a CPA.
Schools (NCES district)
- District
- Eagle County School District No. RE-50
- NCES district ID
- 0803540
- Math proficiency
- 22% ▼ -8.00%
- Reading proficiency
- 42% ▼ -4.00%
- Median HH income
- $73,322
- Composite
- 30.01/100
- National rank
- #6360
- State rank
- #39 of 86 in CO
Livability — Avon
- Score
- 61/100
- State rank
- #220
- US rank
- #17858
Category grades
Schools grade is shown separately in the Schools card above.
Census & demographics
- County
- Eagle County · 42,178 people
- City population
- 10,870
- Metro
- Edwards, CO
- Population (ZIP)
- 10,870
- Household income
- $102,775
- Rent vs Own
- Severe rent burden
- 744.0
Population outlook (Eagle County) Hauer SSP2
- Today (2025)
- 57,837 people
- By 2030
- 59,258 · +2.5%
- By 2040
- 60,698 · +4.9%
- By 2050
- 60,206 · +4.1%
- By 2075
- 54,326 · -6.1%
- By 2100
- 47,000 · -18.7%
Race, ethnicity, and origin ACS 2023
- Neighborhood character
- Diverse neighborhood (Simpson 0.56)
- Race & ethnicity
- White 62% Hispanic / Latino 23% Two or more races 23% Asian 3% Black 2%
- Hispanic origin (detail)
- Mexican 14%
- Common ancestry
- Italian 3% Scotch-Irish 2% Slovak 2%
- Foreign-born
- 14% · Canada, Dominican Republic
- Languages at home
- 78% English-only · Spanish 15% Other Indo-European 4% Chinese 1%
Political lean MEDSL · Eagle
- 2024 margin
- Strong D (+24.4) · D 61.0% · R 36.5% · Other 2.5%
- 2008→2024 swing
- +1.3pp toward D · 2008: 23.1pp · 2024: 24.4pp
- All cycles
- 2024: D+24.4 2020: D+29.8 2016: D+19.9 2012: D+14.7 2008: D+23.1
Not yet ingested
- Civics
- —
Market trends
- HPI YoY
- ▲ 6.63%
- Current HPI
- 363.7493
- Rent YoY
- —
- Metro
- Edwards, CO
- State GDP YoY
- ▲ 1.95%
- F500 in state
- 14
Industry mix (Fortune 500 HQ in CO)
| Industry | F500 HQs | Revenue |
|---|---|---|
| Technology Distribution | 1 | $31B |
|
||
| Food / Agriculture | 1 | $18B |
|
||
| Packaging | 1 | $14B |
|
||
| Healthcare | 1 | $13B |
|
||
| Energy | 1 | $10B |
|
||
| Technology | 1 | $4B |
|
||
Price history
1 event — show timeline
- 2026-05-12 Listed $75,000 VMLS
Cash-flow waterfall
monthlySold comps — $/sqft
last 12 mo · ≤1 miLoading sold comps…