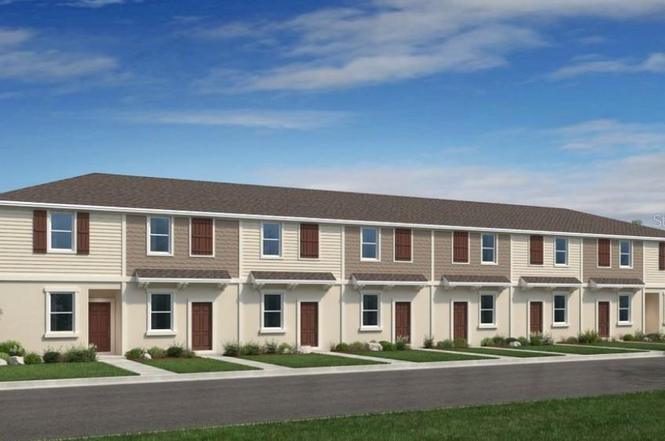
14064 Textile Run · Ruskin, FL
Flood risk 1/10 · Minimal
- FEMA flood zone
- X (unshaded)
- Chance of flooding over 30 yrs
- 0.0%
- Est. flood insurance / yr
- $507 – $1,088
Fire risk 5/10 · Moderate
- Est. fire insurance / yr
- $947 – $1,759
Heat risk 10/10 · Severe
- Hot days now (above 108°F)
- 7 days/yr
- Hot days in 30 yrs
- 30 days/yr
Wind risk 10/10 · Severe
- Chance of severe wind over 30 yrs
- 99.0%
Air-quality risk 3/10 · Minor
- Unhealthy air days now
- 3 days/yr
- Unhealthy air days in 30 yrs
- 3 days/yr
Risk factors via First Street. Map © Google.
Why this score? — see what drove the F grade
The composite is a weighted blend of 9 inputs, each scored 0–100. Each bar is that input's sub-score; the figure is the points it added to the 100-point composite (weight × sub-score).
- Cash flow +10.9/30.0
- 1% rule +4.6/10.0
- Schools +4.4/10.0
- Livability +3.6/5.0
- DSCR +3.2/10.0
- ARV discount +2.7/15.0
- Condition / age +2.5/5.0
- Rent growth +2.3/5.0
- Appreciation +0.0/10.0
$239,999
🖨 Deal sheet (PDF) 📄 Offer letter ✓ Due diligence
Listing remarks
What's Special: Corner Lot | End Unit | Model Home | Model Leaseback. Model Home - Available Now! Built by America’s Most Trusted Homebuilder. Welcome to the Hazel at 14064 Textile Run in The Towns at Firethorn! Designed for comfort and style! Step into an inviting foyer that opens to a bright dining area and spacious great room. Toward the back, the kitchen shines with a large pantry and easy access to a charming outdoor patio—perfect for relaxing or entertaining. A convenient powder room completes the first floor. Upstairs, the private primary suite offers two generous closets and a spa-like bath, while a secondary bedroom with en-suite bath and nearby laundry make everyday li
Key facts
- End unit
- Large pantry
- Model home
Tags
Property features AI
Finance
- Other: CDD present
- Financial info: Lease restrictions apply
- HOA & community: HOA managed by Castle Management Group; Monthly HOA approximately $260 (quarterly fee shown $780); Association approval required; Association amenities: pool, playground; Community features: dog park, playground, pool, street lights; Pets allowed with restrictions and limits
Exterior
- Parking: Common parking
- Utilities: Public water; Public sewer; Cable available; Electricity available; Phone available; Sewer available; Water available; Underground utilities; Fire hydrant; Sprinkler recycled; Irrigation equipment
- Home design: Attached townhouse; Two stories; South-facing; New construction; Completed condition
- Construction: Block, concrete and stucco construction; Shingle roof; Slab foundation; Built by Taylor Morrison (model: Hazel)
- Exterior features: Hurricane shutters; Sliding doors; Storage; Corner lot; Paved road
Interior
- Kitchen: Convection oven; Dishwasher; Disposal; Microwave; Refrigerator
- Bedrooms: 2 bedrooms
- Flooring: Carpet; Tile
- Bathrooms: 2 full baths; 1 half bath
- Heating & cooling: Electric heating; Central air conditioning
- Interior features: Open floorplan; Window treatments
- Laundry & utility: Washer; Dryer; Inside laundry room; Inside utility
Neighborhood map
What this means for you Summary
Snapshot
- This is a 2-bed/2.5-bath townhouse listed at $240k.
Deal economics
- At list price, monthly cash flow is $-105 ($-1k/yr) — negative.
- To cash-flow at today's rent, offer at most $225k (6.3% below list).
- To meet the 1% rule (rent ≥ 1% of price), the offer needs to be $230k (4.3% below list).
- Recommended offer: $211k (12.0% below list) — sets the bar for market timing.
- Cap rate 5.8% vs local median 4.7% in Ruskin — meaningfully above typical; check what's discounted (condition, days-on-market, listing class) to confirm the premium yield is real.
Location & tenants
- Location reads 71/100 on livability (#392 in FL) — a middle-class / working-renter tenant base. Strengths: cost of living A+, housing A+, commute B+; Watch: amenities F, health & safety F.
- Manatee (suburban): math 54% / reading 50% proficiency, ranked #26 of 73 in FL (top 36%) — acceptable for families but not a draw, mixed tenant base, ~2y average lease.
- Zoned schools: Barbara A Harvey Elementary School (math 74% / reading 59%, grade B+, #473 of 2,144 statewide, top 23%, 1,069 students, 33% FRL); Parrish Community High School (math 47% / reading 57%, grade D+, #160 of 667 statewide, top 25%, 2,017 students, 32% FRL) — zoned schools average 33% FRL vs 51% district-wide (18 pts lower); this property's tenant base skews higher-income than the district average.
- Market conditions: Rents soft (-0.9%/yr); 2170 active listings in the ZIP; high-income renter base; 7,472 units permitted in Manatee County in 2024 (1,782 in 5+ unit buildings).
Forward outlook
- Local home prices are declining (-3.0%/yr); year-one equity from $2k of loan paydown is wiped out by about $7k of value loss. Plan a longer hold.
- Manatee County population projected at +43% by 2050 — long-run rental-demand tailwind backs the buy-and-hold thesis.
Negotiation context
- It's been on market 197 days — a 12% lower offer ($211k) is reasonable based on typical stale-listing flexibility.
Risks & watch-outs
- Climate carrying-cost: severe wind risk, 99% chance of damaging wind over 30y; moderate wildfire risk; extreme-heat days projected 7→30/yr by 2055 (HVAC capex compounding) — expect insurance premiums to compound above CPI over the hold.
Questions for the listing agent
- What do current leases actually rent for vs. the listed asking? Can we see a recent rent roll and the last 12 months of T-12 income?
- It's been on market 197 days. Have you received any prior offers? Is the seller open to a 12% concession, seller financing, or rate buy-down credit?
- What does the HOA fee cover, when was the last increase, and are there any pending special assessments or reserve-fund shortfalls?
- Why hasn't it sold? Are there any deal-killer items the seller is aware of (foundation, flood, title, zoning, code violations)?
- Is there a deadline driving the sale (1031 exchange, divorce, estate, relocation)? That informs how much negotiation room exists.
- Schools are F-rated, which usually means shorter tenancies and higher turnover. Who's the typical renter profile here, and what's been the actual vacancy rate?
- The area grade is low — what's the realistic commute time and amenity access for the typical tenant pool here? Any planned neighborhood developments (good or bad) we should know about?
- What's the average days-on-market for RENTAL listings here right now (not sales)? A rising rental-DOM trend means longer vacancies and softer asking-rent achievability than the comps imply.
- What's the recent tenant-quality profile in this submarket — average credit score on applications, eviction rate, late-payment / NSF rate, and stable-employment percentage? A property-management company in the area should have these aggregated.
- How much new for-sale + rental construction is in the pipeline within 1–3 miles? Heavy new supply typically softens prices + rents 12–24 months out; constrained supply supports both.
Investment metrics
- 1% rule
- 0.96% ✗
- Cap rate
- 5.77%
- Cash-on-cash
- -1.87%
- DSCR
- 0.92
- GRM
- 8.7
CMA / ARV
- ARV (on-the-fly)
- $216,900
- Comps found
- 12
Show comp detail 12 sales within ~0.75 mi
| Address | Dist | Beds/Ba | Sqft | Sold | Price | $/sf | Match |
|---|---|---|---|---|---|---|---|
| 14024 Textile Run | 0.04mi | 2/2.5 | 1,219 (+1%) | 0mo | $211,000 | $173 | 96 |
| 14004 Textile Run | 0.05mi | 2/2.5 | 1,205 (0%) | 2mo | $229,000 | $190 | 96 |
| 14012 Textile Run | 0.05mi | 2/2.5 | 1,219 (+1%) | 2mo | $219,999 | $180 | 94 |
| 13207 Forge Ave | 0.08mi | 2/2.5 | 1,205 (0%) | 4mo | $229,999 | $191 | 93 |
| 14028 Textile Run | 0.03mi | 2/2.5 | 1,219 (+1%) | 5mo | $219,999 | $180 | 93 |
| 13231 Forge Ave | 0.08mi | 2/2.5 | 1,219 (+1%) | 3mo | $229,999 | $189 | 92 |
| 14016 Textile Run | 0.04mi | 2/2.5 | 1,219 (+1%) | 5mo | $219,999 | $180 | 92 |
| 13173 Forge Ave | 0.09mi | 2/2.0 | 1,219 (+1%) | 0mo | $219,999 | $180 | 92 |
| 14020 Textile Run | 0.04mi | 2/2.5 | 1,219 (+1%) | 7mo | $224,999 | $185 | 91 |
| 14036 Textile Run | 0.43mi | 2/2.5 | 1,205 (0%) | 6mo | $229,999 | $191 | 75 |
| 14040 Textile Run | 0.43mi | 2/2.5 | 1,219 (+1%) | 6mo | $219,999 | $180 | 73 |
| 13181 Forge Ave | 0.09mi | 2/2.0 | 1,373 (+14%) | 1mo | $219,999 | $160 | 70 |
Match score weights: distance 35% · size 25% · config 20% · recency 20%. Top-matched comps best support the ARV.
Projected returns pro-forma
-3.0% appreciation · 0.0% rent growth · sell at horizon
- IRR
- -23.3%
- Equity multiple
- 0.22×
- Total profit
- $-52,091
- Equity at exit
- $35,785
- IRR
- -31.5%
- Equity multiple
- -0.18×
- Total profit
- $-79,159
- Equity at exit
- $20,751
Cash invested: $67,200 (down + closing). Projections, not guarantees.
Landlord ↔ Tenant lean methodology
- Overall (STATE)
- 87 Strongly Landlord-Friendly
- State Florida
- 87 Strongly Landlord-Friendly · R+3
- County
- — inherits STATE
- City
- — inherits STATE
ZIP-level market 34219
- Home prices YoY
- -23.7%
- Rents YoY
- -0.9%
- Active inventory
- 2170
- Price-to-rent
- 8.7×
Monthly cashflow live
- Estimated rent
- $2,296 medium interval (Pro) →
- Mortgage (P&I)
- −$1,259
- Tax est. 1.5%
- −$300 /mo · $3,600/yr
- Insurance
- −$100
- HOA
- −$260
- Vacancy / Maint / Mgmt
- −$482
- Net cashflow
- $-105
Break-even live
Sensitivity live
| Price | -10% $61 | -5% $-22 | +0% $-105 | +5% $-188 | +10% $-271 |
|---|---|---|---|---|---|
| Rent | -10% $-286 | -5% $-195 | +0% $-105 | +5% $-14 | +10% $77 |
| Rate | -1.0pp $16 | -0.5pp $-44 | base $-105 | +0.5pp $-167 | +1.0pp $-230 |
UW: 25.0% down · 7.5% · 30yr · 1.5% tax · 5.0% vac · 8.0% maint · 8.0% mgmt
Financing live
Cash to close
- Down payment
- $60,000
- Closing costs
- $7,200
- Reserves months
- —
- Total cash needed
- —
Loan-product check · same deal, 3 products live
Conventional
25% down · 7.5% · 30yr
- Down + closing
- —
- Monthly P&I
- —
- Monthly cashflow
- —
- DSCR
- —
- Eligible?
- —
Personal DTI + credit; lowest rate.
DSCR
20% down · 8.5% · 30yr
- Down + closing
- —
- Monthly P&I
- —
- Monthly cashflow
- —
- DSCR
- —
- Eligible?
- —
No personal income docs; deal must DSCR.
Hard money
10% down · 12.0% · 12mo
- Down + closing
- —
- Monthly P&I
- —
- Monthly cashflow
- —
- DSCR
- —
- Eligible?
- —
Short-term bridge; refi at stabilization.
HOA detail
- Monthly dues
- $260 · $3,120/yr
Listing history 16 events
-
2026-06-18days on market $239,999 Active 197 DOM
-
2026-06-17days on market $239,999 Active 196 DOM
-
2026-06-16days on market $239,999 Active 195 DOM
-
2026-06-15days on market $239,999 Active 194 DOM
-
2026-06-13days on market $239,999 Active 192 DOM
-
2026-06-13days on market $239,999 Active 191 DOM
-
2026-06-10days on market $239,999 Active 189 DOM
-
2026-06-09days on market $239,999 Active 188 DOM
-
2026-06-08days on market $239,999 Active 187 DOM
-
2026-06-08days on market $239,999 Active 186 DOM
-
2026-06-03days on market $239,999 Active 182 DOM
-
2026-06-02days on market $239,999 Active 181 DOM
-
2026-06-01days on market $239,999 Active 180 DOM
-
2026-05-31days on market $239,999 Active 179 DOM
-
2026-04-24price $239,999
-
2025-12-03$249,000 Active
ⓘ Source: listings_history table (triggers on properties + properties_extension) + one-shot
backfill from property_details.listing_events for pre-trigger history.
Climate risk First Street
- Flood 1/10 Low FEMA zone X (unshaded) · 0% chance over 30 yrs
- Wildfire 5/10 Major
- Heat 10/10 Extreme 7 d/yr ≥108°F today · 30 d/yr by 30 yrs out
- Wind 10/10 Extreme 99% chance of damaging wind over 30 yrs
- Air quality 3/10 Moderate 3 unhealthy d/yr today · 3 by 30 yrs out
Nearby sold comps map
Loading sold comps map…
Walkable amenities ~0.75 mi
Loading nearby amenities…
Taxation est. · year 1
- Rental income
- $27,553
- − Mortgage interest
- −$13,444
- − Property taxes
- −$3,600
- − Insurance
- −$1,200
- − Repairs & maintenance
- −$2,204
- − Management
- −$2,204
- − HOA
- −$3,120
- − Depreciation
- −$6,982
- Taxable loss
- −$5,201
- Est. tax savings @ 24.0%
- +$1,248
- After-tax cash flow
- $-8/yr
For passive investors: Depreciation is non-cash, so a rental often shows a tax loss while cash-flowing — sheltering income. Rental losses are passive: they offset passive income freely, and up to $25,000/yr can offset ordinary (W-2) income if you actively participate and your MAGI is under $100k (phasing out to $0 by $150k); unused losses carry forward. On sale, claimed depreciation is recaptured at up to 25%, and gains may owe capital-gains tax (a 1031 exchange can defer both). Figures are a year-1 estimate at your 24.0% rate — not tax advice; consult a CPA.
Schools (NCES district)
- District
- Manatee
- NCES district ID
- 1201230
- Math proficiency
- 54% ▼ -6.00%
- Reading proficiency
- 50% ▼ -2.00%
- Median HH income
- $49,607
- Composite
- 44.43/100
- National rank
- #2806
- State rank
- #26 of 73 in FL
Livability — Ruskin
- Score
- 71/100
- State rank
- #392
- US rank
- #6879
Category grades
Schools grade is shown separately in the Schools card above.
Census & demographics
- County
- Manatee County · 416,364 people
- City population
- 33,319
- Metro
- North Port-Sarasota-Bradenton, FL
- Population (ZIP)
- 33,296
- Household income
- $113,773
- Rent vs Own
- Severe rent burden
- 219.0
Population outlook (Manatee County) Hauer SSP2
- Today (2025)
- 447,342 people
- By 2030
- 488,911 · +9.3%
- By 2040
- 567,934 · +27.0%
- By 2050
- 637,995 · +42.6%
- By 2075
- 781,970 · +74.8%
- By 2100
- 848,272 · +89.6%
Race, ethnicity, and origin ACS 2023
- Neighborhood character
- Predominantly White (75%)
- Race & ethnicity
- White 75% Hispanic / Latino 11% Two or more races 8% Black 8% Asian 2%
- Hispanic origin (detail)
- Mexican 2% Puerto Rican 3%
- Common ancestry
- Romanian 4% Hispanic 2% Russian 2%
- Foreign-born
- 10% · Canada, Dominican Republic, Jamaica
- Languages at home
- 88% English-only · Spanish 7% French/Haitian/Cajun 2% Other Asian/Pacific 1%
Political lean MEDSL · Manatee
- 2024 margin
- Strong R (+23.5) · D 37.9% · R 61.4%
- 2008→2024 swing
- -16.5pp toward R · 2008: -7.0pp · 2024: -23.5pp
- All cycles
- 2024: R+23.5 2020: R+16.1 2016: R+17.1 2012: R+12.5 2008: R+7.0
Not yet ingested
- Civics
- —
Market trends
- HPI YoY
- ▼ -84.45%
- Current HPI
- 271.7131
- Rent YoY
- ▼ -0.95%
- Metro
- North Port-Sarasota-Bradenton, FL
- State GDP YoY
- ▲ 3.28%
- F500 in state
- 36
Industry mix (Fortune 500 HQ in FL)
| Industry | F500 HQs | Revenue |
|---|---|---|
| Industrial Technology | 2 | $29B |
|
||
| Insurance | 2 | $17B |
|
||
| Retail | 1 | $60B |
|
||
| Technology Distribution | 1 | $58B |
|
||
| Homebuilding | 1 | $35B |
|
||
| Technology Manufacturing | 1 | $35B |
|
||
Price history
-3.6% since first listed2 events — show timeline
- 2026-04-24 Price Changed $239,999 Stellar MLS as Distributed by MLS Grid
- 2025-12-03 Listed $249,000 Stellar MLS as Distributed by MLS Grid
Cash-flow waterfall
monthlySold comps — $/sqft
last 12 mo · ≤1 miLoading sold comps…