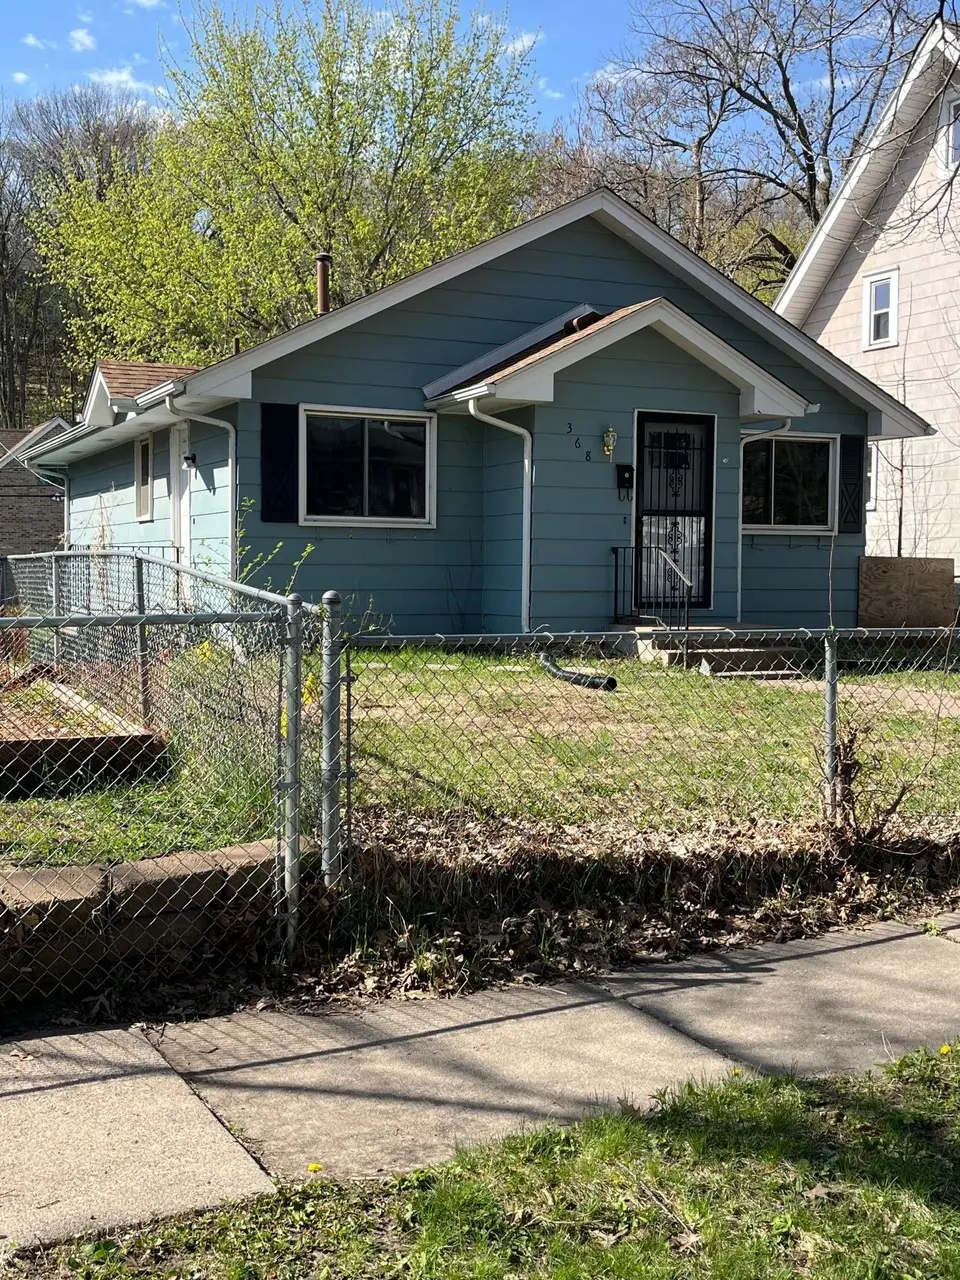
368 Sidney St E · St. Paul, MN
Flood risk 1/10 · Minimal
- FEMA flood zone
- X (unshaded)
- Chance of flooding over 30 yrs
- 0.0%
- Est. flood insurance / yr
- $473 – $860
Fire risk 1/10 · Minimal
- Est. fire insurance / yr
- $888 – $1,650
Heat risk 2/10 · Minimal
- Hot days now (above 100°F)
- 7 days/yr
- Hot days in 30 yrs
- 14 days/yr
Wind risk 2/10 · Minimal
- Chance of severe wind over 30 yrs
- —
Air-quality risk 2/10 · Minimal
- Unhealthy air days now
- 1 days/yr
- Unhealthy air days in 30 yrs
- 1 days/yr
Risk factors via First Street. Map © Google.
Why this score? — see what drove the D grade
The composite is a weighted blend of 9 inputs, each scored 0–100. Each bar is that input's sub-score; the figure is the points it added to the 100-point composite (weight × sub-score).
- ARV discount +15.0/15.0
- Cash flow +8.1/30.0
- Rent growth +5.0/5.0
- 1% rule +2.9/10.0
- Livability +2.5/5.0
- Condition / age +2.5/5.0
- Schools +2.4/10.0
- DSCR +2.1/10.0
- Appreciation +0.0/10.0
$219,000
🖨 Deal sheet 📄 Offer letter ✓ Due diligence
Listing remarks MLS
Come see this three-bedroom, two bath home in St. Paul on the west side! Easy access to downtown St. Paul and surrounding suburbs to the east and south. This home is move-in ready and waiting for your finishing touches. There is a bonus room in the basement that could be a future bedroom with the addition of an egress window. This home has everything you need -- schedule a visit today!
Key facts
- 4,791 sq ft lot
- Built 1980
- Listed 62 days
Neighborhood map
What this means for you Summary
Snapshot
- This is a 3-bed/1.5-bath single-family listed at $219k.
Deal economics
- At list price, monthly cash flow is $-213 ($-3k/yr) — negative.
- To cash-flow at today's rent, offer at most $181k (17.2% below list).
- To meet the 1% rule (rent ≥ 1% of price), the offer needs to be $173k (20.9% below list).
- Recommended offer: $173k (20.9% below list) — sets the bar for 1% rule.
Location & tenants
- Location reads: area grade D — affects rentability + tenant quality, not the cash-flow math above.
- St. Paul Public School District (urban): math 21% / reading 33% proficiency, ranked #270 of 301 in MN (top 90%) — low school quality limits family demand, transient renter base, plan for 1-2y turnover; 64% free/reduced lunch — lower-income household profile, screen leases tightly.
- Market conditions: Rents rising fast (+10.8%/yr); 64 active listings in the ZIP; 8 comparable units currently listed for rent nearby; rentals leasing fast (median 5d on market — plan ~1-2 weeks tenant-placement turnaround); 1,202 units permitted in Ramsey County in 2024 (880 in 5+ unit buildings).
Forward outlook
- Local home prices are declining (-3.0%/yr); year-one equity from $2k of loan paydown is wiped out by about $7k of value loss. Plan a longer hold.
- Ramsey County population projected at +27% by 2050 — long-run rental-demand tailwind backs the buy-and-hold thesis.
Negotiation context
- It's been on market 62 days — a 6% lower offer ($206k) is reasonable based on typical stale-listing flexibility.
- 3 sale attempts since 22y ago; this cycle's ask is 4% above the opening price — seller raised mid-cycle; expect resistance to lowballs.
- Current owner paid $165k; 33% above their basis — modest negotiation headroom, anchor on the comps not their cost.
Questions for the listing agent
- What do current leases actually rent for vs. the listed asking? Can we see a recent rent roll and the last 12 months of T-12 income?
- It's been on market 62 days. Have you received any prior offers? Is the seller open to a 21% concession, seller financing, or rate buy-down credit?
- Why hasn't it sold? Are there any deal-killer items the seller is aware of (foundation, flood, title, zoning, code violations)?
- Is there a deadline driving the sale (1031 exchange, divorce, estate, relocation)? That informs how much negotiation room exists.
- The area grade is low — what's the realistic commute time and amenity access for the typical tenant pool here? Any planned neighborhood developments (good or bad) we should know about?
- What's the average days-on-market for RENTAL listings here right now (not sales)? A rising rental-DOM trend means longer vacancies and softer asking-rent achievability than the comps imply.
- What's the recent tenant-quality profile in this submarket — average credit score on applications, eviction rate, late-payment / NSF rate, and stable-employment percentage? A property-management company in the area should have these aggregated.
- How much new for-sale + rental construction is in the pipeline within 1–3 miles? Heavy new supply typically softens prices + rents 12–24 months out; constrained supply supports both.
Investment metrics
- 1% rule
- 0.79% ✗
- Cap rate
- 5.13%
- Cash-on-cash
- -4.17%
- DSCR
- 0.81
- GRM
- 10.5
CMA / ARV
- ARV (median comp)
- $304,917
- List price
- $219,000
- Delta
- -28.18%
- Verdict
- UNDERPRICED
- Comps
- 3 within 1.0 mi
Projected returns pro-forma
-3.0% appreciation · 8.0% rent growth · sell at horizon
- IRR
- -17.6%
- Equity multiple
- 0.35×
- Total profit
- $-39,834
- Equity at exit
- $32,654
- IRR
- -2.0%
- Equity multiple
- 0.83×
- Total profit
- $-10,202
- Equity at exit
- $18,935
Cash invested: $61,320 (down + closing). Projections, not guarantees.
Landlord ↔ Tenant lean methodology
- Overall (STATE)
- 46 Balanced
- State Minnesota
- 46 Balanced · D+2
- County
- — inherits STATE
- City
- — inherits STATE
ZIP-level market 55107
- Home prices YoY
- -16.2%
- Rents YoY
- 10.8%
- Active inventory
- 64
- Price-to-rent
- 10.5×
Monthly cashflow live
- Estimated rent
- $1,733 high interval (Pro) →
- Mortgage (P&I)
- −$1,148
- Tax from tax record
- −$342 /mo · $4,110/yr
- Insurance
- −$91
- HOA
- −$0
- Vacancy / Maint / Mgmt
- −$364
- Net cashflow
- $-213
Break-even live
UW: 25.0% down · 7.5% · 30yr · 1.5% tax · 5.0% vac · 8.0% maint · 8.0% mgmt
Financing live
Cash to close
- Down payment
- $54,750
- Closing costs
- $6,570
- Reserves months
- —
- Total cash needed
- —
Loan-product check · same deal, 3 products live
Conventional
25% down · 7.5% · 30yr
- Down + closing
- —
- Monthly P&I
- —
- Monthly cashflow
- —
- DSCR
- —
- Eligible?
- —
Personal DTI + credit; lowest rate.
DSCR
20% down · 8.5% · 30yr
- Down + closing
- —
- Monthly P&I
- —
- Monthly cashflow
- —
- DSCR
- —
- Eligible?
- —
No personal income docs; deal must DSCR.
Hard money
10% down · 12.0% · 12mo
- Down + closing
- —
- Monthly P&I
- —
- Monthly cashflow
- —
- DSCR
- —
- Eligible?
- —
Short-term bridge; refi at stabilization.
Rent comps 8 comps
| Address | Beds | Baths | Sqft | Rent | $/sqft | DOM | Units | Dist |
|---|---|---|---|---|---|---|---|---|
| 422 Arion St E West St Paul, MN | 2.0 | 1.0 | 1072 | $1,395 | $1.30 | 24d | 1 | 0.71mi |
| 421 Stanley St Unit 423 St Paul, MN | 2.0 | 1.0 | 1350 | $1,850 | $1.37 | 4d | 1 | 0.74mi |
| 993 Robert St S Saint Paul, MN | 2.0 | 2.0 | 1214 | $1,765 | $1.45 | 4d | 1 | 0.76mi |
| 460 Stanley St Unit 2 West St Paul, MN | 2.0 | 1.0 | 925 | $1,300 | $1.41 | 14d | 1 | 0.79mi |
| 140 Belvidere St W Unit 1 St Paul, MN | 2.0 | 1.0 | 1600 | $1,650 | $1.03 | 2d | 1 | 1.06mi |
| 45 Butler Ave E Saint Paul, MN | 1.0–3.0 | 1.0–2.0 | 1040 | $1,682 | $1.62 | 1d | 12 | 1.09mi |
| 1905 Parkwood Dr South Saint Paul, MN | 2.0 | 1.0–2.0 | 972 | $1,470 | $1.51 | 2d | 7 | 1.27mi |
| 1266 Gorman Ave Saint Paul, MN | 1.0–2.0 | 1.0 | 816 | $1,329 | $1.63 | 16d | 3 | 1.30mi |
Listing history 23 events
-
2026-06-17status $219,000 Pending 62 DOM
-
2026-06-17days on market $219,000 Contingent - Inspection 62 DOM
-
2026-06-16days on market $219,000 Contingent - Inspection 61 DOM
-
2026-06-15days on market $219,000 Contingent - Inspection 60 DOM
-
2026-06-13days on market $219,000 Contingent - Inspection 58 DOM
-
2026-06-09days on market $219,000 Contingent - Inspection 54 DOM
-
2026-06-08statusdays on market $219,000 Contingent - Inspection 53 DOM
-
2026-06-07days on market $219,000 Active 52 DOM
-
2026-06-04days on market $219,000 Active 49 DOM
-
2026-06-03days on market $219,000 Active 48 DOM
-
2026-06-02days on market $219,000 Active 47 DOM
-
2026-06-01days on market $219,000 Active 46 DOM
-
2026-05-31days on market $219,000 Active 45 DOM
-
2026-05-05price $219,000 392-char remark
Show marketing remark (392 chars)
Come see this three-bedroom, two bath home in St. Paul on the west side! Easy access to downtown St. Paul and surrounding suburbs to the east and south. This home is move-in ready and waiting for your finishing touches. There is a bonus room in the basement that could be a future bedroom with the addition of an egress window. This home has everything you need -- schedule a visit today!
-
2026-04-17price $224,900 392-char remark
Show marketing remark (392 chars)
Come see this three-bedroom, two bath home in St. Paul on the west side! Easy access to downtown St. Paul and surrounding suburbs to the east and south. This home is move-in ready and waiting for your finishing touches. There is a bonus room in the basement that could be a future bedroom with the addition of an egress window. This home has everything you need -- schedule a visit today!
-
2026-04-16$210,000 Active 392-char remark
Show marketing remark (392 chars)
Come see this three-bedroom, two bath home in St. Paul on the west side! Easy access to downtown St. Paul and surrounding suburbs to the east and south. This home is move-in ready and waiting for your finishing touches. There is a bonus room in the basement that could be a future bedroom with the addition of an egress window. This home has everything you need -- schedule a visit today!
-
2025-01-27historical $2,100
-
2024-12-13$2,100
-
2004-08-02soldstatus $164,900
-
2004-06-25soldstatus $164,900 265-char remark
Show marketing remark (265 chars)
CLEAN & NEAT RAMBLER W/AN EXCELLENT KIT/DINING SET UP. NICE SIZE ROOMS, MSTR BDRM HAS DOUBLE CLOSETS. LOWER LVL. HAS AMPLE STORAGE - FAM RM & 3RD BDRM. THE YARD IS FENCED & THERE IS A LOT OF SPACE FOR A FUTURE GARAGE. ALL APPL STAY - READY FOR NEW BUYER
-
2004-05-14historical 265-char remark
Show marketing remark (265 chars)
CLEAN & NEAT RAMBLER W/AN EXCELLENT KIT/DINING SET UP. NICE SIZE ROOMS, MSTR BDRM HAS DOUBLE CLOSETS. LOWER LVL. HAS AMPLE STORAGE - FAM RM & 3RD BDRM. THE YARD IS FENCED & THERE IS A LOT OF SPACE FOR A FUTURE GARAGE. ALL APPL STAY - READY FOR NEW BUYER
-
2004-05-08$159,900 265-char remark
Show marketing remark (265 chars)
CLEAN & NEAT RAMBLER W/AN EXCELLENT KIT/DINING SET UP. NICE SIZE ROOMS, MSTR BDRM HAS DOUBLE CLOSETS. LOWER LVL. HAS AMPLE STORAGE - FAM RM & 3RD BDRM. THE YARD IS FENCED & THERE IS A LOT OF SPACE FOR A FUTURE GARAGE. ALL APPL STAY - READY FOR NEW BUYER
-
2001-07-02soldstatus $103,090
ⓘ Source: listings_history table (triggers on properties + properties_extension) + one-shot
backfill from property_details.listing_events for pre-trigger history.
Tax reassessment forecast MN · Partial reset (capped growth)
- Current annual tax
- $4,110 · $342/mo
- Projected year-2 tax
- $4,110 · $342/mo
- Expected delta
- $0/yr ($0/mo · 0.0%)
ⓘ Screening estimate from a state-policy table — verify with the county assessor before closing.
Climate risk First Street
- Flood 1/10 Low FEMA zone X (unshaded) · 0% chance over 30 yrs
- Wildfire 1/10 Low
- Heat 2/10 Low 7 d/yr ≥100°F today · 14 d/yr by 30 yrs out
- Wind 2/10 Low
- Air quality 2/10 Low 1 unhealthy d/yr today · 1 by 30 yrs out
Nearby sold comps map
Loading sold comps map…
Walkable amenities ~0.75 mi
Loading nearby amenities…
Taxation est. · year 1
- Rental income
- $20,796
- − Mortgage interest
- −$12,267
- − Property taxes
- −$4,110
- − Insurance
- −$1,095
- − Repairs & maintenance
- −$1,664
- − Management
- −$1,664
- − Depreciation
- −$6,371
- Taxable loss
- −$6,374
- Est. tax savings @ 24.0%
- +$1,530
- After-tax cash flow
- $-1,028/yr
For passive investors: Depreciation is non-cash, so a rental often shows a tax loss while cash-flowing — sheltering income. Rental losses are passive: they offset passive income freely, and up to $25,000/yr can offset ordinary (W-2) income if you actively participate and your MAGI is under $100k (phasing out to $0 by $150k); unused losses carry forward. On sale, claimed depreciation is recaptured at up to 25%, and gains may owe capital-gains tax (a 1031 exchange can defer both). Figures are a year-1 estimate at your 24.0% rate — not tax advice; consult a CPA.
Schools (NCES district)
- District
- St. Paul Public School District
- NCES district ID
- 2733840
- Math proficiency
- 21% ▼ -11.00%
- Reading proficiency
- 33% ▼ -7.00%
- Median HH income
- $48,316
- Composite
- 23.51/100
- National rank
- #7868
- State rank
- #270 of 301 in MN
Livability — St. Paul
No livability data for this city. (Only ~50 U.S. cities are tracked.)
Census & demographics
- Census place
- St. Paul, MN
- County
- Ramsey County · 542,837 people
- City population
- 280,599
- Metro
- Minneapolis-St. Paul-Bloomington, MN-WI
- Population (ZIP)
- 15,377
- Household income
- $74,531
- Rent vs Own
- Severe rent burden
- 639.0
Population outlook (Ramsey County) Hauer SSP2
- Today (2025)
- 603,431 people
- By 2030
- 636,459 · +5.5%
- By 2040
- 700,596 · +16.1%
- By 2050
- 765,819 · +26.9%
- By 2075
- 929,297 · +54.0%
- By 2100
- 1,053,924 · +74.7%
Race, ethnicity, and origin ACS 2023
- Neighborhood character
- Highly diverse neighborhood (Simpson 0.71)
- Race & ethnicity
- White 47% Hispanic / Latino 23% Two or more races 16% Black 13% Asian 9% Native American 2%
- Hispanic origin (detail)
- Mexican 19%
- Common ancestry
- Portuguese 7% Lithuanian 3% Romanian 2%
- Foreign-born
- 18% · Canada, Philippines, Vietnam
- Languages at home
- 72% English-only · Spanish 15% Other Asian/Pacific 4% Tagalog/Filipino 2%
Political lean MEDSL · Ramsey
- 2024 margin
- Solid D (+43.3) · D 70.5% · R 27.2% · Other 2.3%
- 2008→2024 swing
- +9.4pp toward D · 2008: 33.9pp · 2024: 43.3pp
- All cycles
- 2024: D+43.3 2020: D+45.4 2016: D+39.4 2012: D+35.3 2008: D+33.9
Not yet ingested
- Civics
- —
Market trends
- HPI YoY
- ▼ -57.70%
- Current HPI
- 298.8714
- Rent YoY
- ▲ 10.76%
- Metro
- Minneapolis-St. Paul-Bloomington, MN-WI
- State GDP YoY
- ▲ 2.41%
- F500 in state
- 34
Industry mix (Fortune 500 HQ in MN)
| Industry | F500 HQs | Revenue |
|---|---|---|
| Healthcare | 2 | $407B |
|
||
| Retail | 2 | $150B |
|
||
| Consumer Goods | 2 | $32B |
|
||
| Industrial Machinery | 2 | $6B |
|
||
| Agriculture | 1 | $40B |
|
||
| Healthcare / Medical Devices | 1 | $32B |
|
||
Price history
+112.4% since first listed10 events — show timeline
- 2026-05-05 Price Changed $219,000 NORTHSTARMLS as Distributed by MLS Grid
- 2026-04-17 Price Changed $224,900 NORTHSTARMLS as Distributed by MLS Grid
- 2026-04-16 Listed $210,000 NORTHSTARMLS as Distributed by MLS Grid
- 2025-01-27 Rental Removed $2,100 RENT.
- 2024-12-13 Listed for Rent $2,100 RENT.
- 2004-08-02 Sold (Public Records) $164,900 Public Records
- 2004-06-25 Sold (MLS) $164,900 NORTHSTARMLS as Distributed by MLS Grid
- 2004-05-14 Listing Removed — NORTHSTARMLS as Distributed by MLS Grid
- 2004-05-08 Listed $159,900 NORTHSTARMLS as Distributed by MLS Grid
- 2001-07-02 Sold (Public Records) $103,090 Public Records
Property tax history
+7.1%/yrLatest (2025): $4,110 · +28.4% YoY. Source: county tax records.
Cash-flow waterfall
monthlySold comps — $/sqft
last 12 mo · ≤1 miLoading sold comps…