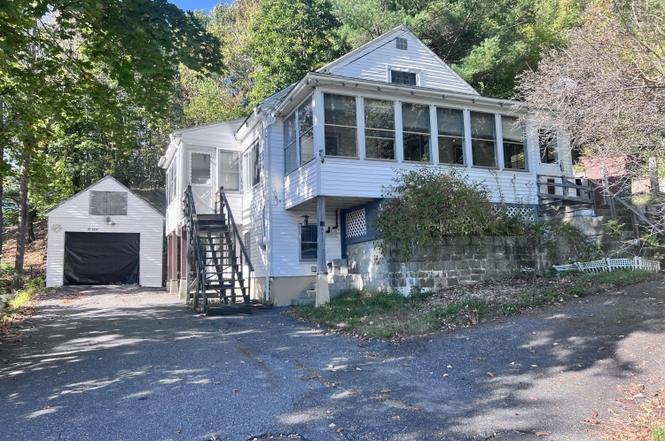
10 Otis St · Chisholm, ME
Flood risk No data
- FEMA flood zone
- —
- Chance of flooding over 30 yrs
- —
- Est. flood insurance / yr
- —
Fire risk No data
- Est. fire insurance / yr
- —
Heat risk No data
- Hot days now (above threshold)
- —
- Hot days in 30 yrs
- —
Wind risk No data
- Chance of severe wind over 30 yrs
- —
Air-quality risk No data
- Unhealthy air days now
- —
- Unhealthy air days in 30 yrs
- —
Risk factors via First Street. Map © Google.
Why this score? — see what drove the B grade
The composite is a weighted blend of 9 inputs, each scored 0–100. Each bar is that input's sub-score; the figure is the points it added to the 100-point composite (weight × sub-score).
- Cash flow +24.4/30.0
- Appreciation +10.0/10.0
- DSCR +7.9/10.0
- ARV discount +7.5/15.0
- 1% rule +6.6/10.0
- Schools +6.5/10.0
- Livability +3.7/5.0
- Rent growth +2.5/5.0
- Condition / age +2.5/5.0
$99,999
🖨 Deal sheet 📄 Offer letter ✓ Due diligence
Listing remarks MLS
0007, Private corner lot, lovely stone walls built into a three level yard with stone staircases up to each level, a Must See! Solid home in need of a little cosmetic improvement. Two sunporches, three season.
Key facts
- Hardwood flooring
- Galley kitchen
- Seasonal views
Tags
Property features AI
Finance
- Financial info: Annual tax amount listed (financial specifics provided separately)
Exterior
- Parking: Detached 1-car garage; Paved on-site parking with 1–4 spaces
- Utilities: Public water; Public sewer; Circuit breakers for electrical service; Electric water heater (off heating system)
- Home design: Single family residence; Multi-level home; Built in 1937; Water heater and smart electric meter noted for energy efficiency
- Construction: Wood frame with vinyl siding; Shingle roof; Per public records
- Exterior features: Glassed-in porch; Shed(s); Intown, near town setting; Paved road access
Interior
- Kitchen: Electric range; Refrigerator
- Bedrooms: Primary bedroom on the first floor with closet; Bedroom 2 on the first floor with closet; Bedroom 3 on the second floor with closet; Bedroom 4 on the second floor with closet
- Flooring: Carpet; Laminate; Hardwood
- Bathrooms: 1 full bathroom
- Heating & cooling: Baseboard heating; Window air conditioning units
- Interior features: First-floor bedroom; Bathtub; Shower; Storage; 32–36 inch doorways for improved accessibility; Double-pane and storm windows; Internet access available
- Laundry & utility: Basement with interior entry, walk-out access and daylight exposure (full, unfinished)
Neighborhood map
What this means for you Summary
Snapshot
- This is a 4-bed/1.0-bath other listed at $100k.
Deal economics
- At list price, monthly cash flow is $204 ($2k/yr) — positive.
- The deal already cash-flows at list — no discount required.
- Meets the 1% rule at list price ($1k rent vs $100k).
- Recommended offer: $94k (6.0% below list) — sets the bar for market timing.
Location & tenants
- Location reads 74/100 on livability (#43 in ME, #4,630 nationally) — a middle-class / working-renter tenant base. Strengths: crime A+, cost of living A+, housing A+; Watch: employment C-, amenities F, commute F.
- RSU 73 (rural): math 75% / reading 81% proficiency, ranked #91 of 112 in ME (top 81%) — strong family-tenant draw, lease renewals of 3-5y typical.
- Market conditions: 31 active listings in the ZIP; 164 units permitted in Franklin County in 2024 (0 in 5+ unit buildings).
Forward outlook
- In year one you build about $11k of equity ($691 loan paydown + $10k appreciation (10.0% local appreciation)).
- Franklin County population projected at -21% by 2050 — secular population decline; favor cash flow + early exit over multi-decade hold.
- At projected returns (10.0% appreciation + 3.0% rent growth), your $28k cash investment doubles in ~3 years — after that, you're playing with house money.
- By year 4, paydown + projected appreciation supports a ~$38k cash-out refi (75% LTV) — recoverable capital for the next deal without selling this one.
Negotiation context
- It's been on market 69 days — a 6% lower offer ($94k) is reasonable based on typical stale-listing flexibility.
- 3 sale attempts since 16y ago; this cycle's ask has dropped $50k (33%) from the opening price — seller is motivated, your offer sets the floor, not the list.
- Current owner paid $48k; list at $100k implies a 106% gain — meaningful room to come down on a strong offer.
Risks & watch-outs
- Watch-outs: built in 1937 — expect roof / HVAC / electrical / plumbing capex.
Questions for the listing agent
- It's been on market 69 days. Have you received any prior offers? Is the seller open to a 6% concession, seller financing, or rate buy-down credit?
- Built in 1937 — when were the roof, HVAC, electrical panel, plumbing, and water heater last replaced?
- Why hasn't it sold? Are there any deal-killer items the seller is aware of (foundation, flood, title, zoning, code violations)?
- Is there a deadline driving the sale (1031 exchange, divorce, estate, relocation)? That informs how much negotiation room exists.
- What's the average days-on-market for RENTAL listings here right now (not sales)? A rising rental-DOM trend means longer vacancies and softer asking-rent achievability than the comps imply.
- What's the recent tenant-quality profile in this submarket — average credit score on applications, eviction rate, late-payment / NSF rate, and stable-employment percentage? A property-management company in the area should have these aggregated.
- How much new for-sale + rental construction is in the pipeline within 1–3 miles? Heavy new supply typically softens prices + rents 12–24 months out; constrained supply supports both.
Investment metrics
- 1% rule
- 1.16% ✓
- Cap rate
- 8.74%
- Cash-on-cash
- 8.75%
- DSCR
- 1.39
- GRM
- 7.2
CMA / ARV
No comps found within radius.
Projected returns pro-forma
10.0% appreciation · 3.0% rent growth · sell at horizon
- IRR
- 30.7%
- Equity multiple
- 3.41×
- Total profit
- $67,487
- Equity at exit
- $90,087
- IRR
- 26.6%
- Equity multiple
- 7.73×
- Total profit
- $188,573
- Equity at exit
- $194,276
Cash invested: $28,000 (down + closing). Projections, not guarantees.
Landlord ↔ Tenant lean methodology
- Overall (STATE)
- 41 Moderately Tenant-Leaning
- State Maine
- 41 Moderately Tenant-Leaning · D+2
- County
- — inherits STATE
- City
- — inherits STATE
ZIP-level market 04239
- Home prices YoY
- 5.3%
- Active inventory
- 31
- Price-to-rent
- 7.2×
Monthly cashflow live
- Estimated rent
- $1,156 medium interval (Pro) →
- Mortgage (P&I)
- −$524
- Tax from tax record
- −$143 /mo · $1,714/yr
- Insurance
- −$42
- HOA
- −$0
- Vacancy / Maint / Mgmt
- −$243
- Net cashflow
- $204
Break-even live
UW: 25.0% down · 7.5% · 30yr · 1.5% tax · 5.0% vac · 8.0% maint · 8.0% mgmt
Financing live
Cash to close
- Down payment
- $25,000
- Closing costs
- $3,000
- Reserves months
- —
- Total cash needed
- —
Loan-product check · same deal, 3 products live
Conventional
25% down · 7.5% · 30yr
- Down + closing
- —
- Monthly P&I
- —
- Monthly cashflow
- —
- DSCR
- —
- Eligible?
- —
Personal DTI + credit; lowest rate.
DSCR
20% down · 8.5% · 30yr
- Down + closing
- —
- Monthly P&I
- —
- Monthly cashflow
- —
- DSCR
- —
- Eligible?
- —
No personal income docs; deal must DSCR.
Hard money
10% down · 12.0% · 12mo
- Down + closing
- —
- Monthly P&I
- —
- Monthly cashflow
- —
- DSCR
- —
- Eligible?
- —
Short-term bridge; refi at stabilization.
Listing history 9 events
-
2026-06-12statusdays on market $99,999 Pending 69 DOM
-
2026-06-09days on market $99,999 Active 67 DOM
-
2026-06-08days on market $99,999 Active 66 DOM
-
2026-06-07days on market $99,999 Active 65 DOM
-
2026-06-07days on market $99,999 Active 64 DOM
-
2026-06-04days on market $99,999 Active 61 DOM
-
2026-06-02days on market $99,999 Active 60 DOM
-
2026-06-01remarks 699-char remark
-
2026-06-01$99,999 Active 59 DOM
ⓘ Source: listings_history table (triggers on properties + properties_extension) + one-shot
backfill from property_details.listing_events for pre-trigger history.
Tax reassessment forecast ME · Partial reset (capped growth)
- Current annual tax
- $1,714 · $143/mo
- Projected year-2 tax
- $1,714 · $143/mo
- Expected delta
- $0/yr ($0/mo · 0.0%)
ⓘ Screening estimate from a state-policy table — verify with the county assessor before closing.
Nearby sold comps map
Loading sold comps map…
Walkable amenities ~0.75 mi
Loading nearby amenities…
Taxation est. · year 1
- Rental income
- $13,868
- − Mortgage interest
- −$5,601
- − Property taxes
- −$1,714
- − Insurance
- −$500
- − Repairs & maintenance
- −$1,109
- − Management
- −$1,109
- − Depreciation
- −$2,909
- Taxable income
- $924
- Est. tax owed @ 24.0%
- −$222
- After-tax cash flow
- $2,227/yr
For passive investors: Depreciation is non-cash, so a rental often shows a tax loss while cash-flowing — sheltering income. Rental losses are passive: they offset passive income freely, and up to $25,000/yr can offset ordinary (W-2) income if you actively participate and your MAGI is under $100k (phasing out to $0 by $150k); unused losses carry forward. On sale, claimed depreciation is recaptured at up to 25%, and gains may owe capital-gains tax (a 1031 exchange can defer both). Figures are a year-1 estimate at your 24.0% rate — not tax advice; consult a CPA.
Schools (NCES district)
- District
- RSU 73
- NCES district ID
- 2314805
- Math proficiency
- 75% ▲ 50.00%
- Reading proficiency
- 81% ▲ 38.00%
- Median HH income
- $44,547
- Composite
- 65.46/100
- National rank
- #477
- State rank
- #91 of 112 in ME
Livability — Chisholm
- Score
- 74/100
- State rank
- #43
- US rank
- #4630
Category grades
Schools grade is shown separately in the Schools card above.
Census & demographics
- Census place
- Chisholm, ME
- Population (ZIP)
- 4,644
Population outlook (Franklin County) Hauer SSP2
- Today (2025)
- 28,948 people
- By 2030
- 27,889 · -3.7%
- By 2040
- 25,275 · -12.7%
- By 2050
- 22,770 · -21.3%
- By 2075
- 18,980 · -34.4%
- By 2100
- 16,816 · -41.9%
Race, ethnicity, and origin ACS 2023
- Neighborhood character
- Predominantly White (95%)
- Race & ethnicity
- White 95% Two or more races 4% Asian 2%
- Common ancestry
- Lithuanian 10% Italian 4% German 2%
- Foreign-born
- 3% · Canada
- Languages at home
- 97% English-only · French/Haitian/Cajun 2% Tagalog/Filipino 1%
Political lean MEDSL · Franklin
- 2024 margin
- Lean R (+8.2) · D 44.8% · R 53.0% · Other 2.2%
- 2008→2024 swing
- -28.5pp toward R · 2008: 20.3pp · 2024: -8.2pp
- All cycles
- 2024: R+8.2 2020: R+3.9 2016: R+5.5 2012: D+18.5 2008: D+20.3
Not yet ingested
- Civics
- —
Market trends
- HPI YoY
- ▲ 14.17%
- Current HPI
- 279.4231
- Rent YoY
- —
- Metro
- —
- State GDP YoY
- —
- F500 in state
- 0
Price history
+68.1% since first listed8 events — show timeline
- 2026-06-01 Relisted — MREIS
- 2026-06-01 Price Changed $99,999 MREIS
- 2025-12-05 Delisted — MREIS
- 2025-11-03 Price Changed $110,000 MREIS
- 2025-10-20 Price Changed $130,000 MREIS
- 2025-10-07 Listed $150,000 MREIS
- 2011-08-11 Sold (MLS) $48,500 MREIS
- 2010-08-18 Listed $59,500 MREIS
Property tax history
+7.2%/yrLatest (2025): $1,714 · +53.3% YoY. Source: county tax records.
Cash-flow waterfall
monthlySold comps — $/sqft
last 12 mo · ≤1 miLoading sold comps…