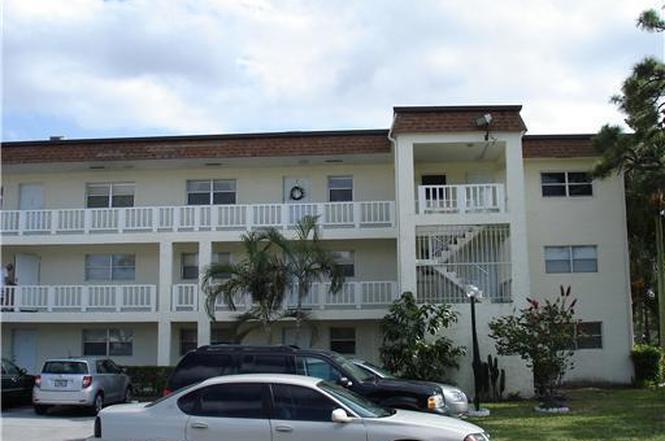
3500 SW Natura Blvd #203 · Deerfield Beach, FL
Flood risk 1/10 · Minimal
- FEMA flood zone
- X (shaded)
- Chance of flooding over 30 yrs
- 0.0%
- Est. flood insurance / yr
- $507 – $1,088
Fire risk 1/10 · Minimal
- Est. fire insurance / yr
- $947 – $1,759
Heat risk 9/10 · Severe
- Hot days now (above 107°F)
- 7 days/yr
- Hot days in 30 yrs
- 26 days/yr
Wind risk 10/10 · Severe
- Chance of severe wind over 30 yrs
- 99.0%
Air-quality risk 2/10 · Minimal
- Unhealthy air days now
- 1 days/yr
- Unhealthy air days in 30 yrs
- 3 days/yr
Risk factors via First Street. Map © Google.
Why this score? — see what drove the C+ grade
The composite is a weighted blend of 9 inputs, each scored 0–100. Each bar is that input's sub-score; the figure is the points it added to the 100-point composite (weight × sub-score).
- Cash flow +25.3/30.0
- 1% rule +10.0/10.0
- DSCR +8.3/10.0
- ARV discount +7.5/15.0
- Schools +4.1/10.0
- Livability +3.8/5.0
- Rent growth +3.0/5.0
- Condition / age +2.5/5.0
- Appreciation +0.0/10.0
$119,000
🖨 Deal sheet 📄 Offer letter ✓ Due diligence
Listing remarks
GREAT INVESTMENT PROPERTY, ABLE TO RENT RIGHT AWAY. BEING RENTED AT THE MOMENT WITH LEASE EXPIRES IN NOVEMBER 2026, TENANT BEEN THERE FOR 14 YEARS AND IS WILLING TO STAY IF INVESTER BUYS IT. GREAT REMODELED 2/2 UNIT AT A GREAT PRICE.
Key facts
- $817 HOA
- Community pool
- Built 1974
Property features AI
Finance
- HOA & community: HOA with monthly fee; Community pool; Senior community (age-restricted)
Exterior
- Utilities: Public water; Public sewer; Cable available; Water available; Sewer available
- Home design: Condominium; 3-story building; Faces north; Resale property
- Construction: CBS construction
- Exterior features: Not waterfront
Interior
- Kitchen: Dishwasher; Electric range; Refrigerator
- Bedrooms: 2 bedrooms (main level)
- Flooring: Ceramic tile
- Bathrooms: 2 full bathrooms (main level)
- Heating & cooling: Central electric heating; Central electric cooling
- Interior features: Unfurnished; Electric water heater
Neighborhood map
What this means for you Summary
Snapshot
- This is a 2-bed/2.0-bath condo listed at $119k.
Deal economics
- At list price, monthly cash flow is $270 ($3k/yr) — positive.
- The deal already cash-flows at list — no discount required.
- Meets the 1% rule at list price ($3k rent vs $119k).
- Recommended offer: $105k (12.0% below list) — sets the bar for market timing.
- Cap rate 9.0% vs local median 4.2% in Deerfield Beach — top-decile yield for the area; either an underpriced asset or a hidden risk that comps aren't pricing in. Stress-test before assuming the spread holds.
Location & tenants
- Location reads 75/100 on livability (#250 in FL, #3,970 nationally) — a middle-class / working-renter tenant base. Strengths: housing A+, health & safety A+, cost of living A; Watch: schools D-, amenities D-, employment D-.
- Broward (suburban): math 42% / reading 53% proficiency, ranked #46 of 73 in FL (top 63%) — families likely to look elsewhere, expect single-tenant / working-renter base with shorter leases.
- Market conditions: Rents rising (+2.2%/yr); 297 active listings in the ZIP; 40 comparable units currently listed for rent nearby; rentals at typical pace (median 22d on market — plan ~3-4 weeks tenant-placement turnaround); 2,111 units permitted in Broward County in 2024 (1,265 in 5+ unit buildings).
- At $2,536/mo this rent would consume 52% of the median local household income ($59k/yr) (locally 2148% of renters already pay >50% of income on rent) — very limited rent-growth headroom before tenants either downsize or default.
Forward outlook
- Local home prices are declining (-3.0%/yr); year-one equity from $823 of loan paydown is wiped out by about $4k of value loss. Plan a longer hold.
- Broward County population projected at +34% by 2050 — long-run rental-demand tailwind backs the buy-and-hold thesis.
Negotiation context
- It's been on market 143 days — a 12% lower offer ($105k) is reasonable based on typical stale-listing flexibility.
- 7 sale attempts since 16y ago; this cycle's ask has dropped $11k (8%) from the opening price — seller is motivated, your offer sets the floor, not the list.
- Current owner paid $71k; list at $119k implies a 68% gain — meaningful room to come down on a strong offer.
Risks & watch-outs
- Watch-outs: HOA is 32% of rent.
- Climate carrying-cost: severe wind risk, 99% chance of damaging wind over 30y; extreme-heat days projected 7→26/yr by 2055 (HVAC capex compounding) — expect insurance premiums to compound above CPI over the hold.
Questions for the listing agent
- It's been on market 143 days. Have you received any prior offers? Is the seller open to a 12% concession, seller financing, or rate buy-down credit?
- Built in 1974 — when were the roof, HVAC, electrical panel, plumbing, and water heater last replaced?
- What does the HOA fee cover, when was the last increase, and are there any pending special assessments or reserve-fund shortfalls?
- Any open or pending special assessments — roof, HVAC, plumbing, elevator, façade? What's the per-unit balance and payoff schedule, and is the seller paying it off at close or rolling it to the buyer?
- Why hasn't it sold? Are there any deal-killer items the seller is aware of (foundation, flood, title, zoning, code violations)?
- Is there a deadline driving the sale (1031 exchange, divorce, estate, relocation)? That informs how much negotiation room exists.
- Schools are D-rated, which usually means shorter tenancies and higher turnover. Who's the typical renter profile here, and what's been the actual vacancy rate?
- What's the average days-on-market for RENTAL listings here right now (not sales)? A rising rental-DOM trend means longer vacancies and softer asking-rent achievability than the comps imply.
- What's the recent tenant-quality profile in this submarket — average credit score on applications, eviction rate, late-payment / NSF rate, and stable-employment percentage? A property-management company in the area should have these aggregated.
- How much new apartment / multifamily construction is in the pipeline within 1–3 miles? Heavy new supply (>2% of stock underway) typically softens rents 12–24 months out; light construction supports rent growth.
Investment metrics
- 1% rule
- 2.13% ✓
- Cap rate
- 9.02%
- Cash-on-cash
- 9.74%
- DSCR
- 1.43
- GRM
- 3.9
CMA / ARV
No comps found within radius.
Projected returns pro-forma
-3.0% appreciation · 2.17% rent growth · sell at horizon
- IRR
- -2.9%
- Equity multiple
- 0.89×
- Total profit
- $-3,561
- Equity at exit
- $17,743
- IRR
- 5.6%
- Equity multiple
- 1.39×
- Total profit
- $13,031
- Equity at exit
- $10,289
Cash invested: $33,320 (down + closing). Projections, not guarantees.
Landlord ↔ Tenant lean methodology
- Overall (STATE)
- 87 Strongly Landlord-Friendly
- State Florida
- 87 Strongly Landlord-Friendly · R+3
- County
- — inherits STATE
- City
- — inherits STATE
ZIP-level market 33441
- Rents YoY
- 2.2%
- Active inventory
- 297
- Price-to-rent
- 3.9×
Monthly cashflow live
- Estimated rent
- $2,536 high interval (Pro) →
- Mortgage (P&I)
- −$624
- Tax from tax record
- −$242 /mo · $2,909/yr
- Insurance
- −$50
- HOA
- −$817
- Vacancy / Maint / Mgmt
- −$533
- Net cashflow
- $270
Break-even live
UW: 25.0% down · 7.5% · 30yr · 1.5% tax · 5.0% vac · 8.0% maint · 8.0% mgmt
Financing live
Cash to close
- Down payment
- $29,750
- Closing costs
- $3,570
- Reserves months
- —
- Total cash needed
- —
Loan-product check · same deal, 3 products live
Conventional
25% down · 7.5% · 30yr
- Down + closing
- —
- Monthly P&I
- —
- Monthly cashflow
- —
- DSCR
- —
- Eligible?
- —
Personal DTI + credit; lowest rate.
DSCR
20% down · 8.5% · 30yr
- Down + closing
- —
- Monthly P&I
- —
- Monthly cashflow
- —
- DSCR
- —
- Eligible?
- —
No personal income docs; deal must DSCR.
Hard money
10% down · 12.0% · 12mo
- Down + closing
- —
- Monthly P&I
- —
- Monthly cashflow
- —
- DSCR
- —
- Eligible?
- —
Short-term bridge; refi at stabilization.
Rent comps 40 comps
| Address | Beds | Baths | Sqft | Rent | $/sqft | DOM | Units | Dist |
|---|---|---|---|---|---|---|---|---|
| 3123 SW Natura Ave Deerfield Beach, FL | 2.0 | 1.5 | 1238 | $2,200 | $1.78 | 24d | 1 | 0.10mi |
| 2528 SW Natura Blvd Deerfield Beach, FL | 2.0 | 2.0 | 1130 | $2,500 | $2.21 | 7d | 1 | 0.13mi |
| 2528 SW Natura Blvd Deerfield Beach, FL | 2.0 | 2.0 | 1130 | $2,500 | $2.21 | 22d | 1 | 0.13mi |
| 2613 SW Natura Ave Deerfield Beach, FL | 2.0 | 2.0 | 1216 | $3,000 | $2.47 | 10d | 1 | 0.18mi |
| 2004 SW Natura Blvd Unit D Deerfield Beach, FL | 2.0 | 2.0 | 900 | $2,500 | $2.78 | 2d | 1 | 0.21mi |
| 927 Siesta Key Blvd Deerfield Beach, FL | 1.0–2.0 | 1.0–2.0 | 975 | $2,200 | $2.26 | 3d | 25 | 0.25mi |
| 920 Rich Dr Deerfield Beach, FL | 1.0–2.0 | 1.0–2.0 | 1068 | $1,900 | $1.78 | 24d | 4 | 0.30mi |
| 660 Siesta Key Cir Deerfield Beach, FL | 2.0 | 2.0 | 1070 | $1,940 | $1.81 | 24d | 1 | 0.36mi |
| 67 SW 12th Ave Deerfield Beach, FL | 2.0 | 2.0 | 1242 | $3,089 | $2.49 | 16d | 1 | 0.44mi |
| 677 Trace Cir #101 Deerfield Beach, FL | 2.0 | 2.0 | 887 | $1,900 | $2.14 | 24d | 1 | 0.49mi |
| 588 Trace Cir #206 Deerfield Beach, FL | 2.0 | 2.0 | 1000 | $2,350 | $2.35 | 24d | 1 | 0.58mi |
| 588 Trace Cir Deerfield Beach, FL | 2.0 | 2.0 | 943 | $2,275 | $2.41 | 10d | 2 | 0.58mi |
| 349 NW 3rd St Deerfield Beach, FL | 3.0 | 1.0 | 1280 | $2,800 | $2.19 | 22d | 1 | 0.69mi |
| 349 NW 3rd St Deerfield Beach, FL | 3.0 | 1.0 | 1200 | $2,800 | $2.33 | 24d | 1 | 0.69mi |
| 521 SW 11th Dr Deerfield Beach, FL | 3.0 | 2.0 | 1298 | $2,950 | $2.27 | 22d | 1 | 0.76mi |
| 733 SE 1st Way #109 Deerfield Beach, FL | 2.0 | 2.0 | 1033 | $2,850 | $2.76 | 15d | 1 | 0.85mi |
| 733 SE 1st Way #109 Deerfield Beach, FL | 2.0 | 2.0 | 1033 | $2,800 | $2.71 | 5d | 1 | 0.85mi |
| 146 SE 5th Ct Deerfield Beach, FL | 3.0 | 2.5 | 1532 | $3,250 | $2.12 | 24d | 1 | 0.87mi |
| 737 SE 1st Way Deerfield Beach, FL | 1.0–2.0 | 1.5–2.0 | 885 | $2,100 | $2.37 | 7d | 2 | 0.87mi |
| 791 SE 1st Way #74 Deerfield Beach, FL | 2.0 | 2.5 | 1070 | $2,300 | $2.15 | 17d | 1 | 0.87mi |
| 737 SE 1st Way #302 Deerfield Beach, FL | 2.0 | 2.0 | 1070 | $2,100 | $1.96 | 24d | 1 | 0.88mi |
| 405 SW 13th Pl Deerfield Beach, FL | 3.0 | 1.5 | 892 | $2,095 | $2.35 | 24d | 1 | 0.88mi |
| 358 SE 1st Dr Unit 358 Deerfield Beach, FL | 3.0 | 2.5 | 1572 | $2,750 | $1.75 | 24d | 1 | 0.89mi |
| 358 SE 1st Way Deerfield Beach, FL | 3.0 | 2.5 | 1572 | $3,500 | $2.23 | 24d | 1 | 0.93mi |
| 358 SE 1st Way Deerfield Beach, FL | 3.0 | 2.5 | 1572 | $3,495 | $2.22 | 18d | 1 | 0.93mi |
| 401 SW 13th Pl Deerfield Beach, FL | 3.0 | 1.5 | 892 | $1,995 | $2.24 | 24d | 1 | 0.93mi |
| 401 SW 13th Pl Deerfield Beach, FL | 3.0 | 1.5 | 892 | $2,095 | $2.35 | 2d | 1 | 0.93mi |
| 170 SE 7th St #301 Deerfield Beach, FL | 2.0 | 2.0 | 1150 | $2,200 | $1.91 | 7d | 1 | 0.94mi |
| 110 SE 7th St Deerfield Beach, FL | 2.0 | 2.0 | 1200 | $1,950 | $1.62 | 24d | 1 | 0.94mi |
| 1335 S Dixie Hwy #404 Deerfield Beach, FL | 3.0 | 1.5 | 892 | $2,050 | $2.30 | 24d | 1 | 0.95mi |
| 831 SW 14th Ct Deerfield Beach, FL | 3.0 | 2.0 | 1056 | $2,850 | $2.70 | 24d | 1 | 0.96mi |
| 401 SE 3rd Ter Deerfield Beach, FL | 3.0 | 2.0 | 1208 | $5,000 | $4.14 | 10d | 1 | 1.02mi |
| 700 SE 2nd Ave #315 Deerfield Beach, FL | 2.0 | 2.0 | 920 | $2,000 | $2.17 | 20d | 1 | 1.03mi |
| 959 SE 2nd Ave #204 Deerfield Beach, FL | 2.0 | 2.0 | 1000 | $2,000 | $2.00 | 15d | 1 | 1.04mi |
| 770 SE 2nd Ave Deerfield Beach, FL | 1.0–2.0 | 1.5–2.0 | 855 | $2,350 | $2.75 | 7d | 3 | 1.06mi |
| 770 SE 2nd Ave Deerfield Beach, FL | 1.0–2.0 | 1.5–2.0 | 855 | $2,350 | $2.75 | 10d | 2 | 1.06mi |
| 770 SE 2nd Ave Deerfield Beach, FL | 1.0–2.0 | 1.5–2.0 | 855 | $2,350 | $2.75 | 4d | 3 | 1.06mi |
| 959 SE 2nd Ave Deerfield Beach, FL | 1.0–2.0 | 1.5–2.0 | 900 | $2,000 | $2.22 | 16d | 2 | 1.07mi |
| 1100 S Military Trl Deerfield Beach, FL | 2.0–3.0 | 1.0–2.0 | 1119 | $2,250 | $2.01 | 24d | 2 | 1.07mi |
| 1183 SE 1st Ter Deerfield Beach, FL | 3.0 | 2.0 | 1131 | $4,650 | $4.11 | 24d | 1 | 1.07mi |
HOA detail condo
- Monthly dues
- $817 · $9,804/yr
- Assessments
- None detected in remarks — confirm with the listing agent.
Listing history 31 events
-
2026-06-18days on market $119,000 Active 143 DOM
-
2026-06-17days on market $119,000 Active 142 DOM
-
2026-06-16days on market $119,000 Active 141 DOM
-
2026-06-15days on market $119,000 Active 140 DOM
-
2026-06-13days on market $119,000 Active 138 DOM
-
2026-06-09days on market $119,000 Active 134 DOM
-
2026-06-07days on market $119,000 Active 132 DOM
-
2026-06-04days on market $119,000 Active 129 DOM
-
2026-06-03days on market $119,000 Active 128 DOM
-
2026-06-02days on market $119,000 Active 127 DOM
-
2026-06-01days on market $119,000 Active 126 DOM
-
2026-05-31days on market $119,000 Active 125 DOM
-
2026-03-16price $119,000
-
2026-01-26$129,900 Active
-
2025-09-24historical
-
2025-04-04$165,000 Active
-
2025-03-25historical
-
2025-01-06status Active
-
2024-10-07status Active
-
2024-03-26$197,500 Active
-
2012-05-09soldstatus $71,000
-
2012-04-27soldstatus $71,000
-
2012-04-05historical
-
2011-07-11$74,900
-
2010-07-01soldstatus $82,900
-
2010-06-09soldstatus $82,900
-
2010-06-07historical
-
2010-03-23$88,900
-
2007-09-11soldstatus $110,000
-
2003-08-19soldstatus $58,500
-
1974-09-01soldstatus $20,000
ⓘ Source: listings_history table (triggers on properties + properties_extension) + one-shot
backfill from property_details.listing_events for pre-trigger history.
Tax reassessment forecast FL · Resets to sale price
- Current annual tax
- $2,909 · $242/mo
- Projected year-2 tax
- $2,909 · $242/mo
- Expected delta
- $0/yr ($0/mo · 0.0%)
ⓘ Screening estimate from a state-policy table — verify with the county assessor before closing.
Climate risk First Street
- Flood 1/10 Low FEMA zone X (shaded) · 0% chance over 30 yrs
- Wildfire 1/10 Low
- Heat 9/10 Extreme 7 d/yr ≥107°F today · 26 d/yr by 30 yrs out
- Wind 10/10 Extreme 99% chance of damaging wind over 30 yrs
- Air quality 2/10 Low 1 unhealthy d/yr today · 3 by 30 yrs out
Nearby sold comps map
Loading sold comps map…
Walkable amenities ~0.75 mi
Loading nearby amenities…
Taxation est. · year 1
- Rental income
- $30,433
- − Mortgage interest
- −$6,666
- − Property taxes
- −$2,909
- − Insurance
- −$595
- − Repairs & maintenance
- −$2,435
- − Management
- −$2,435
- − HOA
- −$9,804
- − Depreciation
- −$3,462
- Taxable income
- $2,128
- Est. tax owed @ 24.0%
- −$511
- After-tax cash flow
- $2,735/yr
For passive investors: Depreciation is non-cash, so a rental often shows a tax loss while cash-flowing — sheltering income. Rental losses are passive: they offset passive income freely, and up to $25,000/yr can offset ordinary (W-2) income if you actively participate and your MAGI is under $100k (phasing out to $0 by $150k); unused losses carry forward. On sale, claimed depreciation is recaptured at up to 25%, and gains may owe capital-gains tax (a 1031 exchange can defer both). Figures are a year-1 estimate at your 24.0% rate — not tax advice; consult a CPA.
Schools (NCES district)
- District
- Broward
- NCES district ID
- 1200180
- Math proficiency
- 42% ▼ -18.00%
- Reading proficiency
- 53% ▼ -5.00%
- Median HH income
- $52,139
- Composite
- 40.88/100
- National rank
- #3621
- State rank
- #46 of 73 in FL
Livability — Deerfield Beach
- Score
- 75/100
- State rank
- #250
- US rank
- #3970
Category grades
Schools grade is shown separately in the Schools card above.
Census & demographics
- Census place
- Deerfield Beach, FL
- County
- Broward County · 1,963,430 people
- City population
- 61,449
- Metro
- Miami-Fort Lauderdale-Pompano Beach, FL
- Population (ZIP)
- 30,153
- Household income
- $58,594
- Rent vs Own
- Severe rent burden
- 2148.0
Population outlook (Broward County) Hauer SSP2
- Today (2025)
- 2,207,033 people
- By 2030
- 2,360,704 · +7.0%
- By 2040
- 2,661,208 · +20.6%
- By 2050
- 2,946,698 · +33.5%
- By 2075
- 3,602,273 · +63.2%
- By 2100
- 3,970,984 · +79.9%
Race, ethnicity, and origin ACS 2023
- Neighborhood character
- Highly diverse neighborhood (Simpson 0.71)
- Race & ethnicity
- White 39% Black 33% Hispanic / Latino 17% Two or more races 15% Asian 2%
- Hispanic origin (detail)
- Mexican 2% Puerto Rican 1% Cuban 3% Dominican 1%
- Common ancestry
- Hispanic 11% Estonian 5% Romanian 3%
- Foreign-born
- 29% · Canada, Jamaica, Guatemala
- Languages at home
- 65% English-only · Spanish 13% French/Haitian/Cajun 11% Other Indo-European 9%
Political lean MEDSL · Broward
- 2024 margin
- D (+17.0) · D 58.0% · R 41.0%
- 2008→2024 swing
- -17.8pp toward R · 2008: 34.7pp · 2024: 17.0pp
- All cycles
- 2024: D+17.0 2020: D+29.8 2016: D+35.0 2012: D+34.9 2008: D+34.7
Not yet ingested
- Civics
- —
Market trends
- HPI YoY
- ▼ -353.25%
- Current HPI
- 404.3829
- Rent YoY
- ▲ 2.17%
- Metro
- Miami-Fort Lauderdale-Pompano Beach, FL
- State GDP YoY
- ▲ 3.28%
- F500 in state
- 36
Industry mix (Fortune 500 HQ in FL)
| Industry | F500 HQs | Revenue |
|---|---|---|
| Industrial Technology | 2 | $29B |
|
||
| Insurance | 2 | $17B |
|
||
| Retail | 1 | $60B |
|
||
| Technology Distribution | 1 | $58B |
|
||
| Homebuilding | 1 | $35B |
|
||
| Technology Manufacturing | 1 | $35B |
|
||
Price history
+495.0% since first listed19 events — show timeline
- 2026-03-16 Price Changed $119,000 Beaches MLS
- 2026-01-26 Listed $129,900 Beaches MLS
- 2025-09-24 Listing Removed — MARMLS
- 2025-04-04 Listed $165,000 MARMLS
- 2025-03-25 Listing Removed — MARMLS
- 2025-01-06 Relisted — MARMLS
- 2024-10-07 Relisted — MARMLS
- 2024-03-26 Listed $197,500 MARMLS
- 2012-05-09 Sold (Public Records) $71,000 Public Records
- 2012-04-27 Sold (MLS) $71,000 Beaches MLS
- 2012-04-05 Listing Removed — Beaches MLS
- 2011-07-11 Listed $74,900 Beaches MLS
- 2010-07-01 Sold (Public Records) $82,900 Public Records
- 2010-06-09 Sold (MLS) $82,900 Beaches MLS
- 2010-06-07 Listing Removed — Beaches MLS
- 2010-03-23 Listed $88,900 Beaches MLS
- 2007-09-11 Sold (Public Records) $110,000 Public Records
- 2003-08-19 Sold (Public Records) $58,500 Public Records
- 1974-09-01 Sold (Public Records) $20,000 Public Records
Property tax history
+9.4%/yrLatest (2025): $2,909 · +10.2% YoY. Source: county tax records.
Cash-flow waterfall
monthlySold comps — $/sqft
last 12 mo · ≤1 miLoading sold comps…