 🌊 Lakefront
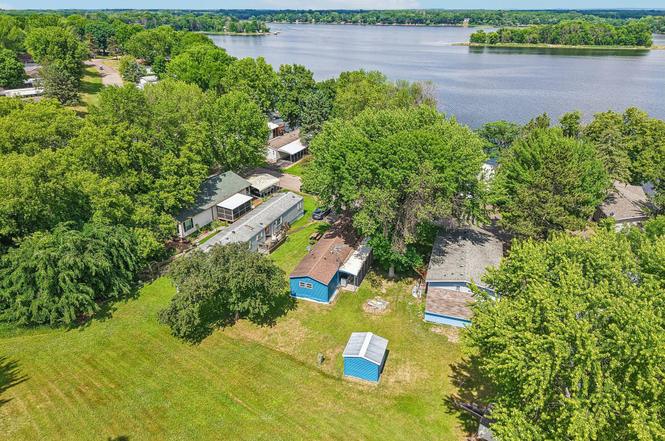
13100 318th St #131 · Chisago Lake, MN
Flood risk 1/10 · Minimal
- FEMA flood zone
- X (unshaded)
- Chance of flooding over 30 yrs
- 0.0%
- Est. flood insurance / yr
- $507 – $1,088
Fire risk 1/10 · Minimal
- Est. fire insurance / yr
- $888 – $1,650
Heat risk 2/10 · Minimal
- Hot days now (above 99°F)
- 7 days/yr
- Hot days in 30 yrs
- 14 days/yr
Wind risk 1/10 · Minimal
- Chance of severe wind over 30 yrs
- —
Air-quality risk 2/10 · Minimal
- Unhealthy air days now
- 1 days/yr
- Unhealthy air days in 30 yrs
- 3 days/yr
Risk factors via First Street. Map © Google.
Why this score? — see what drove the B- grade
The composite is a weighted blend of 9 inputs, each scored 0–100. Each bar is that input's sub-score; the figure is the points it added to the 100-point composite (weight × sub-score).
- Cash flow +30.0/30.0
- 1% rule +10.0/10.0
- DSCR +10.0/10.0
- ARV discount +7.5/15.0
- Schools +4.5/10.0
- Rent growth +2.5/5.0
- Livability +2.5/5.0
- Condition / age +2.5/5.0
- Appreciation +0.0/10.0
$80,000
🖨 Deal sheet 📄 Offer letter ✓ Due diligence
Listing remarks MLS
Very spacious 2BR 1BA with 2 off-street parking spots and large level lot with 10x10 storage shed in one of the areas desirable manufactured home parks; with lake access and adjacent to large regional lake park Allmansratt Park with walking trails and water access. Slips available for $500 a season. North Center connected to South Center Lake for up to 3000 acres of navigable lake under current water conditions.
Key facts
- 6,534 sq ft lot
- Built 1992
- Listed 4 days
Property features AI
Finance
- Other: Property has additional parcels
- Financial info: Land lease in place (land is leased) with monthly land lease payment
- HOA & community: Association: Blue Waters Leisure; Association amenities include beach and boat slip; Association fee covers parking, professional management, sewer and water
Exterior
- Parking: Concrete parking; Guest parking; Additional onsite parking available for a fee; Open parking (no garage or carport)
- Utilities: Water from shared system and private well; Shared, compliant septic system; Electric service with circuit breakers; Natural gas
- Home design: Manufactured home; Single-story; One-level entry; Residential property
- Construction: Asphalt roof (age over 8 years); Foundation: other (dimensions approximately 16 x 72); Built on a foundation area of about 1,120
- Exterior features: Vinyl exterior; Light tree coverage; Porch; Association access to waterfront (gravel and sand lake bottom); road between waterfront and home
Interior
- Kitchen: Eat-in kitchen; Range; Refrigerator; Dishwasher
- Bedrooms: Two bedrooms on the main level (12 x 10; 14 x 12)
- Bathrooms: One full bathroom on the main floor
- Heating & cooling: Forced air heating; Central air conditioning
- Interior features: All living facilities on one level; Ceiling fan(s); Kitchen window; Main floor primary bedroom; Porch
- Laundry & utility: Washer and dryer (laundry located in hall); Gas water heater
Neighborhood map
What this means for you Summary
Snapshot
- This is a 2-bed/1.0-bath other listed at $80k.
Deal economics
- At list price, monthly cash flow is $974 ($12k/yr) — positive.
- The deal already cash-flows at list — no discount required.
- Meets the 1% rule at list price ($2k rent vs $80k).
Location & tenants
- Location reads: area grade B — affects rentability + tenant quality, not the cash-flow math above.
- Chisago Lakes School District (town): math 45% / reading 56% proficiency, ranked #91 of 301 in MN (top 30%) — acceptable for families but not a draw, mixed tenant base, ~2y average lease; only 16% free/reduced lunch — higher-income household profile.
- Market conditions: 77 active listings in the ZIP; 362 units permitted in Chisago County in 2024 (121 in 5+ unit buildings).
Forward outlook
- Local home prices are declining (-3.0%/yr); year-one equity from $553 of loan paydown is wiped out by about $2k of value loss. Plan a longer hold.
- Chisago County population projected at -11% by 2050 — secular population decline; favor cash flow + early exit over multi-decade hold.
- At projected returns (-3.0% appreciation + 3.0% rent growth), your $22k cash investment doubles in ~3 years — after that, you're playing with house money.
Negotiation context
- Only 4 days on market — expect competitive offers; lowballing is unlikely to land.
- 2 sale attempts since 2y ago with the ask held roughly flat each time — persistent listings suggest the price (not the market) is what's stuck; bring a comps-based counter.
- Current owner paid $44k; list at $80k implies a 82% gain — meaningful room to come down on a strong offer.
Questions for the listing agent
- Is there a deadline driving the sale (1031 exchange, divorce, estate, relocation)? That informs how much negotiation room exists.
- This sits on a lake — are riparian / water-frontage rights deeded with the parcel? Any dock permits, shoreline easements, or HOA water-use restrictions?
- What's the documented flood / surge / shoreline-erosion history here (FEMA AND non-FEMA — e.g., storm surge, creek backup, septic-field saturation)?
- Any water-quality or seasonal algae-bloom issues that affect tenant satisfaction or short-term-rental demand?
- What's the average days-on-market for RENTAL listings here right now (not sales)? A rising rental-DOM trend means longer vacancies and softer asking-rent achievability than the comps imply.
- What's the recent tenant-quality profile in this submarket — average credit score on applications, eviction rate, late-payment / NSF rate, and stable-employment percentage? A property-management company in the area should have these aggregated.
- How much new for-sale + rental construction is in the pipeline within 1–3 miles? Heavy new supply typically softens prices + rents 12–24 months out; constrained supply supports both.
Investment metrics
- 1% rule
- 2.42% ✓
- Cap rate
- 20.90%
- Cash-on-cash
- 52.17%
- DSCR
- 3.32
- GRM
- 3.4
CMA / ARV
No comps found within radius.
Projected returns pro-forma
-3.0% appreciation · 3.0% rent growth · sell at horizon
- IRR
- 50.1%
- Equity multiple
- 3.19×
- Total profit
- $49,088
- Equity at exit
- $11,928
- IRR
- 55.6%
- Equity multiple
- 6.48×
- Total profit
- $122,727
- Equity at exit
- $6,917
Cash invested: $22,400 (down + closing). Projections, not guarantees.
Landlord ↔ Tenant lean methodology
- Overall (STATE)
- 46 Balanced
- State Minnesota
- 46 Balanced · D+2
- County
- — inherits STATE
- City
- — inherits STATE
ZIP-level market 55045
- Home prices YoY
- -20.4%
- Active inventory
- 77
- Price-to-rent
- 3.4×
Monthly cashflow live
- Estimated rent
- $1,932 medium interval (Pro) →
- Mortgage (P&I)
- −$420
- Tax est. 1.5%
- −$100 /mo · $1,200/yr
- Insurance
- −$33
- HOA
- −$0
- Vacancy / Maint / Mgmt
- −$406
- Net cashflow
- $974
Break-even live
UW: 25.0% down · 7.5% · 30yr · 1.5% tax · 5.0% vac · 8.0% maint · 8.0% mgmt
Financing live
Cash to close
- Down payment
- $20,000
- Closing costs
- $2,400
- Reserves months
- —
- Total cash needed
- —
Loan-product check · same deal, 3 products live
Conventional
25% down · 7.5% · 30yr
- Down + closing
- —
- Monthly P&I
- —
- Monthly cashflow
- —
- DSCR
- —
- Eligible?
- —
Personal DTI + credit; lowest rate.
DSCR
20% down · 8.5% · 30yr
- Down + closing
- —
- Monthly P&I
- —
- Monthly cashflow
- —
- DSCR
- —
- Eligible?
- —
No personal income docs; deal must DSCR.
Hard money
10% down · 12.0% · 12mo
- Down + closing
- —
- Monthly P&I
- —
- Monthly cashflow
- —
- DSCR
- —
- Eligible?
- —
Short-term bridge; refi at stabilization.
Listing history 5 events
-
2026-06-18days on market $80,000 Active 4 DOM
-
2026-06-17days on market $80,000 Active 3 DOM
-
2026-06-16days on market $80,000 Active 2 DOM
-
2026-06-15remarks 699-char remark
-
2026-06-15$80,000 Active 1 DOM
ⓘ Source: listings_history table (triggers on properties + properties_extension) + one-shot
backfill from property_details.listing_events for pre-trigger history.
Climate risk First Street
- Flood 1/10 Low FEMA zone X (unshaded) · 0% chance over 30 yrs
- Wildfire 1/10 Low
- Heat 2/10 Low 7 d/yr ≥99°F today · 14 d/yr by 30 yrs out
- Wind 1/10 Low
- Air quality 2/10 Low 1 unhealthy d/yr today · 3 by 30 yrs out
Nearby sold comps map
Loading sold comps map…
Walkable amenities ~0.75 mi
Loading nearby amenities…
Taxation est. · year 1
- Rental income
- $23,190
- − Mortgage interest
- −$4,481
- − Property taxes
- −$1,200
- − Insurance
- −$400
- − Repairs & maintenance
- −$1,855
- − Management
- −$1,855
- − Depreciation
- −$2,327
- Taxable income
- $11,071
- Est. tax owed @ 24.0%
- −$2,657
- After-tax cash flow
- $9,029/yr
For passive investors: Depreciation is non-cash, so a rental often shows a tax loss while cash-flowing — sheltering income. Rental losses are passive: they offset passive income freely, and up to $25,000/yr can offset ordinary (W-2) income if you actively participate and your MAGI is under $100k (phasing out to $0 by $150k); unused losses carry forward. On sale, claimed depreciation is recaptured at up to 25%, and gains may owe capital-gains tax (a 1031 exchange can defer both). Figures are a year-1 estimate at your 24.0% rate — not tax advice; consult a CPA.
Schools (NCES district)
- District
- Chisago Lakes School District
- NCES district ID
- 2700017
- Math proficiency
- 45% ▼ -18.00%
- Reading proficiency
- 56% ▼ -10.00%
- Median HH income
- $71,167
- Composite
- 45.18/100
- National rank
- #2674
- State rank
- #91 of 301 in MN
Livability — Chisago Lake
No livability data for this city. (Only ~50 U.S. cities are tracked.)
Census & demographics
- Population (ZIP)
- 7,854
Population outlook (Chisago County) Hauer SSP2
- Today (2025)
- 55,187 people
- By 2030
- 55,036 · -0.3%
- By 2040
- 53,293 · -3.4%
- By 2050
- 49,157 · -10.9%
- By 2075
- 38,399 · -30.4%
- By 2100
- 24,646 · -55.3%
Race, ethnicity, and origin ACS 2023
- Neighborhood character
- Predominantly White (94%)
- Race & ethnicity
- White 94% Two or more races 3% Hispanic / Latino 3%
- Common ancestry
- Portuguese 18% Romanian 6% Lithuanian 4%
- Foreign-born
- 2% · Canada
- Languages at home
- 97% English-only · Spanish 2%
Political lean MEDSL · Chisago
- 2024 margin
- Solid R (+31.4) · D 33.5% · R 64.9% · Other 1.6%
- 2008→2024 swing
- -21.2pp toward R · 2008: -10.3pp · 2024: -31.4pp
- All cycles
- 2024: R+31.4 2020: R+29.2 2016: R+30.5 2012: R+12.6 2008: R+10.3
Not yet ingested
- Civics
- —
Market trends
- HPI YoY
- ▼ -79.38%
- Current HPI
- 308.8275
- Rent YoY
- —
- Metro
- —
- State GDP YoY
- ▲ 2.41%
- F500 in state
- 34
Industry mix (Fortune 500 HQ in MN)
| Industry | F500 HQs | Revenue |
|---|---|---|
| Healthcare | 2 | $407B |
|
||
| Retail | 2 | $150B |
|
||
| Consumer Goods | 2 | $32B |
|
||
| Industrial Machinery | 2 | $6B |
|
||
| Agriculture | 1 | $40B |
|
||
| Healthcare / Medical Devices | 1 | $32B |
|
||
Price history
+35.6% since first listed5 events — show timeline
- 2026-06-14 Listed $80,000 NORTHSTARMLS as Distributed by MLS Grid
- 2025-02-24 Sold (MLS) $44,000 NORTHSTARMLS as Distributed by MLS Grid
- 2025-01-29 Pending — NORTHSTARMLS as Distributed by MLS Grid
- 2025-01-13 Price Changed $55,000 NORTHSTARMLS as Distributed by MLS Grid
- 2024-12-13 Listed $59,000 NORTHSTARMLS as Distributed by MLS Grid
Cash-flow waterfall
monthlySold comps — $/sqft
last 12 mo · ≤1 miLoading sold comps…