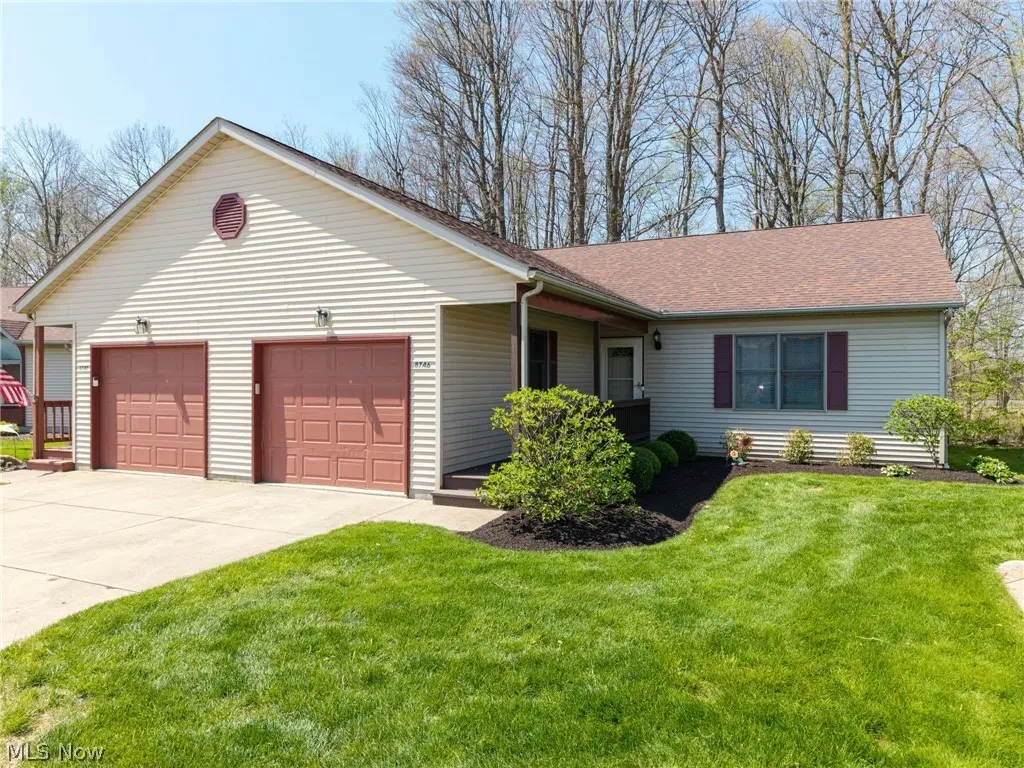
8746 Northstar Cir · Seville, OH
Flood risk No data
- FEMA flood zone
- —
- Chance of flooding over 30 yrs
- —
- Est. flood insurance / yr
- —
Fire risk No data
- Est. fire insurance / yr
- —
Heat risk No data
- Hot days now (above threshold)
- —
- Hot days in 30 yrs
- —
Wind risk No data
- Chance of severe wind over 30 yrs
- —
Air-quality risk No data
- Unhealthy air days now
- —
- Unhealthy air days in 30 yrs
- —
Risk factors via First Street. Map © Google.
Why this score? — see what drove the D grade
The composite is a weighted blend of 9 inputs, each scored 0–100. Each bar is that input's sub-score; the figure is the points it added to the 100-point composite (weight × sub-score).
- Cash flow +12.2/30.0
- ARV discount +7.5/15.0
- Schools +5.6/10.0
- 1% rule +4.5/10.0
- Livability +3.8/5.0
- DSCR +3.6/10.0
- Rent growth +2.5/5.0
- Condition / age +2.5/5.0
- Appreciation +0.0/10.0
$199,900
🖨 Deal sheet (PDF) 📄 Offer letter ✓ Due diligence
Listing remarks MLS
Neat cute condo living. Lots of room. Full basement. Ready to move in. Nice back deck very private.
Key facts
- Granite countertops
- Updated tile work
- Tile backsplash
Tags
Property features AI
Finance
- HOA & community: Homeowners association managed by Associated Property Management; Monthly association fee of $245 covering association management, insurance, grounds maintenance, structure maintenance, and snow removal
Exterior
- Parking: Attached garage with 1 garage space; Additional parking with direct access
- Utilities: Public water; Public sewer
- Home design: Single-story home; Entry level: ground floor; Attached property; Public records list 1,120 above-grade finished area
- Construction: Vinyl siding; Asphalt/fiberglass roof; Block foundation; Built according to public records
- Exterior features: Deck; Wooded lot
Interior
- Kitchen: Eat-in kitchen; Dishwasher; Disposal; Microwave; Range; Refrigerator
- Bedrooms: Two main-level bedrooms (one approx. 14 x 12)
- Bathrooms: One full bathroom on the main level
- Interior features: Ceiling fans; Eat-in kitchen; Natural woodwork; Unfinished basement with sump pump; Has view
- Laundry & utility: Washer and dryer; Main-level laundry
Neighborhood map
What this means for you Summary
Snapshot
- This is a 2-bed/1.0-bath condo listed at $200k.
Deal economics
- At list price, monthly cash flow is $-40 ($-476/yr) — negative.
- To cash-flow at today's rent, offer at most $193k (3.5% below list).
- To meet the 1% rule (rent ≥ 1% of price), the offer needs to be $190k (5.0% below list).
- Recommended offer: $190k (5.0% below list) — sets the bar for 1% rule.
Location & tenants
- Location reads 76/100 on livability (#225 in OH, #3,532 nationally) — a middle-class / working-renter tenant base. Strengths: crime A+, cost of living A+, housing A+; Watch: amenities F, commute F.
- Cloverleaf Local (rural): math 61% / reading 68% proficiency, ranked #205 of 656 in OH (top 31%) — acceptable for families but not a draw, mixed tenant base, ~2y average lease.
- Zoned schools: Cloverleaf Elementary School (math 64% / reading 70%, grade B+, #456 of 1,584 statewide, top 31%, 1,075 students, 32% FRL); Cloverleaf Middle School (math 64% / reading 63%, grade B+, #228 of 654 statewide, top 35%, 540 students, 33% FRL); Cloverleaf High School (math 47% / reading 72%, grade C+, #243 of 781 statewide, top 33%, 591 students, 32% FRL) — zoned schools at 33% FRL track the district average.
- Market conditions: 39 active listings in the ZIP; 1 comparable units currently listed for rent nearby; solid renter incomes; 471 units permitted in Medina County in 2024 (0 in 5+ unit buildings).
Forward outlook
- Local home prices are declining (-3.0%/yr); year-one equity from $1k of loan paydown is wiped out by about $6k of value loss. Plan a longer hold.
Negotiation context
- Only 6 days on market — expect competitive offers; lowballing is unlikely to land.
- 5 sale attempts since 32y ago with the ask held roughly flat each time — persistent listings suggest the price (not the market) is what's stuck; bring a comps-based counter.
- Current owner paid $86k; list at $200k implies a 132% gain — meaningful room to come down on a strong offer.
Questions for the listing agent
- What do current leases actually rent for vs. the listed asking? Can we see a recent rent roll and the last 12 months of T-12 income?
- What does the HOA fee cover, when was the last increase, and are there any pending special assessments or reserve-fund shortfalls?
- Any open or pending special assessments — roof, HVAC, plumbing, elevator, façade? What's the per-unit balance and payoff schedule, and is the seller paying it off at close or rolling it to the buyer?
- Is there a deadline driving the sale (1031 exchange, divorce, estate, relocation)? That informs how much negotiation room exists.
- Schools are A-rated — typically a magnet for longer-tenancy family renters. What's the average tenant stay here, and is there a school-zone premium baked into asking?
- The area grade is low — what's the realistic commute time and amenity access for the typical tenant pool here? Any planned neighborhood developments (good or bad) we should know about?
- What's the average days-on-market for RENTAL listings here right now (not sales)? A rising rental-DOM trend means longer vacancies and softer asking-rent achievability than the comps imply.
- What's the recent tenant-quality profile in this submarket — average credit score on applications, eviction rate, late-payment / NSF rate, and stable-employment percentage? A property-management company in the area should have these aggregated.
- How much new apartment / multifamily construction is in the pipeline within 1–3 miles? Heavy new supply (>2% of stock underway) typically softens rents 12–24 months out; light construction supports rent growth.
Investment metrics
- 1% rule
- 0.95% ✗
- Cap rate
- 6.05%
- Cash-on-cash
- -0.85%
- DSCR
- 0.96
- GRM
- 8.8
CMA / ARV
No comps found within radius.
Projected returns pro-forma
-3.0% appreciation · 3.0% rent growth · sell at horizon
- IRR
- -17.6%
- Equity multiple
- 0.38×
- Total profit
- $-34,792
- Equity at exit
- $29,806
- IRR
- -9.6%
- Equity multiple
- 0.41×
- Total profit
- $-33,036
- Equity at exit
- $17,284
Cash invested: $55,972 (down + closing). Projections, not guarantees.
Landlord ↔ Tenant lean methodology
- Overall (STATE)
- 73 Landlord-Friendly
- State Ohio
- 73 Landlord-Friendly · R+6
- County
- — inherits STATE
- City
- — inherits STATE
ZIP-level market 44273
- Home prices YoY
- -24.9%
- Active inventory
- 39
- Price-to-rent
- 8.8×
Monthly cashflow live
- Estimated rent
- $1,900 medium interval (Pro) →
- Mortgage (P&I)
- −$1,048
- Tax from tax record
- −$164 /mo · $1,969/yr
- Insurance
- −$83
- HOA
- −$245
- Vacancy / Maint / Mgmt
- −$399
- Net cashflow
- $-40
Break-even live
Sensitivity live
| Price | -10% $73 | -5% $17 | +0% $-40 | +5% $-96 | +10% $-153 |
|---|---|---|---|---|---|
| Rent | -10% $-190 | -5% $-115 | +0% $-40 | +5% $35 | +10% $110 |
| Rate | -1.0pp $61 | -0.5pp $11 | base $-40 | +0.5pp $-91 | +1.0pp $-144 |
UW: 25.0% down · 7.5% · 30yr · 1.5% tax · 5.0% vac · 8.0% maint · 8.0% mgmt
Financing live
Cash to close
- Down payment
- $49,975
- Closing costs
- $5,997
- Reserves months
- —
- Total cash needed
- —
Loan-product check · same deal, 3 products live
Conventional
25% down · 7.5% · 30yr
- Down + closing
- —
- Monthly P&I
- —
- Monthly cashflow
- —
- DSCR
- —
- Eligible?
- —
Personal DTI + credit; lowest rate.
DSCR
20% down · 8.5% · 30yr
- Down + closing
- —
- Monthly P&I
- —
- Monthly cashflow
- —
- DSCR
- —
- Eligible?
- —
No personal income docs; deal must DSCR.
Hard money
10% down · 12.0% · 12mo
- Down + closing
- —
- Monthly P&I
- —
- Monthly cashflow
- —
- DSCR
- —
- Eligible?
- —
Short-term bridge; refi at stabilization.
Rent comps 1 comps
| Address | Beds | Baths | Sqft | Rent | $/sqft | DOM | Units | Dist |
|---|---|---|---|---|---|---|---|---|
| 9470 Arrowhead Ridge Ln Seville, OH | 2.0 | 2.0 | 1400 | $1,900 | $1.36 | 45d | 1 | 1.36mi |
HOA detail condo
- Monthly dues
- $245 · $2,940/yr
- Assessments
- None detected in remarks — confirm with the listing agent.
Listing history 10 events
-
2026-04-30status Pending
-
2026-04-24$199,900 Active
-
2015-02-06soldstatus $86,000
-
2011-11-16soldstatus $82,500 99-char remark
Show marketing remark (99 chars)
Neat cute condo living. Lots of room. Full basement. Ready to move in. Nice back deck very private.
-
2011-06-27$99,900 99-char remark
Show marketing remark (99 chars)
Neat cute condo living. Lots of room. Full basement. Ready to move in. Nice back deck very private.
-
1994-11-22soldstatus $83,275
-
1994-11-22soldstatus $83,275
-
1994-08-29$81,900
-
1994-08-04$81,900
-
1994-08-04$81,900
ⓘ Source: listings_history table (triggers on properties + properties_extension) + one-shot
backfill from property_details.listing_events for pre-trigger history.
Tax reassessment forecast OH · Partial reset (capped growth)
- Current annual tax
- $1,969 · $164/mo
- Projected year-2 tax
- $2,544 · $212/mo
- Expected delta
- +$575/yr (+$48/mo · 29.2%)
ⓘ Screening estimate from a state-policy table — verify with the county assessor before closing.
Nearby sold comps map
Loading sold comps map…
Walkable amenities ~0.75 mi
Loading nearby amenities…
Taxation est. · year 1
- Rental income
- $22,800
- − Mortgage interest
- −$11,198
- − Property taxes
- −$1,969
- − Insurance
- −$1,000
- − Repairs & maintenance
- −$1,824
- − Management
- −$1,824
- − HOA
- −$2,940
- − Depreciation
- −$5,815
- Taxable loss
- −$3,769
- Est. tax savings @ 24.0%
- +$905
- After-tax cash flow
- $429/yr
For passive investors: Depreciation is non-cash, so a rental often shows a tax loss while cash-flowing — sheltering income. Rental losses are passive: they offset passive income freely, and up to $25,000/yr can offset ordinary (W-2) income if you actively participate and your MAGI is under $100k (phasing out to $0 by $150k); unused losses carry forward. On sale, claimed depreciation is recaptured at up to 25%, and gains may owe capital-gains tax (a 1031 exchange can defer both). Figures are a year-1 estimate at your 24.0% rate — not tax advice; consult a CPA.
Schools (NCES district)
- District
- Cloverleaf Local
- NCES district ID
- 3904848
- Math proficiency
- 61% ▼ -16.00%
- Reading proficiency
- 68% ▼ -6.00%
- Median HH income
- $58,407
- Composite
- 55.59/100
- National rank
- #1235
- State rank
- #205 of 656 in OH
Livability — Seville
- Score
- 76/100
- State rank
- #225
- US rank
- #3532
Category grades
Schools grade is shown separately in the Schools card above.
Census & demographics
- Census place
- Seville, OH
- County
- Medina · 181,928 people
- City population
- 7,124
- Metro
- Cleveland, OH
- Population (ZIP)
- 7,124
- Household income
- $93,328
- Rent vs Own
- Severe rent burden
- 0.9
Population outlook (Medina County) Hauer SSP2
- Today (2025)
- 185,249 people
- By 2030
- 188,174 · +1.6%
- By 2040
- 190,350 · +2.8%
- By 2050
- 187,283 · +1.1%
- By 2075
- 177,108 · -4.4%
- By 2100
- 151,304 · -18.3%
Race, ethnicity, and origin ACS 2023
- Neighborhood character
- Predominantly White (97%)
- Race & ethnicity
- White 97%
- Common ancestry
- Romanian 7% Iranian 2% Lithuanian 2%
- Foreign-born
- 1%
- Languages at home
- 99% English-only · German/W. Germanic 1%
Political lean MEDSL · Medina
- 2024 margin
- Strong R (+24.8) · D 37.2% · R 62.0%
- 2008→2024 swing
- -16.8pp toward R · 2008: -8.0pp · 2024: -24.8pp
- All cycles
- 2024: R+24.8 2020: R+23.4 2016: R+24.9 2012: R+13.1 2008: R+8.0
Not yet ingested
- Civics
- —
Market trends
- HPI YoY
- ▼ -88.75%
- Current HPI
- 267.9357
- Rent YoY
- —
- Metro
- —
- State GDP YoY
- ▲ 1.98%
- F500 in state
- 48
Industry mix (Fortune 500 HQ in OH)
| Industry | F500 HQs | Revenue |
|---|---|---|
| Insurance | 3 | $145B |
|
||
| Industrial Machinery | 3 | $49B |
|
||
| Financial Services | 3 | $24B |
|
||
| Consumer Goods | 2 | $93B |
|
||
| Aerospace / Defense | 2 | $47B |
|
||
| Utilities | 2 | $33B |
|
||
Price history
+144.1% since first listed10 events — show timeline
- 2026-04-30 Pending — MLSNOW
- 2026-04-24 Listed $199,900 MLSNOW
- 2015-02-06 Sold (Public Records) $86,000 Public Records
- 2011-11-16 Sold (MLS) $82,500 MLSNOW
- 2011-06-27 Listed $99,900 MLSNOW
- 1994-11-22 Sold (MLS) $83,275 MLSNOW
- 1994-11-22 Sold (MLS) $83,275 MLSNOW
- 1994-08-29 Listed $81,900 MLSNOW
- 1994-08-04 Listed $81,900 MLSNOW
- 1994-08-04 Listed $81,900 MLSNOW
Property tax history
+2.8%/yrLatest (2025): $1,969 · +21.4% YoY. Source: county tax records.
Cash-flow waterfall
monthlySold comps — $/sqft
last 12 mo · ≤1 miLoading sold comps…