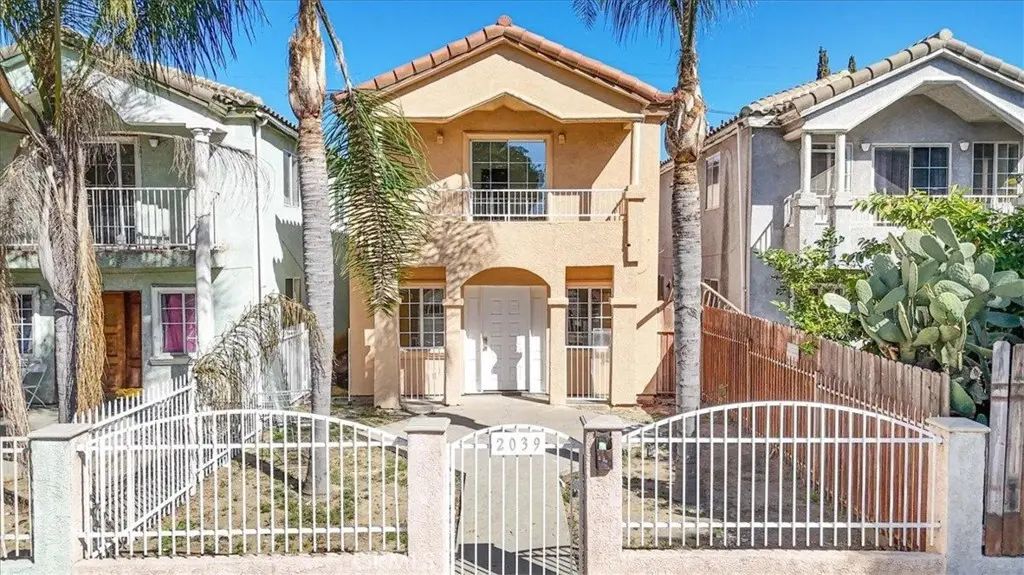
2039 W Florence · Los Angeles, CA
Flood risk 1/10 · Minimal
- FEMA flood zone
- X (unshaded)
- Chance of flooding over 30 yrs
- 0.0%
- Est. flood insurance / yr
- $507 – $1,088
Fire risk 1/10 · Minimal
- Est. fire insurance / yr
- $659 – $1,223
Heat risk 5/10 · Moderate
- Hot days now (above 86°F)
- 6 days/yr
- Hot days in 30 yrs
- 18 days/yr
Wind risk 1/10 · Minimal
- Chance of severe wind over 30 yrs
- —
Air-quality risk 5/10 · Moderate
- Unhealthy air days now
- 7 days/yr
- Unhealthy air days in 30 yrs
- 7 days/yr
Risk factors via First Street. Map © Google.
Why this score? — see what drove the D grade
The composite is a weighted blend of 9 inputs, each scored 0–100. Each bar is that input's sub-score; the figure is the points it added to the 100-point composite (weight × sub-score).
- ARV discount +15.0/15.0
- Cash flow +9.0/30.0
- Rent growth +3.9/5.0
- Schools +3.6/10.0
- Livability +3.4/5.0
- DSCR +2.5/10.0
- Condition / age +2.5/5.0
- 1% rule +2.1/10.0
- Appreciation +0.0/10.0
$675,000
🖨 Deal sheet (PDF) 📄 Offer letter ✓ Due diligence
Listing remarks MLS
Spacious 2,090 sq ft single-family two-story home, offering on the first floor; living room, half restroom (with space to make it a full bathroom), kitchen, huge dining room and garage for two cars, upstairs are the four bedrooms, two full bathrooms and master bedroom with balcony and walking closet. Centrally located to everything in LA, Sofi stadium is three miles away, USC is less than five miles away, perfect home for a family or Investors looking for opportunities to convert it into three units, plans are approved by the city and ready to issue permits. Don't let this potential opportunity go, call for more information or schedule an appointment.
Key facts
- Centrally located
- Walking closet
- Huge dining room
Tags
Neighborhood map
What this means for you Summary
Snapshot
- This is a 4-bed/3.0-bath single-family listed at $675k.
Deal economics
- At list price, monthly cash flow is $-528 ($-6k/yr) — negative.
- To cash-flow at today's rent, offer at most $582k (13.8% below list).
- To meet the 1% rule (rent ≥ 1% of price), the offer needs to be $479k (29.1% below list).
- Recommended offer: $479k (29.1% below list) — sets the bar for 1% rule.
- Cap rate 5.4% vs local median 2.1% in Los Angeles — top-decile yield for the area; either an underpriced asset or a hidden risk that comps aren't pricing in. Stress-test before assuming the spread holds.
Location & tenants
- Location reads 68/100 on livability (#273 in CA) — a middle-class / working-renter tenant base. Strengths: amenities A+, commute A+, employment B; Watch: health & safety C-, crime F, cost of living F.
- Los Angeles Unified (urban): math 29% / reading 54% proficiency, ranked #223 of 517 in CA (top 43%) — families likely to look elsewhere, expect single-tenant / working-renter base with shorter leases; 67% free/reduced lunch — lower-income household profile, screen leases tightly.
- Zoned schools: Seventy-Fourth Street Elementary (362 students, 91% FRL); Valley Academy of Arts And Sciences (math 22% / reading 52%, grade F, #578 of 1,170 statewide, top 51%, 868 students, 64% FRL).
- Market conditions: Rents rising fast (+5.5%/yr); 138 active listings in the ZIP; 13 comparable units currently listed for rent nearby; rentals at typical pace (median 27d on market — plan ~3-4 weeks tenant-placement turnaround); 46% of comp listings sitting > 30 days — soft ceiling on asking rent; 19,697 units permitted in Los Angeles County in 2024 (9,426 in 5+ unit buildings).
- At $4,787/mo this rent would consume 80% of the median local household income ($72k/yr) (locally 3323% of renters already pay >50% of income on rent) — very limited rent-growth headroom before tenants either downsize or default.
Forward outlook
- Local home prices are declining (-3.0%/yr); year-one equity from $5k of loan paydown is wiped out by about $20k of value loss. Plan a longer hold.
- Los Angeles County population projected at +9% by 2050 — modest demand growth; plan on rents tracking national, not racing it.
Negotiation context
- It's been on market 96 days — a 9% lower offer ($614k) is reasonable based on typical stale-listing flexibility.
- 3 sale attempts since 20y ago; this cycle's ask has dropped $84k (11%) from the opening price — seller is motivated, your offer sets the floor, not the list.
- Current owner paid $555k; 22% above their basis — modest negotiation headroom, anchor on the comps not their cost.
Risks & watch-outs
- Climate carrying-cost: extreme-heat days projected 6→18/yr by 2055 (HVAC capex compounding) — expect insurance premiums to compound above CPI over the hold.
Questions for the listing agent
- What do current leases actually rent for vs. the listed asking? Can we see a recent rent roll and the last 12 months of T-12 income?
- It's been on market 96 days. Have you received any prior offers? Is the seller open to a 29% concession, seller financing, or rate buy-down credit?
- Why hasn't it sold? Are there any deal-killer items the seller is aware of (foundation, flood, title, zoning, code violations)?
- Is there a deadline driving the sale (1031 exchange, divorce, estate, relocation)? That informs how much negotiation room exists.
- Schools are D-rated, which usually means shorter tenancies and higher turnover. Who's the typical renter profile here, and what's been the actual vacancy rate?
- Crime grade is F in this area — have there been break-ins, vandalism, or insurance claims at this property in the last 3 years? What carrier currently insures it and at what premium?
- The area grade is low — what's the realistic commute time and amenity access for the typical tenant pool here? Any planned neighborhood developments (good or bad) we should know about?
- What's the average days-on-market for RENTAL listings here right now (not sales)? A rising rental-DOM trend means longer vacancies and softer asking-rent achievability than the comps imply.
- What's the recent tenant-quality profile in this submarket — average credit score on applications, eviction rate, late-payment / NSF rate, and stable-employment percentage? A property-management company in the area should have these aggregated.
- How much new for-sale + rental construction is in the pipeline within 1–3 miles? Heavy new supply typically softens prices + rents 12–24 months out; constrained supply supports both.
Investment metrics
- 1% rule
- 0.71% ✗
- Cap rate
- 5.35%
- Cash-on-cash
- -3.35%
- DSCR
- 0.85
- GRM
- 11.8
CMA / ARV
- ARV (median comp)
- $860,123
- List price
- $675,000
- Delta
- -21.52%
- Verdict
- UNDERPRICED
- Comps
- 20 within 1.0 mi
Show comp detail 12 sales within ~0.75 mi
| Address | Dist | Beds/Ba | Sqft | Sold | Price | $/sf | Match |
|---|---|---|---|---|---|---|---|
| 2033 W 76th | 0.25mi | 4/2.0 | 2,145 (+3%) | 1mo | $660,000 | $308 | 79 |
| 7014 Haas Ave | 0.13mi | 5/3.0 (+1) | 2,249 (+8%) | 9mo | $965,000 | $429 | 69 |
| 2035 W 71st | 0.05mi | 3/2.0 (-1) | 1,790 (-14%) | 5mo | $766,000 | $428 | 61 |
| 2401 W 78th St | 0.49mi | 4/3.0 | 2,315 (+11%) | 2mo | $680,000 | $294 | 57 |
| 7040 Arlington | 0.22mi | 3/2.0 (-1) | 1,785 (-15%) | 1mo | $717,000 | $402 | 56 |
| 7400 S Hobart | 0.44mi | 5/2.0 (+1) | 1,948 (-7%) | 5mo | $913,000 | $469 | 55 |
| 2422 W 77th St | 0.50mi | 3/2.0 (-1) | 1,866 (-11%) | 5mo | $1,125,000 | $603 | 46 |
| 7530 S Hobart Blvd | 0.49mi | 3/2.0 (-1) | 1,827 (-13%) | 3mo | $820,000 | $449 | 45 |
| 2228 W 78th St | 0.48mi | 3/2.0 (-1) | 1,793 (-14%) | 3mo | $950,000 | $530 | 43 |
| 7803 S Harvard Blvd | 0.60mi | 3/2.0 (-1) | 1,884 (-10%) | 5mo | $899,900 | $478 | 42 |
| 1908 W 79th St | 0.57mi | 4/2.0 | 1,834 (-12%) | 8mo | $770,000 | $420 | 42 |
| 1850 W 80th St | 0.64mi | 3/2.0 (-1) | 1,885 (-10%) | 7mo | $975,000 | $517 | 39 |
Match score weights: distance 35% · size 25% · config 20% · recency 20%. Top-matched comps best support the ARV.
Projected returns pro-forma
-3.0% appreciation · 5.51% rent growth · sell at horizon
- IRR
- -19.4%
- Equity multiple
- 0.31×
- Total profit
- $-130,776
- Equity at exit
- $100,645
- IRR
- -8.0%
- Equity multiple
- 0.45×
- Total profit
- $-104,255
- Equity at exit
- $58,362
Cash invested: $189,000 (down + closing). Projections, not guarantees.
Landlord ↔ Tenant lean methodology
- Overall (CITY)
- 0 Strongly Tenant-Friendly
- State California
- 18 Strongly Tenant-Friendly · D+13
- County
- — inherits STATE
- City Los Angeles
- 0 Strongly Tenant-Friendly · D+22
ZIP-level market 90047
- Rents YoY
- 5.5%
- Active inventory
- 138
- Price-to-rent
- 11.8×
Monthly cashflow live
- Estimated rent
- $4,787 high interval (Pro) →
- Mortgage (P&I)
- −$3,540
- Tax from tax record
- −$489 /mo · $5,867/yr
- Insurance
- −$281
- HOA
- −$0
- Vacancy / Maint / Mgmt
- −$1,005
- Net cashflow
- $-528
Break-even live
Sensitivity live
| Price | -10% $-146 | -5% $-337 | +0% $-528 | +5% $-719 | +10% $-910 |
|---|---|---|---|---|---|
| Rent | -10% $-906 | -5% $-717 | +0% $-528 | +5% $-339 | +10% $-150 |
| Rate | -1.0pp $-188 | -0.5pp $-357 | base $-528 | +0.5pp $-703 | +1.0pp $-881 |
UW: 25.0% down · 7.5% · 30yr · 1.5% tax · 5.0% vac · 8.0% maint · 8.0% mgmt
Financing live
Cash to close
- Down payment
- $168,750
- Closing costs
- $20,250
- Reserves months
- —
- Total cash needed
- —
Loan-product check · same deal, 3 products live
Conventional
25% down · 7.5% · 30yr
- Down + closing
- —
- Monthly P&I
- —
- Monthly cashflow
- —
- DSCR
- —
- Eligible?
- —
Personal DTI + credit; lowest rate.
DSCR
20% down · 8.5% · 30yr
- Down + closing
- —
- Monthly P&I
- —
- Monthly cashflow
- —
- DSCR
- —
- Eligible?
- —
No personal income docs; deal must DSCR.
Hard money
10% down · 12.0% · 12mo
- Down + closing
- —
- Monthly P&I
- —
- Monthly cashflow
- —
- DSCR
- —
- Eligible?
- —
Short-term bridge; refi at stabilization.
Rent comps 13 comps
| Address | Beds | Baths | Sqft | Rent | $/sqft | DOM | Units | Dist |
|---|---|---|---|---|---|---|---|---|
| 7007 Arlington Ave Los Angeles, CA | 3.0 | 2.0 | 1597 | $5,195 | $3.25 | 45d | 1 | 0.24mi |
| 7007 Arlington Ave Los Angeles, CA | 3.0 | 2.0 | 1597 | $4,995 | $3.13 | 24d | 1 | 0.24mi |
| 2211 W 78th Pl Inglewood, CA | 3.0 | 2.0 | 1749 | $4,500 | $2.57 | 17d | 1 | 0.49mi |
| 7530 S Hobart Blvd Los Angeles, CA | 4.0 | 3.0 | 2400 | $5,750 | $2.40 | 21d | 1 | 0.50mi |
| 6415 Madden Ave Los Angeles, CA | 3.0 | 3.0 | 1500 | $4,499 | $3.00 | 21d | 1 | 0.76mi |
| 2916 W 79th St Inglewood, CA | 3.0 | 1.5 | 1538 | $4,050 | $2.63 | 0d | 1 | 0.80mi |
| 3017 W 84th St Inglewood, CA | 3.0 | 2.0 | 1422 | $3,595 | $2.53 | 21d | 1 | 1.07mi |
| 8724 Ruthelen St Los Angeles, CA | 4.0 | 3.0 | 1793 | $4,300 | $2.40 | 26d | 1 | 1.16mi |
| 6015 Brynhurst Ave Los Angeles, CA | 4.0 | 2.0 | 1902 | $5,400 | $2.84 | 45d | 1 | 1.29mi |
| 5465 9th Ave Los Angeles, CA | 4.0 | 2.0 | 1824 | $9,500 | $5.21 | 45d | 1 | 1.32mi |
| 1400 57th St Los Angeles, CA | 5.0 | 5.0 | 1800 | $4,200 | $2.33 | 45d | 1 | 1.37mi |
| 8906 S Harvard Blvd Los Angeles, CA | 3.0 | 2.0 | 1500 | $4,000 | $2.67 | 45d | 1 | 1.39mi |
| 1312 W Manchester Ave Los Angeles, CA | 4.0 | 3.0 | 2475 | $4,000 | $1.62 | 45d | 1 | 1.40mi |
Listing history 23 events
-
2026-06-21days on market $675,000 Active 96 DOM
-
2026-06-18days on market $675,000 Active 93 DOM
-
2026-06-17days on market $675,000 Active 92 DOM
-
2026-06-16days on market $675,000 Active 91 DOM
-
2026-06-15days on market $675,000 Active 90 DOM
-
2026-06-13days on market $675,000 Active 88 DOM
-
2026-06-09days on market $675,000 Active 84 DOM
-
2026-06-08days on market $675,000 Active 83 DOM
-
2026-06-07days on market $675,000 Active 82 DOM
-
2026-06-04days on market $675,000 Active 79 DOM
-
2026-06-03days on market $675,000 Active 78 DOM
-
2026-06-02days on market $675,000 Active 77 DOM
-
2026-06-01days on market $675,000 Active 76 DOM
-
2026-05-31days on market $675,000 Active 75 DOM
-
2026-05-08price $675,000 659-char remark
Show marketing remark (659 chars)
Spacious 2,090 sq ft single-family two-story home, offering on the first floor; living room, half restroom (with space to make it a full bathroom), kitchen, huge dining room and garage for two cars, upstairs are the four bedrooms, two full bathrooms and master bedroom with balcony and walking closet. Centrally located to everything in LA, Sofi stadium is three miles away, USC is less than five miles away, perfect home for a family or Investors looking for opportunities to convert it into three units, plans are approved by the city and ready to issue permits. Don't let this potential opportunity go, call for more information or schedule an appointment.
-
2026-04-12price $719,000 659-char remark
Show marketing remark (659 chars)
Spacious 2,090 sq ft single-family two-story home, offering on the first floor; living room, half restroom (with space to make it a full bathroom), kitchen, huge dining room and garage for two cars, upstairs are the four bedrooms, two full bathrooms and master bedroom with balcony and walking closet. Centrally located to everything in LA, Sofi stadium is three miles away, USC is less than five miles away, perfect home for a family or Investors looking for opportunities to convert it into three units, plans are approved by the city and ready to issue permits. Don't let this potential opportunity go, call for more information or schedule an appointment.
-
2026-03-17$759,000 Active 659-char remark
Show marketing remark (659 chars)
Spacious 2,090 sq ft single-family two-story home, offering on the first floor; living room, half restroom (with space to make it a full bathroom), kitchen, huge dining room and garage for two cars, upstairs are the four bedrooms, two full bathrooms and master bedroom with balcony and walking closet. Centrally located to everything in LA, Sofi stadium is three miles away, USC is less than five miles away, perfect home for a family or Investors looking for opportunities to convert it into three units, plans are approved by the city and ready to issue permits. Don't let this potential opportunity go, call for more information or schedule an appointment.
-
2010-09-06historical
-
2010-03-04$375,000 Active
-
2006-10-08historical
-
2006-02-06$499,000
-
2004-08-04soldstatus $555,000
-
2000-10-17soldstatus $100,000
ⓘ Source: listings_history table (triggers on properties + properties_extension) + one-shot
backfill from property_details.listing_events for pre-trigger history.
Tax reassessment forecast CA · Resets to sale price
- Current annual tax
- $5,867 · $489/mo
- Projected year-2 tax
- $5,867 · $489/mo
- Expected delta
- $0/yr ($0/mo · 0.0%)
ⓘ Screening estimate from a state-policy table — verify with the county assessor before closing.
Climate risk First Street
- Flood 1/10 Low FEMA zone X (unshaded) · 0% chance over 30 yrs
- Wildfire 1/10 Low
- Heat 5/10 Major 6 d/yr ≥86°F today · 18 d/yr by 30 yrs out
- Wind 1/10 Low
- Air quality 5/10 Major 7 unhealthy d/yr today · 7 by 30 yrs out
Nearby sold comps map
Loading sold comps map…
Walkable amenities ~0.75 mi
Loading nearby amenities…
Taxation est. · year 1
- Rental income
- $57,443
- − Mortgage interest
- −$37,810
- − Property taxes
- −$5,867
- − Insurance
- −$3,375
- − Repairs & maintenance
- −$4,595
- − Management
- −$4,595
- − Depreciation
- −$19,636
- Taxable loss
- −$18,436
- Est. tax savings @ 24.0%
- +$4,425
- After-tax cash flow
- $-1,914/yr
For passive investors: Depreciation is non-cash, so a rental often shows a tax loss while cash-flowing — sheltering income. Rental losses are passive: they offset passive income freely, and up to $25,000/yr can offset ordinary (W-2) income if you actively participate and your MAGI is under $100k (phasing out to $0 by $150k); unused losses carry forward. On sale, claimed depreciation is recaptured at up to 25%, and gains may owe capital-gains tax (a 1031 exchange can defer both). Figures are a year-1 estimate at your 24.0% rate — not tax advice; consult a CPA.
Schools (NCES district)
- District
- Los Angeles Unified
- NCES district ID
- 0622710
- Math proficiency
- 29% ▼ -4.00%
- Reading proficiency
- 54% ▲ 10.00%
- Median HH income
- $50,403
- Composite
- 35.67/100
- National rank
- #4875
- State rank
- #223 of 517 in CA
Livability — Los Angeles
- Score
- 68/100
- State rank
- #273
- US rank
- #9237
Category grades
Schools grade is shown separately in the Schools card above.
Census & demographics
- Census place
- Los Angeles, CA
- County
- Los Angeles County · 9,444,647 people
- City population
- 3,838,149
- Metro
- Los Angeles-Long Beach-Anaheim, CA
- Population (ZIP)
- 50,974
- Household income
- $71,664
- Rent vs Own
- Severe rent burden
- 3323.0
Population outlook (Los Angeles County) Hauer SSP2
- Today (2025)
- 10,940,515 people
- By 2030
- 11,256,481 · +2.9%
- By 2040
- 11,729,929 · +7.2%
- By 2050
- 11,948,407 · +9.2%
- By 2075
- 11,818,114 · +8.0%
- By 2100
- 10,842,928 · -0.9%
Race, ethnicity, and origin ACS 2023
- Neighborhood character
- Diverse neighborhood (Simpson 0.58)
- Race & ethnicity
- Black 52% Hispanic / Latino 39% Two or more races 13% White 3% Native American 1%
- Hispanic origin (detail)
- Mexican 21%
- Common ancestry
- British 2%
- Foreign-born
- 18% · Canada
- Languages at home
- 63% English-only · Spanish 35% German/W. Germanic 1%
Political lean MEDSL · Los Angeles
- 2024 margin
- Solid D (+32.9) · D 64.8% · R 31.9% · Other 3.3%
- 2008→2024 swing
- -7.4pp toward R · 2008: 40.4pp · 2024: 32.9pp
- All cycles
- 2024: D+32.9 2020: D+44.2 2016: D+48.0 2012: D+40.0 2008: D+40.4
Not yet ingested
- Civics
- —
Market trends
- HPI YoY
- ▼ -625.31%
- Current HPI
- 480.8774
- Rent YoY
- ▲ 5.51%
- Metro
- Los Angeles-Long Beach-Anaheim, CA
- State GDP YoY
- ▲ 3.21%
- F500 in state
- 116
Industry mix (Fortune 500 HQ in CA)
| Industry | F500 HQs | Revenue |
|---|---|---|
| Technology | 27 | $1,492B |
|
||
| Financial Services | 3 | $174B |
|
||
| Retail | 3 | $44B |
|
||
| Insurance | 3 | $26B |
|
||
| Media / Entertainment | 2 | $115B |
|
||
| Pharmaceuticals / Biotech | 2 | $62B |
|
||
Price history
+575.0% since first listed9 events — show timeline
- 2026-05-08 Price Changed $675,000 CRMLS
- 2026-04-12 Price Changed $719,000 CRMLS
- 2026-03-17 Listed $759,000 CRMLS
- 2010-09-06 Listing Removed — CRMLS
- 2010-03-04 Listed $375,000 CRMLS
- 2006-10-08 Listing Removed — CRMLS
- 2006-02-06 Listed $499,000 CRMLS
- 2004-08-04 Sold (Public Records) $555,000 Public Records
- 2000-10-17 Sold (Public Records) $100,000 Public Records
Property tax history
-0.3%/yrLatest (2025): $5,867 · +1.6% YoY. Source: county tax records.
Cash-flow waterfall
monthlySold comps — $/sqft
last 12 mo · ≤1 miLoading sold comps…