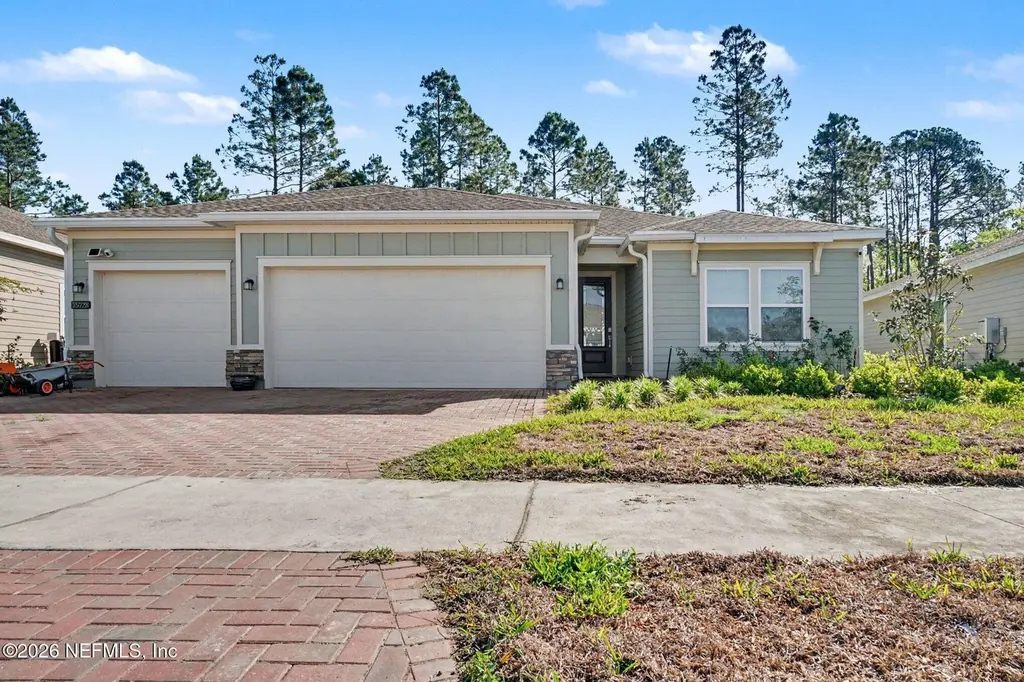
75728 Estuary Way · Jacksonville, FL
Flood risk No data
- FEMA flood zone
- —
- Chance of flooding over 30 yrs
- —
- Est. flood insurance / yr
- —
Fire risk No data
- Est. fire insurance / yr
- —
Heat risk No data
- Hot days now (above threshold)
- —
- Hot days in 30 yrs
- —
Wind risk No data
- Chance of severe wind over 30 yrs
- —
Air-quality risk No data
- Unhealthy air days now
- —
- Unhealthy air days in 30 yrs
- —
Risk factors via First Street. Map © Google.
Why this score? — see what drove the D grade
The composite is a weighted blend of 9 inputs, each scored 0–100. Each bar is that input's sub-score; the figure is the points it added to the 100-point composite (weight × sub-score).
- Appreciation +10.0/10.0
- ARV discount +9.6/15.0
- Schools +6.0/10.0
- Cash flow +5.0/30.0
- Livability +4.2/5.0
- Rent growth +3.2/5.0
- Condition / age +2.5/5.0
- 1% rule +1.5/10.0
- DSCR +0.0/10.0
$430,000
🖨 Deal sheet (PDF) 📄 Offer letter ✓ Due diligence
Listing remarks
Welcome to this stunning 4-bedroom, 3-bath home with 2,237 sq ft in the highly sought-after Tributary community! Situated on a large lot backing up to a peaceful preserve, this home offers privacy and beautiful natural views. The gourmet kitchen features upgraded appliances and is perfect for entertaining. Enjoy relaxing evenings on the spacious screened lanai overlooking the backyard. This well-maintained home also includes a home warranty for added peace of mind. Don't miss your opportunity to own in one of the area's most desirable neighborhoods!
Key facts
- 8,276 sq ft lot
- 3 garage spots
- Built 2024
Property features AI
Finance
- HOA & community: HOA (Tributary) with $150 annual fee; CDD fee applicable (listed)
Exterior
- Parking: Attached garage; 3-car garage
- Utilities: Public sewer; Cable available and connected; Water available; Sewer connected
- Home design: Single-family residence; Entry level: 1
- Exterior features: No private pool; Lot approximately 0.19 acres
Interior
- Kitchen: Dishwasher; Double oven; Gas cooktop; Microwave; Refrigerator
- Bedrooms: 4 bedrooms
- Bathrooms: 3 full bathrooms
- Heating & cooling: Central heating; Central air
- Interior features: Tankless water heater
- Laundry & utility: Unfurnished (no included furniture indicated)
Neighborhood map
What this means for you Summary
Snapshot
- This is a 4-bed/3.0-bath single-family listed at $430k.
Deal economics
- At list price, monthly cash flow is $-1k ($-12k/yr) — negative.
- To cash-flow at today's rent, offer at most $250k (41.8% below list).
- To meet the 1% rule (rent ≥ 1% of price), the offer needs to be $278k (35.3% below list).
- Recommended offer: $250k (41.8% below list) — sets the bar for cash-flow.
Location & tenants
- Location reads 83/100 on livability (#50 in FL, #911 nationally) — a professional / high-income tenant draw. Strengths: amenities A+, commute A+, housing A+.
- Nassau (town): math 74% / reading 65% proficiency, ranked #4 of 73 in FL (top 6%) — acceptable for families but not a draw, mixed tenant base, ~2y average lease.
- Zoned schools: Wildlight Elementary (math 90% / reading 80%, grade A+, #35 of 2,144 statewide, top 2%, 1,025 students, 34% FRL); Yulee Middle School (math 73% / reading 61%, grade A-, #80 of 571 statewide, top 14%, 1,202 students, 41% FRL); Yulee High School (math 52% / reading 54%, grade C-, #148 of 667 statewide, top 23%, 1,407 students, 35% FRL) — zoned schools at 37% FRL track the district average.
- Market conditions: Rents rising (+2.9%/yr); 601 active listings in the ZIP; 14 comparable units currently listed for rent nearby; rentals at typical pace (median 26d on market — plan ~3-4 weeks tenant-placement turnaround); solid renter incomes; 953 units permitted in Nassau County in 2024 (24 in 5+ unit buildings).
- This rent runs 36% of the median local income ($93k/yr) — at the standard rent-burdened threshold; future hikes will face affordability resistance.
Forward outlook
- In year one you build about $46k of equity ($3k loan paydown + $43k appreciation (10.0% local appreciation)).
- Nassau County population projected at +17% by 2050 — long-run rental-demand tailwind backs the buy-and-hold thesis.
- By year 2, paydown + projected appreciation supports a ~$74k cash-out refi (75% LTV) — recoverable capital for the next deal without selling this one.
Negotiation context
- It's been on market 22 days — a 2% lower offer ($424k) is reasonable based on typical stale-listing flexibility.
Questions for the listing agent
- What do current leases actually rent for vs. the listed asking? Can we see a recent rent roll and the last 12 months of T-12 income?
- What does the HOA fee cover, when was the last increase, and are there any pending special assessments or reserve-fund shortfalls?
- Is there a deadline driving the sale (1031 exchange, divorce, estate, relocation)? That informs how much negotiation room exists.
- Schools are B-rated — typically a magnet for longer-tenancy family renters. What's the average tenant stay here, and is there a school-zone premium baked into asking?
- The area grade is low — what's the realistic commute time and amenity access for the typical tenant pool here? Any planned neighborhood developments (good or bad) we should know about?
- What's the average days-on-market for RENTAL listings here right now (not sales)? A rising rental-DOM trend means longer vacancies and softer asking-rent achievability than the comps imply.
- What's the recent tenant-quality profile in this submarket — average credit score on applications, eviction rate, late-payment / NSF rate, and stable-employment percentage? A property-management company in the area should have these aggregated.
- How much new for-sale + rental construction is in the pipeline within 1–3 miles? Heavy new supply typically softens prices + rents 12–24 months out; constrained supply supports both.
Investment metrics
- 1% rule
- 0.65% ✗
- Cap rate
- 3.45%
- Cash-on-cash
- -10.14%
- DSCR
- 0.55
- GRM
- 12.9
CMA / ARV
- ARV (on-the-fly)
- $451,041
- Comps found
- 12
Show comp detail 12 sales within ~0.75 mi
| Address | Dist | Beds/Ba | Sqft | Sold | Price | $/sf | Match |
|---|---|---|---|---|---|---|---|
| 75598 Banyan Way | 0.14mi | 4/3.0 | 2,390 (+2%) | 2mo | $469,290 | $196 | 88 |
| 75791 Bayley Pl | 0.28mi | 4/3.0 | 2,390 (+2%) | 2mo | $461,780 | $193 | 82 |
| 75705 Walking Path Ln | 0.47mi | 4/3.0 | 2,226 (-5%) | 1mo | $459,980 | $207 | 69 |
| 75556 Canterwood Dr | 0.19mi | 5/3.0 (+1) | 2,640 (+13%) | 1mo | $465,000 | $176 | 64 |
| 75844 Walking Path Ln | 0.33mi | 4/3.0 | 2,656 (+14%) | 2mo | $459,000 | $173 | 60 |
| 75767 Spoonbill Ln | 0.31mi | 4/3.0 | 2,006 (-14%) | 2mo | $412,500 | $206 | 60 |
| 75721 Walking Path Ln | 0.46mi | 4/3.0 | 2,571 (+10%) | 3mo | $484,980 | $189 | 60 |
| 76037 Estuary Way | 0.36mi | 4/3.5 | 2,609 (+12%) | 2mo | $435,606 | $167 | 60 |
| 75735 Bayley Pl | 0.33mi | 3/2.0 (-1) | 2,116 (-10%) | 2mo | $422,400 | $200 | 58 |
| 75631 Bayley Pl | 0.43mi | 3/2.0 (-1) | 2,116 (-10%) | 2mo | $409,350 | $193 | 54 |
| 75276 Pondside Ln | 0.58mi | 3/2.0 (-1) | 2,126 (-9%) | 2mo | $390,000 | $183 | 47 |
| 75197 Pondside Ln | 0.70mi | 4/3.0 | 2,660 (+14%) | 0mo | $485,000 | $182 | 44 |
Match score weights: distance 35% · size 25% · config 20% · recency 20%. Top-matched comps best support the ARV.
Projected returns pro-forma
10.0% appreciation · 2.88% rent growth · sell at horizon
- IRR
- 17.2%
- Equity multiple
- 2.41×
- Total profit
- $169,231
- Equity at exit
- $387,378
- IRR
- 16.2%
- Equity multiple
- 5.56×
- Total profit
- $549,030
- Equity at exit
- $835,395
Cash invested: $120,400 (down + closing). Projections, not guarantees.
Landlord ↔ Tenant lean methodology
- Overall (STATE)
- 87 Strongly Landlord-Friendly
- State Florida
- 87 Strongly Landlord-Friendly · R+3
- County
- — inherits STATE
- City
- — inherits STATE
ZIP-level market 32097
- Home prices YoY
- 19.5%
- Rents YoY
- 2.9%
- Active inventory
- 601
- Price-to-rent
- 12.9×
Monthly cashflow live
- Estimated rent
- $2,782 high interval (Pro) →
- Mortgage (P&I)
- −$2,255
- Tax from tax record
- −$768 /mo · $9,217/yr
- Insurance
- −$179
- HOA
- −$13
- Vacancy / Maint / Mgmt
- −$584
- Net cashflow
- $-1,018
Break-even live
Sensitivity live
| Price | -10% $-774 | -5% $-896 | +0% $-1,018 | +5% $-1,139 | +10% $-1,261 |
|---|---|---|---|---|---|
| Rent | -10% $-1,237 | -5% $-1,128 | +0% $-1,018 | +5% $-908 | +10% $-798 |
| Rate | -1.0pp $-801 | -0.5pp $-908 | base $-1,018 | +0.5pp $-1,129 | +1.0pp $-1,242 |
UW: 25.0% down · 7.5% · 30yr · 1.5% tax · 5.0% vac · 8.0% maint · 8.0% mgmt
Financing live
Cash to close
- Down payment
- $107,500
- Closing costs
- $12,900
- Reserves months
- —
- Total cash needed
- —
Loan-product check · same deal, 3 products live
Conventional
25% down · 7.5% · 30yr
- Down + closing
- —
- Monthly P&I
- —
- Monthly cashflow
- —
- DSCR
- —
- Eligible?
- —
Personal DTI + credit; lowest rate.
DSCR
20% down · 8.5% · 30yr
- Down + closing
- —
- Monthly P&I
- —
- Monthly cashflow
- —
- DSCR
- —
- Eligible?
- —
No personal income docs; deal must DSCR.
Hard money
10% down · 12.0% · 12mo
- Down + closing
- —
- Monthly P&I
- —
- Monthly cashflow
- —
- DSCR
- —
- Eligible?
- —
Short-term bridge; refi at stabilization.
Rent comps 14 comps
| Address | Beds | Baths | Sqft | Rent | $/sqft | DOM | Units | Dist |
|---|---|---|---|---|---|---|---|---|
| 75470 Sunberry Dr Yulee, FL | 5.0 | 4.0 | 2903 | $3,150 | $1.09 | 21d | 1 | 0.34mi |
| 75094 Fern Creek Dr Yulee, FL | 4.0 | 2.0 | 2193 | $2,495 | $1.14 | 4d | 1 | 0.73mi |
| 65013 Lagoon Forest Dr Yulee, FL | 4.0 | 2.5 | 2245 | $2,800 | $1.25 | 12d | 1 | 0.81mi |
| 75094 Glenspring Way Yulee, FL | 3.0 | 2.0 | 2055 | $2,500 | $1.22 | 25d | 1 | 0.84mi |
| 75215 Fern Creek Dr Yulee, FL | 4.0 | 2.5 | 2898 | $2,900 | $1.00 | 16d | 1 | 0.96mi |
| 75047 Brookwood Dr Yulee, FL | 5.0 | 3.0 | 3300 | $3,405 | $1.03 | 6d | 1 | 0.97mi |
| 75008 Morning Glen Ct Yulee, FL | 4.0 | 2.0 | 1856 | $2,300 | $1.24 | 25d | 1 | 0.98mi |
| 75045 Morning Glen Ct Yulee, FL | 3.0 | 2.0 | 1685 | $2,310 | $1.37 | 22d | 1 | 1.02mi |
| 76195 Deerwood Dr Yulee, FL | 4.0 | 2.5 | 2757 | $2,475 | $0.90 | 25d | 1 | 1.07mi |
| 75075 Morning Glen Ct Yulee, FL | 4.0 | 2.0 | 1856 | $2,399 | $1.29 | 6d | 1 | 1.09mi |
| 75346 Bridgewater Dr Yulee, FL | 3.0 | 2.0 | 1711 | $2,300 | $1.34 | 25d | 1 | 1.14mi |
| 70305 Winding River Dr Yulee, FL | 4.0 | 3.0 | 2042 | $2,500 | $1.22 | 25d | 1 | 1.26mi |
| 65303 River Glen Pkwy Yulee, FL | 4.0 | 2.0 | 2160 | $2,400 | $1.11 | 25d | 1 | 1.34mi |
| 65343 River Glen Pkwy Yulee, FL | 3.0 | 2.0 | 1714 | $2,195 | $1.28 | 25d | 1 | 1.39mi |
HOA detail
- Monthly dues
- $13 · $156/yr
Listing history 2 events
-
2026-05-22status Pending
-
2026-04-30$430,000 Active
ⓘ Source: listings_history table (triggers on properties + properties_extension) + one-shot
backfill from property_details.listing_events for pre-trigger history.
Tax reassessment forecast FL · Resets to sale price
- Current annual tax
- $9,217 · $768/mo
- Projected year-2 tax
- $9,217 · $768/mo
- Expected delta
- $0/yr ($0/mo · 0.0%)
ⓘ Screening estimate from a state-policy table — verify with the county assessor before closing.
Nearby sold comps map
Loading sold comps map…
Walkable amenities ~0.75 mi
Loading nearby amenities…
Taxation est. · year 1
- Rental income
- $33,380
- − Mortgage interest
- −$24,087
- − Property taxes
- −$9,217
- − Insurance
- −$2,150
- − Repairs & maintenance
- −$2,670
- − Management
- −$2,670
- − HOA
- −$156
- − Depreciation
- −$12,509
- Taxable loss
- −$20,079
- Est. tax savings @ 24.0%
- +$4,819
- After-tax cash flow
- $-7,393/yr
For passive investors: Depreciation is non-cash, so a rental often shows a tax loss while cash-flowing — sheltering income. Rental losses are passive: they offset passive income freely, and up to $25,000/yr can offset ordinary (W-2) income if you actively participate and your MAGI is under $100k (phasing out to $0 by $150k); unused losses carry forward. On sale, claimed depreciation is recaptured at up to 25%, and gains may owe capital-gains tax (a 1031 exchange can defer both). Figures are a year-1 estimate at your 24.0% rate — not tax advice; consult a CPA.
Schools (NCES district)
- District
- Nassau
- NCES district ID
- 1201350
- Math proficiency
- 74% ▼ -2.00%
- Reading proficiency
- 65% ▼ -2.00%
- Median HH income
- $58,267
- Composite
- 59.79/100
- National rank
- #899
- State rank
- #4 of 73 in FL
Livability — Jacksonville
- Score
- 83/100
- State rank
- #50
- US rank
- #911
Category grades
Schools grade is shown separately in the Schools card above.
Census & demographics
- County
- Nassau County · 67,729 people
- City population
- 26,700
- Metro
- Jacksonville, FL
- Population (ZIP)
- 26,700
- Household income
- $93,161
- Rent vs Own
- Severe rent burden
- 404.0
Population outlook (Nassau County) Hauer SSP2
- Today (2025)
- 88,419 people
- By 2030
- 92,679 · +4.8%
- By 2040
- 99,257 · +12.3%
- By 2050
- 103,378 · +16.9%
- By 2075
- 109,726 · +24.1%
- By 2100
- 107,006 · +21.0%
Race, ethnicity, and origin ACS 2023
- Neighborhood character
- Predominantly White (75%)
- Race & ethnicity
- White 75% Two or more races 9% Black 9% Hispanic / Latino 8% Asian 1% Native American 1%
- Hispanic origin (detail)
- Mexican 2% Puerto Rican 2%
- Common ancestry
- Lithuanian 4% Italian 3% Romanian 2%
- Foreign-born
- 4% · Canada, Vietnam
- Languages at home
- 93% English-only · Spanish 5% Vietnamese 1%
Political lean MEDSL · Nassau
- 2024 margin
- Solid R (+46.9) · D 26.1% · R 73.1%
- 2008→2024 swing
- -3.1pp toward R · 2008: -43.8pp · 2024: -46.9pp
- All cycles
- 2024: R+46.9 2020: R+45.9 2016: R+50.2 2012: R+48.6 2008: R+43.8
Not yet ingested
- Civics
- —
Market trends
- HPI YoY
- ▲ 49.35%
- Current HPI
- 301.9299
- Rent YoY
- ▲ 2.88%
- Metro
- Jacksonville, FL
- State GDP YoY
- ▲ 3.28%
- F500 in state
- 36
Industry mix (Fortune 500 HQ in FL)
| Industry | F500 HQs | Revenue |
|---|---|---|
| Industrial Technology | 2 | $29B |
|
||
| Insurance | 2 | $17B |
|
||
| Retail | 1 | $60B |
|
||
| Technology Distribution | 1 | $58B |
|
||
| Homebuilding | 1 | $35B |
|
||
| Technology Manufacturing | 1 | $35B |
|
||
Price history
2 events — show timeline
- 2026-05-22 Pending — realMLS
- 2026-04-30 Listed $430,000 realMLS
Property tax history
+103.1%/yrLatest (2025): $9,217 · +103.1% YoY. Source: county tax records.
Cash-flow waterfall
monthlySold comps — $/sqft
last 12 mo · ≤1 miLoading sold comps…