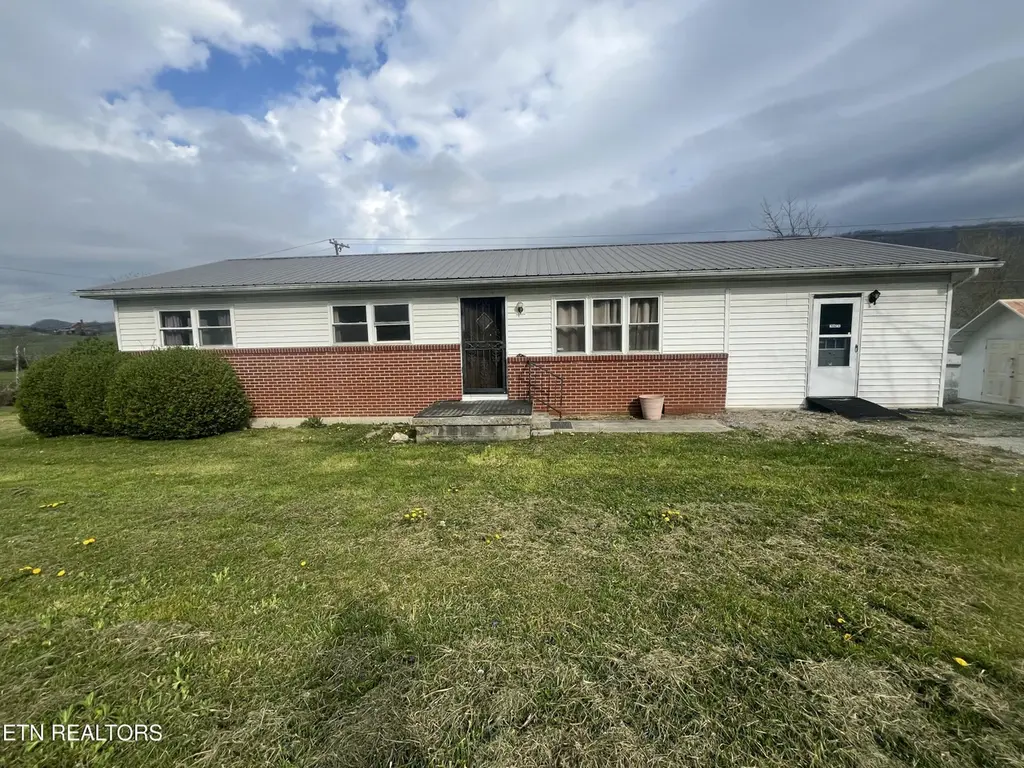
3981 Doctor Thomas Walker Rd · Rose Hill, VA
Flood risk No data
- FEMA flood zone
- —
- Chance of flooding over 30 yrs
- —
- Est. flood insurance / yr
- —
Fire risk No data
- Est. fire insurance / yr
- —
Heat risk No data
- Hot days now (above threshold)
- —
- Hot days in 30 yrs
- —
Wind risk No data
- Chance of severe wind over 30 yrs
- —
Air-quality risk No data
- Unhealthy air days now
- —
- Unhealthy air days in 30 yrs
- —
Risk factors via First Street. Map © Google.
Why this score? — see what drove the B grade
The composite is a weighted blend of 9 inputs, each scored 0–100. Each bar is that input's sub-score; the figure is the points it added to the 100-point composite (weight × sub-score).
- Cash flow +23.1/30.0
- ARV discount +15.0/15.0
- Appreciation +8.0/10.0
- DSCR +7.4/10.0
- 1% rule +5.0/10.0
- Schools +5.0/10.0
- Livability +4.1/5.0
- Rent growth +2.5/5.0
- Condition / age +2.5/5.0
$115,000
🖨 Deal sheet 📄 Offer letter ✓ Due diligence
Listing remarks MLS
Don't miss out on this charming home! perfect for any family looking in the Rose Hill area with it being located to nearby schools including LMU! this property would also make a great rental for local students! There is tons of potential for this property with the 2 acres, 2 storage sheds, and barn that goes with it!
Key facts
- Barn
- 2 storage sheds
- 2 acres
Tags
Neighborhood map
What this means for you Summary
Snapshot
- This is a 2-bed/1.0-bath single-family listed at $115k.
Deal economics
- At list price, monthly cash flow is $206 ($2k/yr) — positive.
- The deal already cash-flows at list — no discount required.
- Meets the 1% rule at list price ($1k rent vs $115k).
- Recommended offer: $108k (6.0% below list) — sets the bar for market timing.
- Cap rate 8.4% vs local median 2.9% in Rose Hill — top-decile yield for the area; either an underpriced asset or a hidden risk that comps aren't pricing in. Stress-test before assuming the spread holds.
Location & tenants
- Location reads 82/100 on livability (#49 in VA, #1,166 nationally) — a professional / high-income tenant draw. Strengths: schools A+, crime A+, commute A+; Watch: health & safety C-, amenities F, cost of living F.
- Lee County Public School District (rural): math 53% / reading 69% proficiency, ranked #62 of 131 in VA (top 47%) — acceptable for families but not a draw, mixed tenant base, ~2y average lease.
- Market conditions: 25 active listings in the ZIP; 18 units permitted in Lee County in 2024 (0 in 5+ unit buildings).
Forward outlook
- In year one you build about $8k of equity ($795 loan paydown + $7k appreciation (6.1% local appreciation)).
- Lee County population projected at -27% by 2050 — secular population decline; favor cash flow + early exit over multi-decade hold.
- At projected returns (6.1% appreciation + 3.0% rent growth), your $32k cash investment doubles in ~3 years — after that, you're playing with house money.
- By year 5, paydown + projected appreciation supports a ~$34k cash-out refi (75% LTV) — recoverable capital for the next deal without selling this one.
Negotiation context
- It's been on market 78 days — a 6% lower offer ($108k) is reasonable based on typical stale-listing flexibility.
Questions for the listing agent
- It's been on market 78 days. Have you received any prior offers? Is the seller open to a 6% concession, seller financing, or rate buy-down credit?
- Built in 1972 — when were the roof, HVAC, electrical panel, plumbing, and water heater last replaced?
- Why hasn't it sold? Are there any deal-killer items the seller is aware of (foundation, flood, title, zoning, code violations)?
- Is there a deadline driving the sale (1031 exchange, divorce, estate, relocation)? That informs how much negotiation room exists.
- Schools are A-rated — typically a magnet for longer-tenancy family renters. What's the average tenant stay here, and is there a school-zone premium baked into asking?
- What's the average days-on-market for RENTAL listings here right now (not sales)? A rising rental-DOM trend means longer vacancies and softer asking-rent achievability than the comps imply.
- What's the recent tenant-quality profile in this submarket — average credit score on applications, eviction rate, late-payment / NSF rate, and stable-employment percentage? A property-management company in the area should have these aggregated.
- How much new for-sale + rental construction is in the pipeline within 1–3 miles? Heavy new supply typically softens prices + rents 12–24 months out; constrained supply supports both.
Investment metrics
- 1% rule
- 1.00% ✓
- Cap rate
- 8.45%
- Cash-on-cash
- 7.70%
- DSCR
- 1.34
- GRM
- 8.3
CMA / ARV
- ARV (median comp)
- $149,591
- List price
- $115,000
- Delta
- -23.12%
- Verdict
- UNDERPRICED
- Comps
- 4 within 1.0 mi
Projected returns pro-forma
6.06% appreciation · 3.0% rent growth · sell at horizon
- IRR
- 21.8%
- Equity multiple
- 2.45×
- Total profit
- $46,728
- Equity at exit
- $72,732
- IRR
- 20.8%
- Equity multiple
- 4.94×
- Total profit
- $126,961
- Equity at exit
- $132,277
Cash invested: $32,200 (down + closing). Projections, not guarantees.
Landlord ↔ Tenant lean methodology
- Overall (STATE)
- 55 Moderately Landlord-Leaning
- State Virginia
- 55 Moderately Landlord-Leaning · D+2
- County
- — inherits STATE
- City
- — inherits STATE
ZIP-level market 24281
- Home prices YoY
- 4.4%
- Active inventory
- 25
- Price-to-rent
- 8.3×
Monthly cashflow live
- Estimated rent
- $1,151 medium interval (Pro) →
- Mortgage (P&I)
- −$603
- Tax from tax record
- −$52 /mo · $622/yr
- Insurance
- −$48
- HOA
- −$0
- Vacancy / Maint / Mgmt
- −$242
- Net cashflow
- $206
Break-even live
UW: 25.0% down · 7.5% · 30yr · 1.5% tax · 5.0% vac · 8.0% maint · 8.0% mgmt
Financing live
Cash to close
- Down payment
- $28,750
- Closing costs
- $3,450
- Reserves months
- —
- Total cash needed
- —
Loan-product check · same deal, 3 products live
Conventional
25% down · 7.5% · 30yr
- Down + closing
- —
- Monthly P&I
- —
- Monthly cashflow
- —
- DSCR
- —
- Eligible?
- —
Personal DTI + credit; lowest rate.
DSCR
20% down · 8.5% · 30yr
- Down + closing
- —
- Monthly P&I
- —
- Monthly cashflow
- —
- DSCR
- —
- Eligible?
- —
No personal income docs; deal must DSCR.
Hard money
10% down · 12.0% · 12mo
- Down + closing
- —
- Monthly P&I
- —
- Monthly cashflow
- —
- DSCR
- —
- Eligible?
- —
Short-term bridge; refi at stabilization.
Listing history 17 events
-
2026-06-18days on market $115,000 Active 78 DOM
-
2026-06-17days on market $115,000 Active 77 DOM
-
2026-06-16days on market $115,000 Active 76 DOM
-
2026-06-15days on market $115,000 Active 75 DOM
-
2026-06-15days on market $115,000 Active 74 DOM
-
2026-06-13days on market $115,000 Active 73 DOM
-
2026-06-12pricedays on market $115,000 Active 72 DOM
-
2026-06-09days on market $125,000 Active 69 DOM
-
2026-06-08days on market $125,000 Active 68 DOM
-
2026-06-08days on market $125,000 Active 67 DOM
-
2026-06-07days on market $125,000 Active 66 DOM
-
2026-06-03days on market $125,000 Active 63 DOM
-
2026-06-02days on market $125,000 Active 62 DOM
-
2026-06-01days on market $125,000 Active 61 DOM
-
2026-05-31days on market $125,000 Active 60 DOM
-
2026-05-12price $125,000 318-char remark
Show marketing remark (318 chars)
Don't miss out on this charming home! perfect for any family looking in the Rose Hill area with it being located to nearby schools including LMU! this property would also make a great rental for local students! There is tons of potential for this property with the 2 acres, 2 storage sheds, and barn that goes with it!
-
2026-04-01$135,000 Active 318-char remark
Show marketing remark (318 chars)
Don't miss out on this charming home! perfect for any family looking in the Rose Hill area with it being located to nearby schools including LMU! this property would also make a great rental for local students! There is tons of potential for this property with the 2 acres, 2 storage sheds, and barn that goes with it!
ⓘ Source: listings_history table (triggers on properties + properties_extension) + one-shot
backfill from property_details.listing_events for pre-trigger history.
Tax reassessment forecast VA · Resets to sale price
- Current annual tax
- $622 · $52/mo
- Projected year-2 tax
- $943 · $79/mo
- Expected delta
- +$321/yr (+$27/mo · 51.7%)
ⓘ Screening estimate from a state-policy table — verify with the county assessor before closing.
Nearby sold comps map
Loading sold comps map…
Walkable amenities ~0.75 mi
Loading nearby amenities…
Taxation est. · year 1
- Rental income
- $13,812
- − Mortgage interest
- −$6,442
- − Property taxes
- −$622
- − Insurance
- −$575
- − Repairs & maintenance
- −$1,105
- − Management
- −$1,105
- − Depreciation
- −$3,345
- Taxable income
- $618
- Est. tax owed @ 24.0%
- −$148
- After-tax cash flow
- $2,330/yr
For passive investors: Depreciation is non-cash, so a rental often shows a tax loss while cash-flowing — sheltering income. Rental losses are passive: they offset passive income freely, and up to $25,000/yr can offset ordinary (W-2) income if you actively participate and your MAGI is under $100k (phasing out to $0 by $150k); unused losses carry forward. On sale, claimed depreciation is recaptured at up to 25%, and gains may owe capital-gains tax (a 1031 exchange can defer both). Figures are a year-1 estimate at your 24.0% rate — not tax advice; consult a CPA.
Schools (NCES district)
- District
- Lee County Public School District
- NCES district ID
- 5102190
- Math proficiency
- 53% ▼ -31.00%
- Reading proficiency
- 69% ▼ -9.00%
- Median HH income
- $31,356
- Composite
- 50.06/100
- National rank
- #1913
- State rank
- #62 of 131 in VA
Livability — Rose Hill
- Score
- 82/100
- State rank
- #49
- US rank
- #1166
Category grades
Schools grade is shown separately in the Schools card above.
Census & demographics
- Census place
- Rose Hill, VA
- City population
- 28,136
- Population (ZIP)
- 2,327
Population outlook (Lee County) Hauer SSP2
- Today (2025)
- 22,861 people
- By 2030
- 21,701 · -5.1%
- By 2040
- 19,188 · -16.1%
- By 2050
- 16,619 · -27.3%
- By 2075
- 11,795 · -48.4%
- By 2100
- 8,290 · -63.7%
Race, ethnicity, and origin ACS 2023
- Neighborhood character
- Predominantly White (98%)
- Race & ethnicity
- White 98% Asian 1%
- Common ancestry
- Slovak 2% Serbian 2% Iranian 1%
- Foreign-born
- 1% · Vietnam
- Languages at home
- 94% English-only · Spanish 5% Vietnamese 1%
Political lean MEDSL · Lee
- 2024 margin
- Solid R (+72.0) · D 13.8% · R 85.8%
- 2008→2024 swing
- -43.8pp toward R · 2008: -28.2pp · 2024: -72.0pp
- All cycles
- 2024: R+72.0 2020: R+69.1 2016: R+63.2 2012: R+44.4 2008: R+28.2
Not yet ingested
- Civics
- —
Market trends
- HPI YoY
- ▲ 6.06%
- Current HPI
- 142.4815
- Rent YoY
- —
- Metro
- —
- State GDP YoY
- ▲ 2.40%
- F500 in state
- 50
Industry mix (Fortune 500 HQ in VA)
| Industry | F500 HQs | Revenue |
|---|---|---|
| Aerospace / Defense | 4 | $236B |
|
||
| Technology / Defense | 3 | $32B |
|
||
| Financial Services | 2 | $176B |
|
||
| Utilities | 2 | $27B |
|
||
| Insurance | 2 | $25B |
|
||
| Technology | 2 | $15B |
|
||
Price history
-7.4% since first listed2 events — show timeline
- 2026-05-12 Price Changed $125,000 Knoxville MLS
- 2026-04-01 Listed $135,000 Knoxville MLS
Property tax history
+5.7%/yrLatest (2025): $622 · +51.9% YoY. Source: county tax records.
Cash-flow waterfall
monthlySold comps — $/sqft
last 12 mo · ≤1 miLoading sold comps…