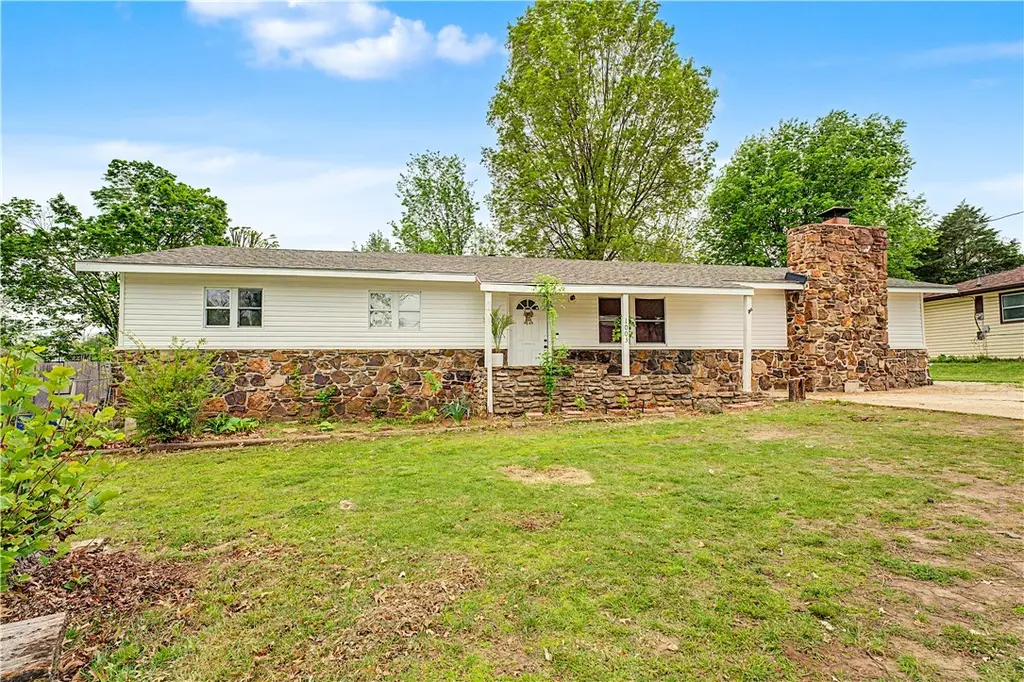
1003 SW 2nd St · Bentonville, AR
Flood risk 1/10 · Minimal
- FEMA flood zone
- X (unshaded)
- Chance of flooding over 30 yrs
- 0.0%
- Est. flood insurance / yr
- $507 – $1,088
Fire risk 3/10 · Minor
- Est. fire insurance / yr
- $1,499 – $2,785
Heat risk 5/10 · Moderate
- Hot days now (above 104°F)
- 7 days/yr
- Hot days in 30 yrs
- 21 days/yr
Wind risk 2/10 · Minimal
- Chance of severe wind over 30 yrs
- 2.0%
Air-quality risk 2/10 · Minimal
- Unhealthy air days now
- 1 days/yr
- Unhealthy air days in 30 yrs
- 1 days/yr
Risk factors via First Street. Map © Google.
Why this score? — see what drove the D+ grade
The composite is a weighted blend of 9 inputs, each scored 0–100. Each bar is that input's sub-score; the figure is the points it added to the 100-point composite (weight × sub-score).
- ARV discount +15.0/15.0
- Cash flow +13.0/30.0
- Schools +5.2/10.0
- Livability +4.2/5.0
- DSCR +3.9/10.0
- Rent growth +3.6/5.0
- 1% rule +2.7/10.0
- Condition / age +2.5/5.0
- Appreciation +0.0/10.0
$398,000
🖨 Deal sheet (PDF) 📄 Offer letter ✓ Due diligence
Listing remarks
Situated on a generous 0.35-acre lot in the heart of Bentonville, this property offers an incredible opportunity to own in one of Northwest Arkansas' most desirable and rapidly growing areas. Just minutes from Downtown Bentonville, the vibrant Bentonville Square, local restaurants, shopping, entertainment, parks, trails, and the new Walmart Home Office, you'll enjoy unmatched convenience and accessibility. The spacious yard provides plenty of room to relax, entertain, garden, or create your own outdoor retreat. The 0.35-acre lot offers endless possibilities and added privacy while still being close to everything Bentonville has to offer. Whether you're looking for a primary residence, an in
Key facts
- Spacious yard
- Easy access
- Natural light
Tags
Property features AI
Finance
- Other: Annual tax information available
- HOA & community: HOA fees billed monthly
Exterior
- Parking: Driveway parking
- Utilities: Electricity available
- Home design: Single-story property; Entry level not specified; Facing direction not specified; Property type not specified
- Construction: Vinyl siding; Architectural shingle roof; Shingle roof; Slab foundation; Year built unknown
- Exterior features: Concrete driveway; Privacy wood fencing; Cleared lot in a central business district; Public road frontage
Interior
- Kitchen: Dishwasher; Electric cooktop
- Bedrooms: Beds not specified
- Flooring: Tile
- Bathrooms: 1 full bathroom; 1 half bathroom
- Heating & cooling: Central heating; Central air conditioning
- Interior features: Ceiling fans; Tile flooring; Bedroom fireplace
- Laundry & utility: Washer hookup; Dryer hookup; Gas water heater
Neighborhood map
What this means for you Summary
Snapshot
- This is a 4-bed/1.5-bath single-family listed at $398k.
Deal economics
- At list price, monthly cash flow is $-23 ($-277/yr) — negative.
- To cash-flow at today's rent, offer at most $394k (1.0% below list).
- To meet the 1% rule (rent ≥ 1% of price), the offer needs to be $306k (23.2% below list).
- Recommended offer: $306k (23.2% below list) — sets the bar for 1% rule.
- Cap rate 6.2% vs local median 2.6% in Bentonville — top-decile yield for the area; either an underpriced asset or a hidden risk that comps aren't pricing in. Stress-test before assuming the spread holds.
Location & tenants
- Location reads 83/100 on livability (#2 in AR, #864 nationally) — a professional / high-income tenant draw. Strengths: employment A+, housing A+, health & safety A+; Watch: amenities F.
- Bentonville School District (urban): math 59% / reading 59% proficiency, ranked #3 of 238 in AR (top 1%) — acceptable for families but not a draw, mixed tenant base, ~2y average lease.
- Market conditions: Rents rising fast (+4.4%/yr); 745 active listings in the ZIP; 35 comparable units currently listed for rent nearby; rentals at typical pace (median 23d on market — plan ~3-4 weeks tenant-placement turnaround); high-income renter base; 4,359 units permitted in Benton County in 2024 (402 in 5+ unit buildings).
- This rent runs 33% of the median local income ($111k/yr) — at the standard rent-burdened threshold; future hikes will face affordability resistance.
Forward outlook
- Local home prices are declining (-3.0%/yr); year-one equity from $3k of loan paydown is wiped out by about $12k of value loss. Plan a longer hold.
- Benton County population projected at +56% by 2050 — long-run rental-demand tailwind backs the buy-and-hold thesis.
Negotiation context
- It's been on market 68 days — a 6% lower offer ($374k) is reasonable based on typical stale-listing flexibility.
- Current owner paid $97k; list at $398k implies a 310% gain — meaningful room to come down on a strong offer.
Risks & watch-outs
- Climate carrying-cost: extreme-heat days projected 7→21/yr by 2055 (HVAC capex compounding) — expect insurance premiums to compound above CPI over the hold.
Questions for the listing agent
- What do current leases actually rent for vs. the listed asking? Can we see a recent rent roll and the last 12 months of T-12 income?
- It's been on market 68 days. Have you received any prior offers? Is the seller open to a 23% concession, seller financing, or rate buy-down credit?
- Why hasn't it sold? Are there any deal-killer items the seller is aware of (foundation, flood, title, zoning, code violations)?
- Is there a deadline driving the sale (1031 exchange, divorce, estate, relocation)? That informs how much negotiation room exists.
- Schools are A-rated — typically a magnet for longer-tenancy family renters. What's the average tenant stay here, and is there a school-zone premium baked into asking?
- The area grade is low — what's the realistic commute time and amenity access for the typical tenant pool here? Any planned neighborhood developments (good or bad) we should know about?
- What's the average days-on-market for RENTAL listings here right now (not sales)? A rising rental-DOM trend means longer vacancies and softer asking-rent achievability than the comps imply.
- What's the recent tenant-quality profile in this submarket — average credit score on applications, eviction rate, late-payment / NSF rate, and stable-employment percentage? A property-management company in the area should have these aggregated.
- How much new for-sale + rental construction is in the pipeline within 1–3 miles? Heavy new supply typically softens prices + rents 12–24 months out; constrained supply supports both.
Investment metrics
- 1% rule
- 0.77% ✗
- Cap rate
- 6.22%
- Cash-on-cash
- -0.25%
- DSCR
- 0.99
- GRM
- 10.9
CMA / ARV
- ARV (on-the-fly)
- $714,550
- Comps found
- 12
Show comp detail 12 sales within ~0.75 mi
| Address | Dist | Beds/Ba | Sqft | Sold | Price | $/sf | Match |
|---|---|---|---|---|---|---|---|
| 202 Big Tree Dr | 0.02mi | 3/2.0 (-1) | 1,638 (+6%) | 10mo | $399,000 | $244 | 74 |
| 1500 Sanford Dr | 0.46mi | 3/2.0 (-1) | 1,614 (+4%) | 1mo | $349,000 | $216 | 64 |
| 208 NW L St | 0.24mi | 4/2.0 | 1,728 (+12%) | 10mo | $492,000 | $285 | 59 |
| 205 NW G St | 0.28mi | 3/1.5 (-1) | 1,364 (-12%) | 5mo | $550,000 | $403 | 58 |
| 308 Crestview Dr | 0.43mi | 4/2.0 | 1,442 (-7%) | 13mo | $665,000 | $461 | 56 |
| 708 NW J St | 0.64mi | 3/2.0 (-1) | 1,469 (-5%) | 1mo | $440,000 | $300 | 54 |
| 303 Coachlight Dr | 0.49mi | 3/2.0 (-1) | 1,604 (+4%) | 14mo | $421,000 | $262 | 52 |
| 218 SW E St | 0.47mi | 3/1.0 (-1) | 1,418 (-8%) | 10mo | $907,500 | $640 | 48 |
| 515 SW F St | 0.54mi | 3/2.0 (-1) | 1,420 (-8%) | 11mo | $690,000 | $486 | 44 |
| 606 SW 4th St | 0.46mi | 3/2.0 (-1) | 1,335 (-14%) | 12mo | $1,000,000 | $749 | 38 |
| 510 W Central Ave | 0.48mi | 3/2.0 (-1) | 1,772 (+14%) | 10mo | $875,000 | $494 | 38 |
| 306 SW B St | 0.68mi | 5/4.0 (+1) | 1,340 (-14%) | 7mo | $999,000 | $746 | 25 |
Match score weights: distance 35% · size 25% · config 20% · recency 20%. Top-matched comps best support the ARV.
Projected returns pro-forma
-3.0% appreciation · 4.39% rent growth · sell at horizon
- IRR
- -15.4%
- Equity multiple
- 0.45×
- Total profit
- $-61,777
- Equity at exit
- $59,343
- IRR
- -4.9%
- Equity multiple
- 0.66×
- Total profit
- $-37,988
- Equity at exit
- $34,412
Cash invested: $111,440 (down + closing). Projections, not guarantees.
Landlord ↔ Tenant lean methodology
- Overall (STATE)
- 92 Strongly Landlord-Friendly
- State Arkansas
- 92 Strongly Landlord-Friendly · R+14
- County
- — inherits STATE
- City
- — inherits STATE
ZIP-level market 72712
- Home prices YoY
- -15.5%
- Rents YoY
- 4.4%
- Active inventory
- 745
- Price-to-rent
- 10.9×
Monthly cashflow live
- Estimated rent
- $3,057 high interval (Pro) →
- Mortgage (P&I)
- −$2,087
- Tax from tax record
- −$185 /mo · $2,217/yr
- Insurance
- −$166
- HOA
- −$0
- Vacancy / Maint / Mgmt
- −$642
- Net cashflow
- $-23
Break-even live
Sensitivity live
| Price | -10% $202 | -5% $90 | +0% $-23 | +5% $-136 | +10% $-248 |
|---|---|---|---|---|---|
| Rent | -10% $-265 | -5% $-144 | +0% $-23 | +5% $98 | +10% $218 |
| Rate | -1.0pp $177 | -0.5pp $78 | base $-23 | +0.5pp $-126 | +1.0pp $-231 |
UW: 25.0% down · 7.5% · 30yr · 1.5% tax · 5.0% vac · 8.0% maint · 8.0% mgmt
Financing live
Cash to close
- Down payment
- $99,500
- Closing costs
- $11,940
- Reserves months
- —
- Total cash needed
- —
Loan-product check · same deal, 3 products live
Conventional
25% down · 7.5% · 30yr
- Down + closing
- —
- Monthly P&I
- —
- Monthly cashflow
- —
- DSCR
- —
- Eligible?
- —
Personal DTI + credit; lowest rate.
DSCR
20% down · 8.5% · 30yr
- Down + closing
- —
- Monthly P&I
- —
- Monthly cashflow
- —
- DSCR
- —
- Eligible?
- —
No personal income docs; deal must DSCR.
Hard money
10% down · 12.0% · 12mo
- Down + closing
- —
- Monthly P&I
- —
- Monthly cashflow
- —
- DSCR
- —
- Eligible?
- —
Short-term bridge; refi at stabilization.
Rent comps 35 comps
| Address | Beds | Baths | Sqft | Rent | $/sqft | DOM | Units | Dist |
|---|---|---|---|---|---|---|---|---|
| 214 NW L St Unit 1363336P Bentonville, AR | 4.0 | 2.0 | 1377 | $3,995 | $2.90 | 23d | 1 | 0.29mi |
| 649 SW 2nd St Bentonville, AR | 4.0 | 3.0 | 2176 | $4,700 | $2.16 | 25d | 1 | 0.43mi |
| 312 Crestview Dr Unit 1297039P Bentonville, AR | 3.0 | 2.0 | 1291 | $2,402 | $1.86 | 23d | 1 | 0.49mi |
| 304 Coachlight Dr Unit 1221882P Bentonville, AR | 4.0 | 2.0 | 1926 | $5,773 | $3.00 | 16d | 1 | 0.49mi |
| 442 SW Glover St Bentonville, AR | 3.0 | 2.5 | 1893 | $5,000 | $2.64 | 25d | 1 | 0.50mi |
| 342 SW D St Bentonville, AR | 3.0 | 2.5 | 1660 | $1,995 | $1.20 | 25d | 1 | 0.57mi |
| 717 NW 6th St Bentonville, AR | 3.0 | 1.5 | 1320 | $1,795 | $1.36 | 16d | 1 | 0.58mi |
| 107 NW Winfield Ln Bentonville, AR | 3.0 | 2.0 | 2044 | $2,695 | $1.32 | 25d | 1 | 0.60mi |
| 406 NW Retreat Ln Bentonville, AR | 3.0 | 2.5 | 1750 | $4,400 | $2.51 | 25d | 1 | 0.62mi |
| 414 NW Retreat Ln Unit 1221809P Bentonville, AR | 3.0 | 2.5 | 1743 | $6,267 | $3.60 | 16d | 1 | 0.63mi |
| 1802 NW Mustang Ave Unit 1241310P Bentonville, AR | 4.0 | 3.0 | 1991 | $3,625 | $1.82 | 23d | 1 | 0.66mi |
| 444 SW B St Bentonville, AR | 3.0 | 2.5 | 1608 | $2,550 | $1.59 | 25d | 1 | 0.72mi |
| 703 NW 10th St Unit 1221918P Bentonville, AR | 3.0 | 2.0 | 1280 | $3,785 | $2.96 | 16d | 1 | 0.90mi |
| 2312 SW Morris St Bentonville, AR | 3.0 | 2.0 | 1188 | $1,350 | $1.14 | 16d | 1 | 0.92mi |
| 501 SW Duke Ave Unit 1221919P Bentonville, AR | 3.0 | 2.0 | 1722 | $4,245 | $2.47 | 16d | 1 | 1.00mi |
| 109 NW Ozark Way Unit 1221875P Bentonville, AR | 4.0 | 3.0 | 2055 | $9,114 | $4.44 | 23d | 1 | 1.08mi |
| Stonegate Duplexes Bentonville, AR | 3.0 | 2.0 | 1225 | $1,350 | $1.10 | 25d | 2 | 1.09mi |
| 210 NW 9th St Unit 1 Bentonville, AR | 3.0 | 3.5 | 2146 | $4,150 | $1.93 | 25d | 1 | 1.12mi |
| 208 NW 9th St Unit 1 Bentonville, AR | 3.0 | 3.5 | 2147 | $4,150 | $1.93 | 23d | 1 | 1.13mi |
| 2607 SW 10th St Bentonville, AR | 3.0 | 2.0 | 1295 | $1,650 | $1.27 | 25d | 1 | 1.14mi |
| 506 SE Tourmaline Mews Unit 1221831P Bentonville, AR | 3.0 | 2.5 | 1905 | $6,288 | $3.30 | 23d | 1 | 1.15mi |
| 104 SE 12th St Unit 1241315P Bentonville, AR | 4.0 | 2.0 | 1797 | $3,747 | $2.09 | 16d | 1 | 1.21mi |
| 911 SW Cheyenne Dr Bentonville, AR | 3.0 | 2.0 | 1388 | $1,700 | $1.22 | 25d | 1 | 1.21mi |
| 4 Jonquilla Way Unit B Bentonville, AR | 4.0 | 2.5 | 1716 | $1,900 | $1.11 | 25d | 1 | 1.28mi |
| Elm Tree Townhomes Bentonville, AR | 2.0–3.0 | 2.5 | 1486 | $1,795 | $1.21 | 15d | 2 | 1.38mi |
| 2315 SW 17th St Bentonville, AR | 3.0 | 2.0 | 1810 | $1,650 | $0.91 | 23d | 1 | 1.38mi |
| 1900 SW Cypress St Bentonville, AR | 3.0 | 2.0 | 2073 | $2,200 | $1.06 | 25d | 1 | 1.39mi |
| 207 Jonathan Dr Bentonville, AR | 3.0 | 2.0 | 1232 | $1,700 | $1.38 | 25d | 1 | 1.39mi |
| 1600 SW Thorton St Bentonville, AR | 3.0 | 2.0 | 1454 | $2,200 | $1.51 | 25d | 1 | 1.40mi |
| 838 SE 8th St Bentonville, AR | 3.0 | 3.0 | 1900 | $3,400 | $1.79 | 25d | 1 | 1.41mi |
| 840 SE 8th St Bentonville, AR | 3.0 | 3.0 | 1900 | $3,400 | $1.79 | 25d | 1 | 1.41mi |
| 1806 SW D St Unit 1221910P Bentonville, AR | 3.0 | 2.0 | 1625 | $5,996 | $3.69 | 16d | 1 | 1.45mi |
| 1308 SE E St Unit 1241345P Bentonville, AR | 3.0 | 1.0 | 1054 | $2,347 | $2.23 | 16d | 1 | 1.46mi |
| 1311 Royal Dr Bentonville, AR | 3.0 | 2.0 | 1360 | $1,600 | $1.18 | 16d | 1 | 1.49mi |
| 1902 SW Fremont St Bentonville, AR | 3.0 | 2.0 | 1805 | $1,700 | $0.94 | 16d | 1 | 1.50mi |
Listing history 18 events
-
2026-06-22days on market $398,000 Active 68 DOM
-
2026-06-18days on market $398,000 Active 65 DOM
-
2026-06-17days on market $398,000 Active 64 DOM
-
2026-06-15days on market $398,000 Active 62 DOM
-
2026-06-14days on market $398,000 Active 60 DOM
-
2026-06-10days on market $398,000 Active 57 DOM
-
2026-06-09days on market $398,000 Active 56 DOM
-
2026-06-08days on market $398,000 Active 55 DOM
-
2026-06-07days on market $398,000 Active 54 DOM
-
2026-06-05days on market $398,000 Active 51 DOM
-
2026-06-03days on market $398,000 Active 50 DOM
-
2026-06-02pricedays on market $398,000 Active 49 DOM
-
2026-06-01days on market $440,000 Active 48 DOM
-
2026-06-01remarks 699-char remark
-
2026-05-31days on market $440,000 Active 47 DOM
-
2026-05-31days on market $440,000 Active 46 DOM
-
2026-04-14$440,000 Active
-
2005-03-31soldstatus $97,000
ⓘ Source: listings_history table (triggers on properties + properties_extension) + one-shot
backfill from property_details.listing_events for pre-trigger history.
Tax reassessment forecast AR · Resets to sale price
- Current annual tax
- $2,217 · $185/mo
- Projected year-2 tax
- $2,547 · $212/mo
- Expected delta
- +$330/yr (+$28/mo · 14.9%)
ⓘ Screening estimate from a state-policy table — verify with the county assessor before closing.
Climate risk First Street
- Flood 1/10 Low FEMA zone X (unshaded) · 0% chance over 30 yrs
- Wildfire 3/10 Moderate
- Heat 5/10 Major 7 d/yr ≥104°F today · 21 d/yr by 30 yrs out
- Wind 2/10 Low 2% chance of damaging wind over 30 yrs
- Air quality 2/10 Low 1 unhealthy d/yr today · 1 by 30 yrs out
Nearby sold comps map
Loading sold comps map…
Walkable amenities ~0.75 mi
Loading nearby amenities…
Taxation est. · year 1
- Rental income
- $36,678
- − Mortgage interest
- −$22,294
- − Property taxes
- −$2,217
- − Insurance
- −$1,990
- − Repairs & maintenance
- −$2,934
- − Management
- −$2,934
- − Depreciation
- −$11,578
- Taxable loss
- −$7,270
- Est. tax savings @ 24.0%
- +$1,745
- After-tax cash flow
- $1,467/yr
For passive investors: Depreciation is non-cash, so a rental often shows a tax loss while cash-flowing — sheltering income. Rental losses are passive: they offset passive income freely, and up to $25,000/yr can offset ordinary (W-2) income if you actively participate and your MAGI is under $100k (phasing out to $0 by $150k); unused losses carry forward. On sale, claimed depreciation is recaptured at up to 25%, and gains may owe capital-gains tax (a 1031 exchange can defer both). Figures are a year-1 estimate at your 24.0% rate — not tax advice; consult a CPA.
Schools (NCES district)
- District
- Bentonville School District
- NCES district ID
- 0503060
- Math proficiency
- 59% ▼ -8.00%
- Reading proficiency
- 59% ▼ -6.00%
- Median HH income
- $66,721
- Composite
- 51.85/100
- National rank
- #1661
- State rank
- #3 of 238 in AR
Livability — Bentonville
- Score
- 83/100
- State rank
- #2
- US rank
- #864
Category grades
Schools grade is shown separately in the Schools card above.
Census & demographics
- Census place
- Bentonville, AR
- County
- Benton County · 259,241 people
- City population
- 67,689
- Metro
- Fayetteville-Springdale-Rogers, AR
- Population (ZIP)
- 38,690
- Household income
- $110,514
- Rent vs Own
- Severe rent burden
- 932.0
Population outlook (Benton County) Hauer SSP2
- Today (2025)
- 318,683 people
- By 2030
- 353,481 · +10.9%
- By 2040
- 425,280 · +33.4%
- By 2050
- 497,239 · +56.0%
- By 2075
- 662,114 · +107.8%
- By 2100
- 776,431 · +143.6%
Race, ethnicity, and origin ACS 2023
- Neighborhood character
- Diverse neighborhood (Simpson 0.55)
- Race & ethnicity
- White 66% Two or more races 17% Hispanic / Latino 10% Asian 6% Black 4%
- Hispanic origin (detail)
- Mexican 7%
- Common ancestry
- Slovak 3% Italian 2% Lithuanian 2%
- Foreign-born
- 11% · Canada, Vietnam, China
- Languages at home
- 89% English-only · Spanish 6% Other Asian/Pacific 2% Other Indo-European 2%
Political lean MEDSL · Benton
- 2024 margin
- Strong R (+27.0) · D 35.2% · R 62.1% · Other 2.7%
- 2008→2024 swing
- +9.6pp toward D · 2008: -36.5pp · 2024: -27.0pp
- All cycles
- 2024: R+27.0 2020: R+26.4 2016: R+34.9 2012: R+40.4 2008: R+36.5
Not yet ingested
- Civics
- —
Market trends
- HPI YoY
- ▼ -66.76%
- Current HPI
- 365.1641
- Rent YoY
- ▲ 4.39%
- Metro
- Fayetteville-Springdale-Rogers, AR
- State GDP YoY
- ▲ 3.80%
- F500 in state
- 10
Industry mix (Fortune 500 HQ in AR)
| Industry | F500 HQs | Revenue |
|---|---|---|
| Retail | 1 | $681B |
|
||
| Food / Agriculture | 1 | $53B |
|
||
| Retail / Energy | 1 | $22B |
|
||
| Transportation / Logistics | 1 | $12B |
|
||
| Energy | 1 | $4B |
|
||
Price history
+353.6% since first listed2 events — show timeline
- 2026-04-14 Listed $440,000 NWARMLS
- 2005-03-31 Sold (Public Records) $97,000 Public Records
Property tax history
+7.3%/yrLatest (2025): $2,217 · +9.9% YoY. Source: county tax records.
Cash-flow waterfall
monthlySold comps — $/sqft
last 12 mo · ≤1 miLoading sold comps…