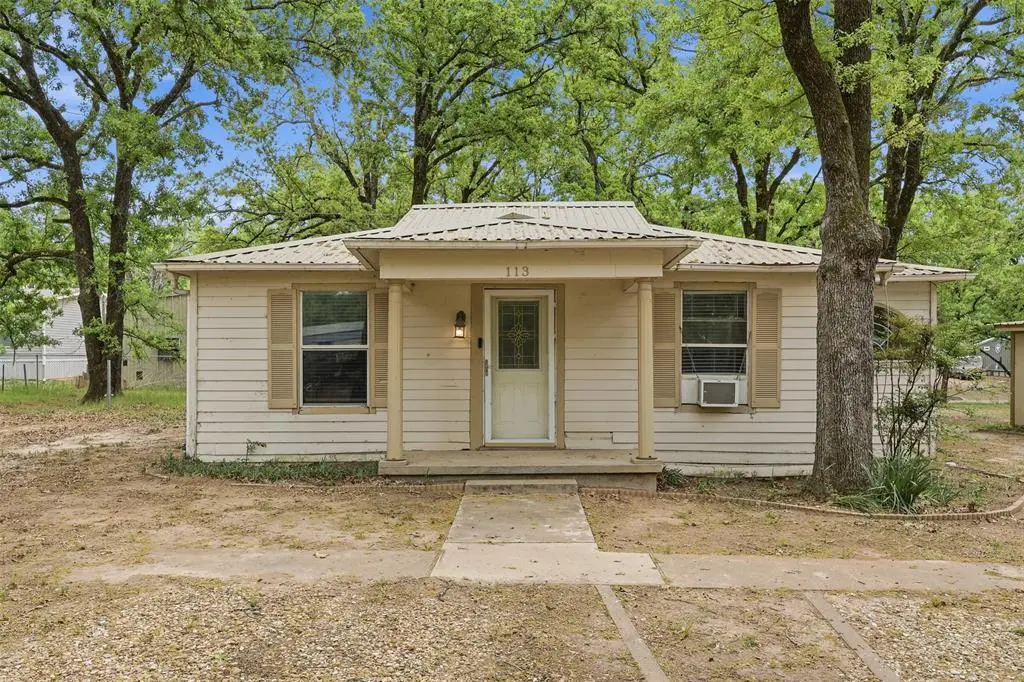
113 Karen Ln · Gun Barrel City, TX
Flood risk 1/10 · Minimal
- FEMA flood zone
- X (unshaded)
- Chance of flooding over 30 yrs
- 0.0%
- Est. flood insurance / yr
- $507 – $1,088
Fire risk 3/10 · Minor
- Est. fire insurance / yr
- $1,222 – $2,270
Heat risk 7/10 · Major
- Hot days now (above 109°F)
- 7 days/yr
- Hot days in 30 yrs
- 26 days/yr
Wind risk 6/10 · Moderate
- Chance of severe wind over 30 yrs
- 60.0%
Air-quality risk 2/10 · Minimal
- Unhealthy air days now
- 0 days/yr
- Unhealthy air days in 30 yrs
- 1 days/yr
Risk factors via First Street. Map © Google.
Why this score? — see what drove the C+ grade
The composite is a weighted blend of 9 inputs, each scored 0–100. Each bar is that input's sub-score; the figure is the points it added to the 100-point composite (weight × sub-score).
- Cash flow +29.3/30.0
- DSCR +10.0/10.0
- ARV discount +7.5/15.0
- 1% rule +7.2/10.0
- Schools +3.8/10.0
- Livability +3.4/5.0
- Condition / age +2.5/5.0
- Rent growth +1.1/5.0
- Appreciation +0.0/10.0
$119,999
🖨 Deal sheet 📄 Offer letter ✓ Due diligence
Listing remarks MLS
Investor special with strong upside, this property is ideal for buyers ready to bring vision and renovation to life. Rare opportunity to own a multi-lot property just moments from Cedar Creek Lake, offering approximately 0.86 acres of land combined. This unique property includes multiple structures and is surrounded by mature trees, creating a private, peaceful setting with plenty of room to expand, build, or reimagine. Located near a community boat ramp and dock, this property is perfect for those looking to enjoy lake living while capitalizing on the strong growth in the surrounding area. With new construction and development happening nearby, the upside potential here is significant. The existing improvements provide a solid foundation for a renovation project, rental portfolio, or full redevelopment. Whether you're an investor looking to flip, build multiple homes, create a long-term hold, or design your own lakeside retreat, this property offers flexibility and opportunity that is hard to find in this location. All lots are included in the sale, giving you maximum control and future potential.
Key facts
- 0.86 acre lot
- 2 garage spots
- Built 1992
Neighborhood map
What this means for you Summary
Snapshot
- This is a 3-bed/2.0-bath single-family listed at $120k.
Deal economics
- At list price, monthly cash flow is $420 ($5k/yr) — positive.
- The deal already cash-flows at list — no discount required.
- Meets the 1% rule at list price ($1k rent vs $120k).
- Recommended offer: $113k (6.0% below list) — sets the bar for market timing.
- Cap rate 10.5% vs local median 3.3% in Gun Barrel City — top-decile yield for the area; either an underpriced asset or a hidden risk that comps aren't pricing in. Stress-test before assuming the spread holds.
Location & tenants
- Location reads 67/100 on livability (#519 in TX) — a middle-class / working-renter tenant base. Strengths: cost of living A+, housing A+, health & safety B+; Watch: employment D+, amenities F, commute F.
- Mabank ISD (town): math 47% / reading 44% proficiency, ranked #273 of 826 in TX (top 33%) — families likely to look elsewhere, expect single-tenant / working-renter base with shorter leases.
- Market conditions: Rents falling (-5.8%/yr); 694 active listings in the ZIP; 263 units permitted in Henderson County in 2024 (0 in 5+ unit buildings).
Forward outlook
- Local home prices are declining (-3.0%/yr); year-one equity from $829 of loan paydown is wiped out by about $4k of value loss. Plan a longer hold.
Negotiation context
- It's been on market 76 days — a 6% lower offer ($113k) is reasonable based on typical stale-listing flexibility.
- 7 sale attempts since 3y ago; this cycle's ask has dropped $10k (8%) from the opening price — seller is motivated, your offer sets the floor, not the list.
Risks & watch-outs
- Climate carrying-cost: major wind risk, 60% chance of damaging wind over 30y; extreme-heat days projected 7→26/yr by 2055 (HVAC capex compounding) — expect insurance premiums to compound above CPI over the hold.
Questions for the listing agent
- It's been on market 76 days. Have you received any prior offers? Is the seller open to a 6% concession, seller financing, or rate buy-down credit?
- What does the HOA fee cover, when was the last increase, and are there any pending special assessments or reserve-fund shortfalls?
- Why hasn't it sold? Are there any deal-killer items the seller is aware of (foundation, flood, title, zoning, code violations)?
- Is there a deadline driving the sale (1031 exchange, divorce, estate, relocation)? That informs how much negotiation room exists.
- What's the average days-on-market for RENTAL listings here right now (not sales)? A rising rental-DOM trend means longer vacancies and softer asking-rent achievability than the comps imply.
- What's the recent tenant-quality profile in this submarket — average credit score on applications, eviction rate, late-payment / NSF rate, and stable-employment percentage? A property-management company in the area should have these aggregated.
- How much new for-sale + rental construction is in the pipeline within 1–3 miles? Heavy new supply typically softens prices + rents 12–24 months out; constrained supply supports both.
Investment metrics
- 1% rule
- 1.22% ✓
- Cap rate
- 10.50%
- Cash-on-cash
- 15.01%
- DSCR
- 1.67
- GRM
- 6.8
CMA / ARV
- ARV (median comp)
- $286,529
- List price
- $119,999
- Delta
- -58.12%
- Verdict
- UNDERPRICED
- Comps
- 20 within 1.0 mi
Show comp detail 2 sales within ~0.75 mi
| Address | Dist | Beds/Ba | Sqft | Sold | Price | $/sf | Match |
|---|---|---|---|---|---|---|---|
| 130 Meadowlark Ln | 0.40mi | 3/2.0 | 1,036 (+6%) | 13mo | $139,900 | $135 | 61 |
| 175 Wedgewood Dr | 0.68mi | 2/2.0 (-1) | 956 (-2%) | 11mo | $100,000 | $105 | 50 |
Match score weights: distance 35% · size 25% · config 20% · recency 20%. Top-matched comps best support the ARV.
Projected returns pro-forma
-3.0% appreciation · 0.0% rent growth · sell at horizon
- IRR
- 2.4%
- Equity multiple
- 1.09×
- Total profit
- $2,990
- Equity at exit
- $17,892
- IRR
- 9.0%
- Equity multiple
- 1.60×
- Total profit
- $20,323
- Equity at exit
- $10,375
Cash invested: $33,600 (down + closing). Projections, not guarantees.
Landlord ↔ Tenant lean methodology
- Overall (STATE)
- 87 Strongly Landlord-Friendly
- State Texas
- 87 Strongly Landlord-Friendly · R+5
- County
- — inherits STATE
- City
- — inherits STATE
ZIP-level market 75156
- Rents YoY
- -5.8%
- Active inventory
- 694
- Price-to-rent
- 6.8×
Monthly cashflow live
- Estimated rent
- $1,467 medium interval (Pro) →
- Mortgage (P&I)
- −$629
- Tax from tax record
- −$53 /mo · $637/yr
- Insurance
- −$50
- HOA
- −$6
- Vacancy / Maint / Mgmt
- −$308
- Net cashflow
- $420
Break-even live
UW: 25.0% down · 7.5% · 30yr · 1.5% tax · 5.0% vac · 8.0% maint · 8.0% mgmt
Financing live
Cash to close
- Down payment
- $30,000
- Closing costs
- $3,600
- Reserves months
- —
- Total cash needed
- —
Loan-product check · same deal, 3 products live
Conventional
25% down · 7.5% · 30yr
- Down + closing
- —
- Monthly P&I
- —
- Monthly cashflow
- —
- DSCR
- —
- Eligible?
- —
Personal DTI + credit; lowest rate.
DSCR
20% down · 8.5% · 30yr
- Down + closing
- —
- Monthly P&I
- —
- Monthly cashflow
- —
- DSCR
- —
- Eligible?
- —
No personal income docs; deal must DSCR.
Hard money
10% down · 12.0% · 12mo
- Down + closing
- —
- Monthly P&I
- —
- Monthly cashflow
- —
- DSCR
- —
- Eligible?
- —
Short-term bridge; refi at stabilization.
HOA detail
- Monthly dues
- $6 · $72/yr
Listing history 31 events
-
2026-06-19days on market $119,999 Active 76 DOM
-
2026-06-18days on market $119,999 Active 75 DOM
-
2026-06-17days on market $119,999 Active 74 DOM
-
2026-06-16days on market $119,999 Active 73 DOM
-
2026-06-15days on market $119,999 Active 72 DOM
-
2026-06-14days on market $119,999 Active 70 DOM
-
2026-06-12days on market $119,999 Active 69 DOM
-
2026-06-09days on market $119,999 Active 66 DOM
-
2026-06-08days on market $119,999 Active 65 DOM
-
2026-06-07days on market $119,999 Active 64 DOM
-
2026-06-05days on market $119,999 Active 61 DOM
-
2026-06-03days on market $119,999 Active 60 DOM
-
2026-06-02days on market $119,999 Active 59 DOM
-
2026-06-01days on market $119,999 Active 58 DOM
-
2026-05-31days on market $119,999 Active 57 DOM
-
2026-05-30days on market $119,999 Active 56 DOM
-
2026-04-30price $119,999 1118-char remark
Show marketing remark (1118 chars)
Investor special with strong upside, this property is ideal for buyers ready to bring vision and renovation to life. Rare opportunity to own a multi-lot property just moments from Cedar Creek Lake, offering approximately 0.86 acres of land combined. This unique property includes multiple structures and is surrounded by mature trees, creating a private, peaceful setting with plenty of room to expand, build, or reimagine. Located near a community boat ramp and dock, this property is perfect for those looking to enjoy lake living while capitalizing on the strong growth in the surrounding area. With new construction and development happening nearby, the upside potential here is significant. The existing improvements provide a solid foundation for a renovation project, rental portfolio, or full redevelopment. Whether you're an investor looking to flip, build multiple homes, create a long-term hold, or design your own lakeside retreat, this property offers flexibility and opportunity that is hard to find in this location. All lots are included in the sale, giving you maximum control and future potential.
-
2026-04-04$129,999 Active 1118-char remark
Show marketing remark (1118 chars)
Investor special with strong upside, this property is ideal for buyers ready to bring vision and renovation to life. Rare opportunity to own a multi-lot property just moments from Cedar Creek Lake, offering approximately 0.86 acres of land combined. This unique property includes multiple structures and is surrounded by mature trees, creating a private, peaceful setting with plenty of room to expand, build, or reimagine. Located near a community boat ramp and dock, this property is perfect for those looking to enjoy lake living while capitalizing on the strong growth in the surrounding area. With new construction and development happening nearby, the upside potential here is significant. The existing improvements provide a solid foundation for a renovation project, rental portfolio, or full redevelopment. Whether you're an investor looking to flip, build multiple homes, create a long-term hold, or design your own lakeside retreat, this property offers flexibility and opportunity that is hard to find in this location. All lots are included in the sale, giving you maximum control and future potential.
-
2025-09-17historical
-
2025-05-31price $157,000
-
2025-04-11$138,900 Active
-
2024-12-31historical
-
2024-11-07price $174,750
-
2024-08-27$175,000 Active
-
2024-08-27historical
-
2024-04-11$190,000 Active
-
2024-03-07historical
-
2024-02-28$160,000 Active
-
2024-02-12$160,000 Active
-
2024-01-17historical
-
2023-10-18$199,900 Active
ⓘ Source: listings_history table (triggers on properties + properties_extension) + one-shot
backfill from property_details.listing_events for pre-trigger history.
Tax reassessment forecast TX · Resets to sale price
- Current annual tax
- $637 · $53/mo
- Projected year-2 tax
- $2,196 · $183/mo
- Expected delta
- +$1,559/yr (+$130/mo · 244.9%)
ⓘ Screening estimate from a state-policy table — verify with the county assessor before closing.
Climate risk First Street
- Flood 1/10 Low FEMA zone X (unshaded) · 0% chance over 30 yrs
- Wildfire 3/10 Moderate
- Heat 7/10 Severe 7 d/yr ≥109°F today · 26 d/yr by 30 yrs out
- Wind 6/10 Major 60% chance of damaging wind over 30 yrs
- Air quality 2/10 Low 0 unhealthy d/yr today · 1 by 30 yrs out
Nearby sold comps map
Loading sold comps map…
Walkable amenities ~0.75 mi
Loading nearby amenities…
Taxation est. · year 1
- Rental income
- $17,599
- − Mortgage interest
- −$6,722
- − Property taxes
- −$637
- − Insurance
- −$600
- − Repairs & maintenance
- −$1,408
- − Management
- −$1,408
- − HOA
- −$72
- − Depreciation
- −$3,491
- Taxable income
- $3,262
- Est. tax owed @ 24.0%
- −$783
- After-tax cash flow
- $4,260/yr
For passive investors: Depreciation is non-cash, so a rental often shows a tax loss while cash-flowing — sheltering income. Rental losses are passive: they offset passive income freely, and up to $25,000/yr can offset ordinary (W-2) income if you actively participate and your MAGI is under $100k (phasing out to $0 by $150k); unused losses carry forward. On sale, claimed depreciation is recaptured at up to 25%, and gains may owe capital-gains tax (a 1031 exchange can defer both). Figures are a year-1 estimate at your 24.0% rate — not tax advice; consult a CPA.
Schools (NCES district)
- District
- Mabank ISD
- NCES district ID
- 4828680
- Math proficiency
- 47% ▼ -19.00%
- Reading proficiency
- 44% ▼ -11.00%
- Median HH income
- $40,321
- Composite
- 38.15/100
- National rank
- #4267
- State rank
- #273 of 826 in TX
Livability — Gun Barrel City
- Score
- 67/100
- State rank
- #519
- US rank
- #10212
Category grades
Schools grade is shown separately in the Schools card above.
Census & demographics
- Census place
- Gun Barrel City, TX
- County
- Henderson County · 34,977 people
- Metro
- Athens, TX
- Population (ZIP)
- 16,333
- Household income
- $60,867
- Rent vs Own
- Severe rent burden
- 400.0
Population outlook (Henderson County) Hauer SSP2
- Today (2025)
- 80,471 people
- By 2030
- 80,608 · +0.2%
- By 2040
- 80,087 · -0.5%
- By 2050
- 78,208 · -2.8%
- By 2075
- 72,423 · -10.0%
- By 2100
- 61,012 · -24.2%
Race, ethnicity, and origin ACS 2023
- Neighborhood character
- Predominantly White (85%)
- Race & ethnicity
- White 85% Hispanic / Latino 7% Two or more races 7% Black 1%
- Hispanic origin (detail)
- Mexican 5%
- Common ancestry
- Slovak 3% Serbian 2% European 2%
- Foreign-born
- 4% · Canada, Jamaica
- Languages at home
- 94% English-only · Spanish 4% Other Indo-European 1%
Political lean MEDSL · Henderson
- 2024 margin
- Solid R (+63.5) · D 18.0% · R 81.4%
- 2008→2024 swing
- -18.8pp toward R · 2008: -44.6pp · 2024: -63.5pp
- All cycles
- 2024: R+63.5 2020: R+60.2 2016: R+60.0 2012: R+54.8 2008: R+44.6
Not yet ingested
- Civics
- —
Market trends
- HPI YoY
- ▼ -216.77%
- Current HPI
- 199.8108
- Rent YoY
- ▼ -5.76%
- Metro
- Athens, TX
- State GDP YoY
- ▲ 3.95%
- F500 in state
- 110
Industry mix (Fortune 500 HQ in TX)
| Industry | F500 HQs | Revenue |
|---|---|---|
| Energy | 16 | $1,198B |
|
||
| Technology | 5 | $198B |
|
||
| Engineering / Construction | 4 | $72B |
|
||
| Energy Services | 3 | $60B |
|
||
| Utilities | 3 | $41B |
|
||
| Healthcare | 2 | $330B |
|
||
Price history
-40.0% since first listed15 events — show timeline
- 2026-04-30 Price Changed $119,999 NTREIS
- 2026-04-04 Listed $129,999 NTREIS
- 2025-09-17 Listing Removed — NTREIS
- 2025-05-31 Price Changed $157,000 NTREIS
- 2025-04-11 Listed $138,900 NTREIS
- 2024-12-31 Listing Removed — NTREIS
- 2024-11-07 Price Changed $174,750 NTREIS
- 2024-08-27 Listing Removed — NTREIS
- 2024-08-27 Listed $175,000 NTREIS
- 2024-04-11 Listed $190,000 NTREIS
- 2024-03-07 Listing Removed — NTREIS
- 2024-02-28 Listed $160,000 HCBOR
- 2024-02-12 Listed $160,000 NTREIS
- 2024-01-17 Listing Removed — NTREIS
- 2023-10-18 Listed $199,900 NTREIS
Property tax history
+1.7%/yrLatest (2025): $637 · +10.6% YoY. Source: county tax records.
Cash-flow waterfall
monthlySold comps — $/sqft
last 12 mo · ≤1 miLoading sold comps…