 Duplex
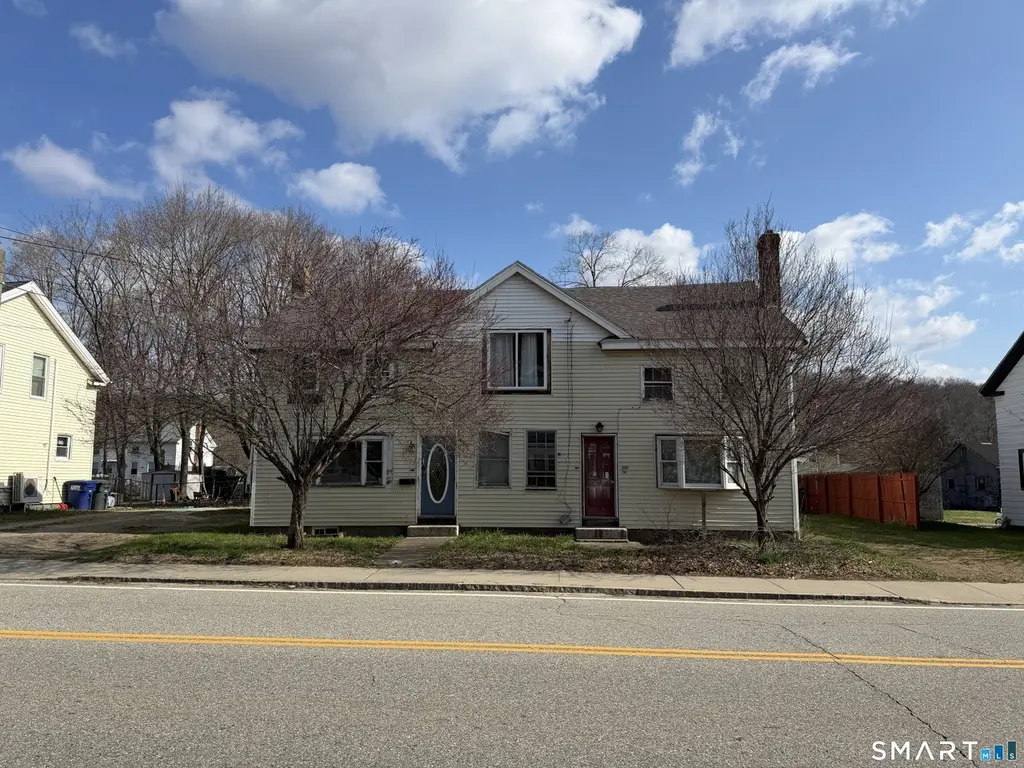
148 Main St · Baltic, CT
Flood risk 2/10 · Minimal
- FEMA flood zone
- AE
- Chance of flooding over 30 yrs
- 0.07%
- Est. flood insurance / yr
- $2,026 – $9,024
Fire risk 3/10 · Minor
- Est. fire insurance / yr
- $829 – $1,539
Heat risk 5/10 · Moderate
- Hot days now (above 96°F)
- 7 days/yr
- Hot days in 30 yrs
- 17 days/yr
Wind risk 6/10 · Moderate
- Chance of severe wind over 30 yrs
- 59.0%
Air-quality risk 3/10 · Minor
- Unhealthy air days now
- 2 days/yr
- Unhealthy air days in 30 yrs
- 3 days/yr
Risk factors via First Street. Map © Google.
Why this score? — see what drove the B+ grade
The composite is a weighted blend of 9 inputs, each scored 0–100. Each bar is that input's sub-score; the figure is the points it added to the 100-point composite (weight × sub-score).
- Cash flow +30.0/30.0
- ARV discount +15.0/15.0
- 1% rule +10.0/10.0
- DSCR +10.0/10.0
- Livability +3.5/5.0
- Schools +3.2/10.0
- Rent growth +2.5/5.0
- Condition / age +2.5/5.0
- Appreciation +0.0/10.0
$209,900
🖨 Deal sheet 📄 Offer letter ✓ Due diligence
Multi-family units
County records classify this as Multi-Family (2-4 Unit). Listing-text estimate: 2 units. confirmed
Listing remarks
Townhouse-style two-family property ready for full renovation. Ideal for investors, flippers, or contractors looking to add value. Unit 1: 2 bedrooms, 1 bathroom, spacious living room, eat-in kitchen. Unit 2: 3 bedrooms, 1 bathroom with an eat-in kitchen, and a large living room Situated in a quiet neighborhood with ample parking and a good-sized yard. No heating system. Power is currently off. The property requires significant rehab and is being sold as-is. Great upside potential for the right buyer-bring your vision and tools to transform this property. Cash buyers only.
Key facts
- 8,712 sq ft lot
- 4 parking spots
- Built 1856
Property features AI
Finance
- Financial info: Assessed value listed (public record)
Exterior
- Parking: Driveway and off-street parking (including unpaved areas); 4 total parking spaces
- Utilities: Public water connected; Public sewer connected
- Home design: Multi-family property (2-family)
- Construction: Frame construction; Stone foundation; Built prior to or around public record living area reporting
- Exterior features: Level lot; Vinyl siding; Asphalt shingle roof
Interior
- Kitchen: No specific appliance details provided
- Bedrooms: 5 bedrooms (total across both units)
- Bathrooms: 2 full bathrooms (total)
- Heating & cooling: Hot water heating; No fuel specified for heating
- Interior features: 9 total rooms; Full unfinished basement; Two-unit multi-family layout
- Laundry & utility: No hot water available
Neighborhood map
What this means for you Summary
Snapshot
- This is a 1×2.0bd/1.0ba + 1×3.0bd/1.0ba units multifamily listed at $210k.
Deal economics
- At list price, monthly cash flow is $781 ($9k/yr) — positive. Per door: $391/mo.
- The deal already cash-flows at list — no discount required.
- Meets the 1% rule at list price ($4k rent vs $210k).
- Recommended offer: $204k (3.0% below list) — sets the bar for market timing.
Location & tenants
- Location reads 69/100 on livability (#104 in CT) — a middle-class / working-renter tenant base. Strengths: crime A+, housing A+, cost of living A-; Watch: schools F, amenities F, commute F.
- Sprague School District (suburban): math 25% / reading 40% proficiency, ranked #170 of 192 in CT (top 88%) — families likely to look elsewhere, expect single-tenant / working-renter base with shorter leases.
- Market conditions: 14 active listings in the ZIP; 1 comparable units currently listed for rent nearby; 487 units permitted in Southeastern Connecticut Planning Region in 2024 (244 in 5+ unit buildings).
Forward outlook
- Local home prices are declining (-3.0%/yr); year-one equity from $1k of loan paydown is wiped out by about $6k of value loss. Plan a longer hold.
- At projected returns (-3.0% appreciation + 3.0% rent growth), your $59k cash investment doubles in ~8 years — after that, you're playing with house money.
Negotiation context
- It's been on market 44 days — a 3% lower offer ($204k) is reasonable based on typical stale-listing flexibility.
- 3 sale attempts since 8y ago with the ask held roughly flat each time — persistent listings suggest the price (not the market) is what's stuck; bring a comps-based counter.
- Current owner paid $32k; list at $210k implies a 546% gain — meaningful room to come down on a strong offer.
Risks & watch-outs
- Watch-outs: flood insurance adds $460/mo; built in 1856 — expect roof / HVAC / electrical / plumbing capex.
- Climate carrying-cost: in FEMA flood zone AE (mandatory federal flood insurance); major wind risk, 59% chance of damaging wind over 30y; extreme-heat days projected 7→17/yr by 2055 (HVAC capex compounding) — expect insurance premiums to compound above CPI over the hold.
Questions for the listing agent
- It's been on market 44 days. Have you received any prior offers? Is the seller open to a 3% concession, seller financing, or rate buy-down credit?
- Can we see the unit-by-unit rent roll, current vacancy, and any below-market leases? What's the average tenancy length?
- What capital expenditures (roof, boiler, parking lot, exteriors) have been made in the last 5 years, and what's planned in the next 2?
- Built in 1856 — when were the roof, HVAC, electrical panel, plumbing, and water heater last replaced?
- What's the actual annual flood-insurance premium (NFIP or private), and is the property in a SFHA with mandatory coverage?
- Is there a deadline driving the sale (1031 exchange, divorce, estate, relocation)? That informs how much negotiation room exists.
- Schools are F-rated, which usually means shorter tenancies and higher turnover. Who's the typical renter profile here, and what's been the actual vacancy rate?
- What's the average days-on-market for RENTAL listings here right now (not sales)? A rising rental-DOM trend means longer vacancies and softer asking-rent achievability than the comps imply.
- What's the recent tenant-quality profile in this submarket — average credit score on applications, eviction rate, late-payment / NSF rate, and stable-employment percentage? A property-management company in the area should have these aggregated.
- How much new apartment / multifamily construction is in the pipeline within 1–3 miles? Heavy new supply (>2% of stock underway) typically softens rents 12–24 months out; light construction supports rent growth.
Investment metrics
- 1% rule
- 1.68% ✓
- Cap rate
- 13.39%
- Cash-on-cash
- 25.36%
- DSCR
- 2.13
- GRM
- 5.0
CMA / ARV
- ARV (on-the-fly)
- $294,624
- Comps found
- 12
Show comp detail 12 sales within ~0.75 mi
| Address | Dist | Beds/Ba | Sqft | Sold | Price | $/sf | Match |
|---|---|---|---|---|---|---|---|
| 71 River St | 0.03mi | 5/2.0 | 2,376 (0%) | 1mo | $320,000 | $135 | 97 |
| 125 Main St | 0.10mi | 6/2.5 (+1) | 2,376 (0%) | 5mo | $255,000 | $107 | 84 |
| 117 Main St | 0.14mi | 6/3.0 (+1) | 2,376 (0%) | 4mo | $260,000 | $109 | 81 |
| 95 River St | 0.09mi | 6/3.0 (+1) | 2,376 (0%) | 10mo | $350,000 | $147 | 79 |
| 216 High St | 0.15mi | 6/2.0 (+1) | 2,376 (0%) | 12mo | $221,000 | $93 | 78 |
| 192 High St | 0.24mi | 6/2.0 (+1) | 2,376 (0%) | 14mo | $310,000 | $130 | 72 |
| 132 Main St | 0.07mi | 6/3.0 (+1) | 2,376 (0%) | 19mo | $206,000 | $87 | 72 |
| 212 High St | 0.16mi | 6/3.0 (+1) | 2,576 (+8%) | 6mo | $350,000 | $136 | 64 |
| 177 High St | 0.31mi | 6/3.0 (+1) | 2,376 (0%) | 16mo | $294,000 | $124 | 63 |
| 12 W Main St | 0.40mi | 5/3.0 | 2,588 (+9%) | 1mo | $190,000 | $73 | 61 |
| 123 High St | 0.42mi | 6/4.0 (+1) | 2,500 (+5%) | 4mo | $315,000 | $126 | 55 |
| 9 W Main St | 0.41mi | 6/2.0 (+1) | 2,454 (+3%) | 20mo | $280,000 | $114 | 54 |
Match score weights: distance 35% · size 25% · config 20% · recency 20%. Top-matched comps best support the ARV.
Projected returns pro-forma
-3.0% appreciation · 3.0% rent growth · sell at horizon
- IRR
- 7.0%
- Equity multiple
- 1.27×
- Total profit
- $16,150
- Equity at exit
- $31,297
- IRR
- 16.5%
- Equity multiple
- 2.36×
- Total profit
- $79,747
- Equity at exit
- $18,148
Cash invested: $58,772 (down + closing). Projections, not guarantees.
Landlord ↔ Tenant lean methodology
- Overall (STATE)
- 27 Tenant-Leaning
- State Connecticut
- 27 Tenant-Leaning · D+7
- County
- — inherits STATE
- City
- — inherits STATE
ZIP-level market 06330
- Home prices YoY
- -12.3%
- Active inventory
- 14
- Price-to-rent
- 10.1×
Monthly cashflow live
- Estimated rent
- $3,526 medium interval (Pro) →
- Mortgage (P&I)
- −$1,101
- Tax from tax record
- −$356 /mo · $4,266/yr
- Insurance
- −$87
- Flood insurance flood zone
- −$460 /mo · $5,525/yr
- HOA
- −$0
- Vacancy / Maint / Mgmt
- −$740
- Net cashflow
- $781
Break-even live
2-unit breakdown (identical units grouped — click to expand)
| Units | Beds | Baths | Est. rent |
|---|---|---|---|
| 1× unit | 2.0 | 1 | $1,732 |
| 1× unit | 3.0 | 1 | $1,794 |
| Total (2 units) | $3,526 | ||
UW: 25.0% down · 7.5% · 30yr · 1.5% tax · 5.0% vac · 8.0% maint · 8.0% mgmt
Financing live
Cash to close
- Down payment
- $52,475
- Closing costs
- $6,297
- Reserves months
- —
- Total cash needed
- —
Loan-product check · same deal, 3 products live
Conventional
25% down · 7.5% · 30yr
- Down + closing
- —
- Monthly P&I
- —
- Monthly cashflow
- —
- DSCR
- —
- Eligible?
- —
Personal DTI + credit; lowest rate.
DSCR
20% down · 8.5% · 30yr
- Down + closing
- —
- Monthly P&I
- —
- Monthly cashflow
- —
- DSCR
- —
- Eligible?
- —
No personal income docs; deal must DSCR.
Hard money
10% down · 12.0% · 12mo
- Down + closing
- —
- Monthly P&I
- —
- Monthly cashflow
- —
- DSCR
- —
- Eligible?
- —
Short-term bridge; refi at stabilization.
Rent comps 1 comps
| Address | Beds | Baths | Sqft | Rent | $/sqft | DOM | Units | Dist |
|---|---|---|---|---|---|---|---|---|
| 755 Scotland Rd Norwich, CT | 4.0 | 2.0 | 1600 | $2,650 | $1.66 | 44d | 1 | 1.26mi |
Listing history 11 events
-
2026-06-02status $209,900 Under Contract 44 DOM
-
2026-06-01days on market $209,900 Active 44 DOM
-
2026-05-31days on market $209,900 Active 43 DOM
-
2026-05-30days on market $209,900 Active 42 DOM
-
2026-05-28price $209,900
-
2026-05-27status Active
-
2026-05-19status Under Contract
-
2026-04-10$220,000 Active
-
2019-07-31soldstatus $32,500
-
2018-12-24historical
-
2018-10-27$41,900
ⓘ Source: listings_history table (triggers on properties + properties_extension) + one-shot
backfill from property_details.listing_events for pre-trigger history.
Tax reassessment forecast CT · Partial reset (capped growth)
- Current annual tax
- $4,266 · $356/mo
- Projected year-2 tax
- $4,379 · $365/mo
- Expected delta
- +$113/yr (+$9/mo · 2.6%)
ⓘ Screening estimate from a state-policy table — verify with the county assessor before closing.
Climate risk First Street
- Flood 2/10 Low FEMA zone AE · 7% chance over 30 yrs
- Wildfire 3/10 Moderate
- Heat 5/10 Major 7 d/yr ≥96°F today · 17 d/yr by 30 yrs out
- Wind 6/10 Major 59% chance of damaging wind over 30 yrs
- Air quality 3/10 Moderate 2 unhealthy d/yr today · 3 by 30 yrs out
Nearby sold comps map
Loading sold comps map…
Walkable amenities ~0.75 mi
Loading nearby amenities…
Taxation est. · year 1
- Rental income
- $42,312
- − Mortgage interest
- −$11,758
- − Property taxes
- −$4,266
- − Insurance
- −$6,574
- − Repairs & maintenance
- −$3,385
- − Management
- −$3,385
- − Depreciation
- −$6,106
- Taxable income
- $6,838
- Est. tax owed @ 24.0%
- −$1,641
- After-tax cash flow
- $7,736/yr
For passive investors: Depreciation is non-cash, so a rental often shows a tax loss while cash-flowing — sheltering income. Rental losses are passive: they offset passive income freely, and up to $25,000/yr can offset ordinary (W-2) income if you actively participate and your MAGI is under $100k (phasing out to $0 by $150k); unused losses carry forward. On sale, claimed depreciation is recaptured at up to 25%, and gains may owe capital-gains tax (a 1031 exchange can defer both). Figures are a year-1 estimate at your 24.0% rate — not tax advice; consult a CPA.
Schools (NCES district)
- District
- Sprague School District
- NCES district ID
- 0904260
- Math proficiency
- 25% ▼ -10.00%
- Reading proficiency
- 40% ▼ -5.00%
- Median HH income
- $64,156
- Composite
- 32.33/100
- National rank
- #10893
- State rank
- #170 of 192 in CT
Livability — Baltic
- Score
- 69/100
- State rank
- #104
- US rank
- #8958
Category grades
Schools grade is shown separately in the Schools card above.
Census & demographics
- Census place
- Baltic, CT
- Population (ZIP)
- 3,311
Population outlook (Southeastern Connecticut County) Hauer SSP2
- By 2040
- 293,442
Race, ethnicity, and origin ACS 2023
- Neighborhood character
- Predominantly White (74%)
- Race & ethnicity
- White 74% Two or more races 11% Hispanic / Latino 10% Black 4% Asian 3%
- Hispanic origin (detail)
- Puerto Rican 9%
- Common ancestry
- Lithuanian 11% Romanian 9% Slovak 4%
- Foreign-born
- 4% · China
- Languages at home
- 94% English-only · Spanish 2% Other Indo-European 1% Chinese 1%
Political lean MEDSL · Southeastern Connecticut
- 2024 margin
- D (+13.0) · D 55.6% · R 42.6% · Other 1.8%
- All cycles
- 2024: D+13.0
Not yet ingested
- Civics
- —
Market trends
- HPI YoY
- ▼ -29.75%
- Current HPI
- 211.7186
- Rent YoY
- —
- Metro
- —
- State GDP YoY
- ▲ 1.06%
- F500 in state
- 38
Industry mix (Fortune 500 HQ in CT)
| Industry | F500 HQs | Revenue |
|---|---|---|
| Industrial Machinery | 4 | $38B |
|
||
| Insurance | 3 | $71B |
|
||
| Financial Services | 2 | $25B |
|
||
| Transportation / Logistics | 2 | $18B |
|
||
| Healthcare | 1 | $247B |
|
||
| Telecommunications | 1 | $55B |
|
||
Price history
+401.0% since first listed7 events — show timeline
- 2026-05-28 Price Changed $209,900 Smart MLS
- 2026-05-27 Relisted — Smart MLS
- 2026-05-19 Pending — Smart MLS
- 2026-04-10 Listed $220,000 Smart MLS
- 2019-07-31 Sold (Public Records) $32,500 Public Records
- 2018-12-24 Listing Removed — Smart MLS
- 2018-10-27 Listed $41,900 Smart MLS
Property tax history
+5.1%/yrLatest (2023): $4,266 · +30.0% YoY. Source: county tax records.
Cash-flow waterfall
monthlySold comps — $/sqft
last 12 mo · ≤1 miLoading sold comps…