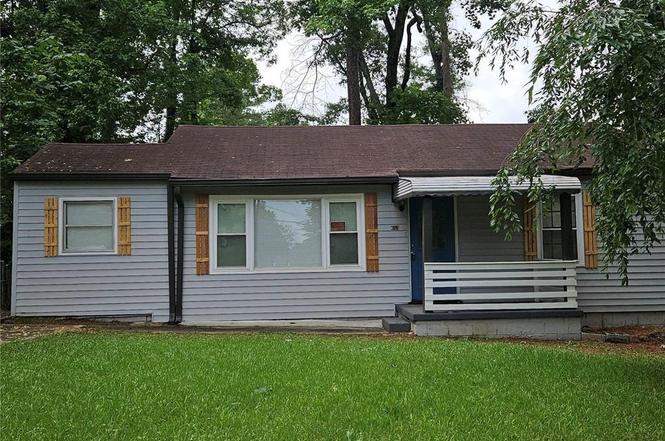
4153 Lindsey Dr · Candler-McAfee, GA
Flood risk 1/10 · Minimal
- FEMA flood zone
- X (unshaded)
- Chance of flooding over 30 yrs
- 0.0%
- Est. flood insurance / yr
- $507 – $1,088
Fire risk 3/10 · Minor
- Est. fire insurance / yr
- $963 – $1,789
Heat risk 5/10 · Moderate
- Hot days now (above 105°F)
- 7 days/yr
- Hot days in 30 yrs
- 18 days/yr
Wind risk 5/10 · Moderate
- Chance of severe wind over 30 yrs
- 26.0%
Air-quality risk 5/10 · Moderate
- Unhealthy air days now
- 7 days/yr
- Unhealthy air days in 30 yrs
- 10 days/yr
Risk factors via First Street. Map © Google.
Why this score? — see what drove the D grade
The composite is a weighted blend of 9 inputs, each scored 0–100. Each bar is that input's sub-score; the figure is the points it added to the 100-point composite (weight × sub-score).
- Cash flow +18.8/30.0
- DSCR +5.9/10.0
- ARV discount +4.7/15.0
- 1% rule +3.7/10.0
- Rent growth +2.7/5.0
- Livability +2.5/5.0
- Condition / age +2.5/5.0
- Schools +2.1/10.0
- Appreciation +0.0/10.0
$188,000
🖨 Deal sheet 📄 Offer letter ✓ Due diligence
Listing remarks MLS
Welcome to this beautiful 3 Bedroom, 1.5 bath one story ranch homesitting on almost HALF an acre! This cute home offers moderm style and comfort. This cute bungalow has moderm paint and LVP vinyl planks for style and comfort.The kitchen offers granite counter tops, stainless steel appliances making it ideal for cooking and entertaining. It has newer HVAC, water heater and many more. Outside has an oversized fenced back yard and patio great for outside gathering, pets and a spot to relax and unwind. Do not miss out on the opportunity to own this beautiful home with an EXTRA lot for more addition or maybe build another house!
Key facts
- Extra lot
- Granite counter tops
- Patio
Tags
Property features AI
Finance
- HOA & community: Association trash service included
Exterior
- Parking: Parking pad; Two total parking spaces
- Utilities: Public water; Public sewer; Sewer available; Electric service with 110V and 220V
- Home design: One level; Resale property
- Construction: Frame construction; Wood siding; Vinyl siding; Composition roof; Brick/mortar foundation; Built above grade finished area
- Exterior features: Garden; Private yard; Back yard fencing; Patio
Interior
- Kitchen: Eat-in kitchen; Breakfast room; Cabinets (other)
- Bedrooms: Three main-level bedrooms; Master on main; Split bedroom plan
- Flooring: Luxury vinyl; Hardwood
- Bathrooms: Two full bathrooms; Two main-level bathrooms; Master bath with tub/shower combo
- Heating & cooling: Central heating; Central air
- Interior features: Shutters on windows; No common walls; Other interior features
- Laundry & utility: Laundry located in bathroom and common area; Electric dryer hookup; Gas dryer hookup; Dryer included
Neighborhood map
What this means for you Summary
Snapshot
- This is a 2-bed/1.0-bath single-family listed at $188k.
Deal economics
- At list price, monthly cash flow is $189 ($2k/yr) — positive.
- The deal already cash-flows at list — no discount required.
- To meet the 1% rule (rent ≥ 1% of price), the offer needs to be $163k (13.4% below list).
- Recommended offer: $163k (13.4% below list) — sets the bar for 1% rule.
- Cap rate 7.5% vs local median 4.2% in Candler-McAfee — top-decile yield for the area; either an underpriced asset or a hidden risk that comps aren't pricing in. Stress-test before assuming the spread holds.
Location & tenants
- Location reads: area grade D — affects rentability + tenant quality, not the cash-flow math above.
- Dekalb County (suburban): math 19% / reading 28% proficiency, ranked #125 of 174 in GA (top 72%) — low school quality limits family demand, transient renter base, plan for 1-2y turnover; 68% free/reduced lunch — lower-income household profile, screen leases tightly.
- Zoned schools: Canby Lane Elementary School (math 8% / reading 17%, grade F, #1,032 of 1,228 statewide, top 85%, 461 students, 100% FRL); Mary Mcleod Bethune Middle School (math 4% / reading 13%, grade F, #439 of 470 statewide, top 94%, 718 students, 100% FRL); Towers High School (math 2% / reading 12%, grade F, #385 of 424 statewide, top 92%, 764 students, 100% FRL) — zoned schools average 100% FRL vs 68% district-wide (32 pts higher); higher-poverty schools than district average — tighter screening recommended.
- Zoned-school proficiency averages 9% at this address vs 24% district-wide (-14 pts) — the specific schools serving this property underperform the Dekalb County average; the district grade overstates school quality for this exact location.
- Market conditions: Rents flat; 180 active listings in the ZIP; 40 comparable units currently listed for rent nearby; rentals lingering (median 44d on market — plan ~5-8 weeks vacancy on turnover, expect pricing pressure); 78% of comp listings sitting > 30 days — soft ceiling on asking rent; 1,240 units permitted in DeKalb County in 2024 (385 in 5+ unit buildings).
Forward outlook
- Local home prices are declining (-3.0%/yr); year-one equity from $1k of loan paydown is wiped out by about $6k of value loss. Plan a longer hold.
- DeKalb County population projected at +28% by 2050 — long-run rental-demand tailwind backs the buy-and-hold thesis.
Negotiation context
- Only 7 days on market — expect competitive offers; lowballing is unlikely to land.
- 2 sale attempts with the ask held roughly flat each time — persistent listings suggest the price (not the market) is what's stuck; bring a comps-based counter.
- Current owner paid $85k; list at $188k implies a 121% gain — meaningful room to come down on a strong offer.
Risks & watch-outs
- Watch-outs: built in 1953 — expect roof / HVAC / electrical / plumbing capex.
- Climate carrying-cost: moderate wind risk, 26% chance of damaging wind over 30y; extreme-heat days projected 7→18/yr by 2055 (HVAC capex compounding) — expect insurance premiums to compound above CPI over the hold.
Questions for the listing agent
- Built in 1953 — when were the roof, HVAC, electrical panel, plumbing, and water heater last replaced?
- Is there a deadline driving the sale (1031 exchange, divorce, estate, relocation)? That informs how much negotiation room exists.
- The area grade is low — what's the realistic commute time and amenity access for the typical tenant pool here? Any planned neighborhood developments (good or bad) we should know about?
- What's the average days-on-market for RENTAL listings here right now (not sales)? A rising rental-DOM trend means longer vacancies and softer asking-rent achievability than the comps imply.
- What's the recent tenant-quality profile in this submarket — average credit score on applications, eviction rate, late-payment / NSF rate, and stable-employment percentage? A property-management company in the area should have these aggregated.
- How much new for-sale + rental construction is in the pipeline within 1–3 miles? Heavy new supply typically softens prices + rents 12–24 months out; constrained supply supports both.
Investment metrics
- 1% rule
- 0.87% ✗
- Cap rate
- 7.50%
- Cash-on-cash
- 4.32%
- DSCR
- 1.19
- GRM
- 9.6
CMA / ARV
- ARV (on-the-fly)
- $176,928
- Comps found
- 12
Show comp detail 12 sales within ~0.75 mi
| Address | Dist | Beds/Ba | Sqft | Sold | Price | $/sf | Match |
|---|---|---|---|---|---|---|---|
| 1906 Oak Valley Rd | 0.24mi | 2/1.0 | 1,170 (+0%) | 6mo | $140,000 | $120 | 83 |
| 4134 Hanes Dr | 0.05mi | 3/2.0 (+1) | 1,232 (+6%) | 0mo | $270,000 | $219 | 79 |
| 4083 Thetford Ct | 0.27mi | 3/1.5 (+1) | 1,125 (-3%) | 7mo | $170,000 | $151 | 69 |
| 4195 Hanes Dr | 0.20mi | 2/1.0 | 1,008 (-13%) | 1mo | $139,900 | $139 | 68 |
| 4125 Lindsey Dr | 0.08mi | 3/1.0 (+1) | 1,008 (-13%) | 6mo | $162,000 | $161 | 64 |
| 2416 Newgate Dr | 0.34mi | 3/2.0 (+1) | 1,266 (+9%) | 1mo | $173,000 | $137 | 59 |
| 4029 Moffat Ct | 0.62mi | 3/1.0 (+1) | 1,110 (-5%) | 2mo | $175,000 | $158 | 57 |
| 3932 Lindsey Dr | 0.41mi | 3/1.5 (+1) | 1,058 (-9%) | 5mo | $160,500 | $152 | 55 |
| 2419 Leslie Brook Dr | 0.39mi | 3/2.0 (+1) | 1,300 (+12%) | 2mo | $205,000 | $158 | 52 |
| 3972 Glenwood Downs Ln | 0.51mi | 3/2.0 (+1) | 1,259 (+8%) | 4mo | $180,000 | $143 | 50 |
| 2303 Wingfoot Pl | 0.72mi | 3/2.0 (+1) | 1,222 (+5%) | 4mo | $196,000 | $160 | 46 |
| 4439 Highland Rd | 0.73mi | 3/1.0 (+1) | 1,008 (-13%) | 4mo | $77,000 | $76 | 35 |
Match score weights: distance 35% · size 25% · config 20% · recency 20%. Top-matched comps best support the ARV.
Projected returns pro-forma
-3.0% appreciation · 0.87% rent growth · sell at horizon
- IRR
- -11.7%
- Equity multiple
- 0.58×
- Total profit
- $-21,915
- Equity at exit
- $28,031
- IRR
- -5.6%
- Equity multiple
- 0.67×
- Total profit
- $-17,386
- Equity at exit
- $16,255
Cash invested: $52,640 (down + closing). Projections, not guarantees.
Landlord ↔ Tenant lean methodology
- Overall (STATE)
- 90 Strongly Landlord-Friendly
- State Georgia
- 90 Strongly Landlord-Friendly · R+3
- County
- — inherits STATE
- City
- — inherits STATE
ZIP-level market 30035
- Home prices YoY
- -33.8%
- Rents YoY
- 0.9%
- Active inventory
- 180
- Price-to-rent
- 9.6×
Monthly cashflow live
- Estimated rent
- $1,628 high interval (Pro) →
- Mortgage (P&I)
- −$986
- Tax from tax record
- −$33 /mo · $392/yr
- Insurance
- −$78
- HOA
- −$0
- Vacancy / Maint / Mgmt
- −$342
- Net cashflow
- $189
Break-even live
UW: 25.0% down · 7.5% · 30yr · 1.5% tax · 5.0% vac · 8.0% maint · 8.0% mgmt
Financing live
Cash to close
- Down payment
- $47,000
- Closing costs
- $5,640
- Reserves months
- —
- Total cash needed
- —
Loan-product check · same deal, 3 products live
Conventional
25% down · 7.5% · 30yr
- Down + closing
- —
- Monthly P&I
- —
- Monthly cashflow
- —
- DSCR
- —
- Eligible?
- —
Personal DTI + credit; lowest rate.
DSCR
20% down · 8.5% · 30yr
- Down + closing
- —
- Monthly P&I
- —
- Monthly cashflow
- —
- DSCR
- —
- Eligible?
- —
No personal income docs; deal must DSCR.
Hard money
10% down · 12.0% · 12mo
- Down + closing
- —
- Monthly P&I
- —
- Monthly cashflow
- —
- DSCR
- —
- Eligible?
- —
Short-term bridge; refi at stabilization.
Rent comps 40 comps
| Address | Beds | Baths | Sqft | Rent | $/sqft | DOM | Units | Dist |
|---|---|---|---|---|---|---|---|---|
| 4066 Marble Arch Ct Decatur, GA | 3.0 | 2.0 | 1344 | $1,800 | $1.34 | 43d | 1 | 0.30mi |
| 4869 Covington Hwy Unit 1 Decatur, GA | 1.0 | 1.0 | 1000 | $1,800 | $1.80 | 20d | 1 | 0.34mi |
| 2161 Bedevere Cir Unit 2161A Decatur, GA | 2.0 | 2.0 | 1144 | $1,400 | $1.22 | 43d | 1 | 0.38mi |
| 3000 Bedevere Cir Unit 3000F Decatur, GA | 2.0 | 2.0 | 1144 | $1,400 | $1.22 | 43d | 1 | 0.41mi |
| 3010 Bedevere Cir Unit 3010A Decatur, GA | 2.0 | 2.0 | 1144 | $1,400 | $1.22 | 43d | 1 | 0.43mi |
| 3014 Bedevere Cir Unit 3014D Decatur, GA | 2.0 | 2.0 | 1144 | $1,400 | $1.22 | 43d | 1 | 0.44mi |
| 3021 Arthurs Ct Unit 3021 Decatur, GA | 3.0 | 2.0 | 1493 | $1,600 | $1.07 | 43d | 1 | 0.49mi |
| 3017 Arthurs Ct Unit 3017 Decatur, GA | 3.0 | 2.0 | 1493 | $1,600 | $1.07 | 43d | 1 | 0.49mi |
| 3023 Arthurs Ct Unit 3023 Decatur, GA | 3.0 | 2.0 | 1493 | $1,600 | $1.07 | 43d | 1 | 0.49mi |
| 3025 Arthurs Ct Unit 3025 Decatur, GA | 3.0 | 2.0 | 1493 | $1,600 | $1.07 | 43d | 1 | 0.49mi |
| 3019 Arthurs Ct Unit 3019 Decatur, GA | 3.0 | 2.0 | 1493 | $1,600 | $1.07 | 43d | 1 | 0.49mi |
| 3015 Arthurs Ct Unit 3015 Decatur, GA | 3.0 | 2.0 | 1493 | $1,600 | $1.07 | 43d | 1 | 0.49mi |
| 2011 Bodwin Pl Unit 2011 Decatur, GA | 3.0 | 2.0 | 1493 | $1,600 | $1.07 | 43d | 1 | 0.54mi |
| 2163 Bodwin Pl Unit 2163D Decatur, GA | 2.0 | 2.0 | 1144 | $1,400 | $1.22 | 43d | 1 | 0.54mi |
| 2007 Bodwin Pl Unit 2007 Decatur, GA | 3.0 | 2.0 | 1493 | $1,600 | $1.07 | 43d | 1 | 0.54mi |
| 2165 Bodwin Pl Unit 2165E Decatur, GA | 2.0 | 2.0 | 1144 | $1,400 | $1.22 | 43d | 1 | 0.54mi |
| 1802 Lee St Decatur, GA | 3.0 | 1.0 | 912 | $1,350 | $1.48 | 43d | 1 | 0.54mi |
| 1914 Bodwin Pl Unit 1914A Decatur, GA | 2.0 | 2.0 | 1298 | $1,450 | $1.12 | 43d | 1 | 0.56mi |
| 1998 Arthurs Court Dr Unit 1998 Decatur, GA | 3.0 | 2.0 | 1493 | $1,600 | $1.07 | 43d | 1 | 0.57mi |
| 1998 Arthurs Court Dr Decatur, GA | 3.0 | 2.0 | 1493 | $1,600 | $1.07 | 43d | 1 | 0.57mi |
| 1985 Glenwood Downs Dr Decatur, GA | 3.0 | 2.5 | 1460 | $1,700 | $1.16 | 20d | 1 | 0.57mi |
| 2002 Arthurs Court Dr Unit 2002D Decatur, GA | 2.0 | 2.0 | 1144 | $1,400 | $1.22 | 43d | 1 | 0.57mi |
| 1910 Bodwin Pl Unit 1910C Decatur, GA | 2.0 | 2.0 | 1298 | $1,450 | $1.12 | 43d | 1 | 0.59mi |
| 1771 Ledo Ave Decatur, GA | 2.0 | 1.0 | 912 | $1,295 | $1.42 | 43d | 1 | 0.60mi |
| 1908 Bodwin Pl Unit 1908F Decatur, GA | 2.0 | 2.0 | 1144 | $1,400 | $1.22 | 43d | 1 | 0.61mi |
| 4655 Glenwood Rd Decatur, GA | 2.0–3.0 | 2.0 | 1318 | $1,250 | $0.95 | 19d | 31 | 0.64mi |
| 1905 Bodwin Pl Unit 1905 Decatur, GA | 3.0 | 2.0 | 1493 | $1,600 | $1.07 | 43d | 1 | 0.65mi |
| 4433 Highland Rd Decatur, GA | 3.0 | 1.0 | 864 | $1,450 | $1.68 | 43d | 1 | 0.69mi |
| 4225 Wingfoot Ct Decatur, GA | 2.0 | 2.0 | 1120 | $1,600 | $1.43 | 24d | 1 | 0.76mi |
| 2347 Greenway Dr Decatur, GA | 3.0 | 2.0 | 1200 | $1,975 | $1.65 | 24d | 1 | 0.78mi |
| 4010 Emerald Lake Dr Decatur, GA | 2.0 | 2.0 | 1177 | $1,500 | $1.27 | 43d | 1 | 0.84mi |
| 4565 Covington Hwy Decatur, GA | 2.0–3.0 | 1.5 | 1200 | $1,250 | $1.04 | 3d | 8 | 0.85mi |
| 3854 Austin Park Ln Decatur, GA | 3.0 | 2.5 | 1464 | $1,800 | $1.23 | 43d | 1 | 0.95mi |
| 2023 Austin Park Cir Decatur, GA | 1.0 | 1.0 | 1464 | $595 | $0.41 | 43d | 1 | 1.03mi |
| 1590 Agape Way Decatur, GA | 1.0–3.0 | 1.0–2.0 | 1022 | $1,270 | $1.24 | 43d | 1 | 1.07mi |
| 200 High Court Pl Decatur, GA | 1.0–3.0 | 1.0–2.0 | 1130 | $1,498 | $1.33 | 2d | 12 | 1.08mi |
| 3141 Journal Ct Decatur, GA | 3.0 | 2.5 | 1386 | $1,895 | $1.37 | 12d | 1 | 1.13mi |
| 4612 Grand Central Pkwy Decatur, GA | 2.0 | 2.5 | 1328 | $2,100 | $1.58 | 24d | 1 | 1.21mi |
| 3711 Daisy Dr Decatur, GA | 3.0 | 1.5 | 1240 | $1,700 | $1.37 | 43d | 1 | 1.24mi |
| 3692 Larkspur Ter Decatur, GA | 3.0 | 2.0 | 1100 | $1,700 | $1.55 | 43d | 1 | 1.26mi |
Listing history 6 events
-
2026-06-18days on market $188,000 Active 7 DOM
-
2026-06-17days on market $188,000 Active 6 DOM
-
2026-06-16days on market $188,000 Active 5 DOM
-
2026-06-15days on market $188,000 Active 4 DOM
-
2026-06-13remarks 655-char remark
-
2026-06-13$188,000 Active 2 DOM
ⓘ Source: listings_history table (triggers on properties + properties_extension) + one-shot
backfill from property_details.listing_events for pre-trigger history.
Tax reassessment forecast GA · Resets to sale price
- Current annual tax
- $392 · $33/mo
- Projected year-2 tax
- $1,730 · $144/mo
- Expected delta
- +$1,338/yr (+$111/mo · 341.6%)
ⓘ Screening estimate from a state-policy table — verify with the county assessor before closing.
Climate risk First Street
- Flood 1/10 Low FEMA zone X (unshaded) · 0% chance over 30 yrs
- Wildfire 3/10 Moderate
- Heat 5/10 Major 7 d/yr ≥105°F today · 18 d/yr by 30 yrs out
- Wind 5/10 Major 26% chance of damaging wind over 30 yrs
- Air quality 5/10 Major 7 unhealthy d/yr today · 10 by 30 yrs out
Nearby sold comps map
Loading sold comps map…
Walkable amenities ~0.75 mi
Loading nearby amenities…
Taxation est. · year 1
- Rental income
- $19,539
- − Mortgage interest
- −$10,531
- − Property taxes
- −$392
- − Insurance
- −$940
- − Repairs & maintenance
- −$1,563
- − Management
- −$1,563
- − Depreciation
- −$5,469
- Taxable loss
- −$919
- Est. tax savings @ 24.0%
- +$221
- After-tax cash flow
- $2,494/yr
For passive investors: Depreciation is non-cash, so a rental often shows a tax loss while cash-flowing — sheltering income. Rental losses are passive: they offset passive income freely, and up to $25,000/yr can offset ordinary (W-2) income if you actively participate and your MAGI is under $100k (phasing out to $0 by $150k); unused losses carry forward. On sale, claimed depreciation is recaptured at up to 25%, and gains may owe capital-gains tax (a 1031 exchange can defer both). Figures are a year-1 estimate at your 24.0% rate — not tax advice; consult a CPA.
Schools (NCES district)
- District
- Dekalb County
- NCES district ID
- 1301740
- Math proficiency
- 19% ▼ -12.00%
- Reading proficiency
- 28% ▼ -7.00%
- Median HH income
- $51,448
- Composite
- 20.92/100
- National rank
- #8482
- State rank
- #125 of 174 in GA
Livability — Candler-McAfee
No livability data for this city. (Only ~50 U.S. cities are tracked.)
Census & demographics
- County
- Dekalb County · 782,738 people
- Metro
- Atlanta-Sandy Springs-Alpharetta, GA
- Population (ZIP)
- 21,569
- Household income
- $66,799
- Rent vs Own
- Severe rent burden
- 1304.0
Population outlook (DeKalb County) Hauer SSP2
- Today (2025)
- 839,977 people
- By 2030
- 891,768 · +6.2%
- By 2040
- 988,894 · +17.7%
- By 2050
- 1,074,583 · +27.9%
- By 2075
- 1,245,026 · +48.2%
- By 2100
- 1,303,135 · +55.1%
Race, ethnicity, and origin ACS 2023
- Neighborhood character
- Predominantly Black (91%)
- Race & ethnicity
- Black 91% White 4% Hispanic / Latino 4% Two or more races 3%
- Common ancestry
- Italian 1% Swiss 0%
- Foreign-born
- 12% · Canada, Jamaica
- Languages at home
- 86% English-only · Spanish 4% French/Haitian/Cajun 2%
Political lean MEDSL · DeKalb
- 2024 margin
- Solid D (+64.8) · D 81.9% · R 17.1% · Other 1.0%
- 2008→2024 swing
- +6.1pp toward D · 2008: 58.6pp · 2024: 64.8pp
- All cycles
- 2024: D+64.8 2020: D+67.4 2016: D+64.8 2012: D+56.8 2008: D+58.6
Not yet ingested
- Civics
- —
Market trends
- HPI YoY
- ▼ -111.60%
- Current HPI
- 218.8323
- Rent YoY
- ▲ 0.87%
- Metro
- Atlanta-Sandy Springs-Alpharetta, GA
- State GDP YoY
- ▲ 2.66%
- F500 in state
- 28
Industry mix (Fortune 500 HQ in GA)
| Industry | F500 HQs | Revenue |
|---|---|---|
| Paper / Packaging | 2 | $29B |
|
||
| Retail | 1 | $160B |
|
||
| Transportation / Logistics | 1 | $91B |
|
||
| Airlines | 1 | $62B |
|
||
| Consumer Goods | 1 | $47B |
|
||
| Utilities | 1 | $25B |
|
||
Price history
+121.2% since first listed3 events — show timeline
- 2026-06-11 Listed $188,000 GAMLS
- 2026-06-11 Listed $188,000 FMLS
- 2000-08-18 Sold (Public Records) $85,000 Public Records
Property tax history
-5.8%/yrLatest (2024): $392 · +100.5% YoY. Source: county tax records.
Cash-flow waterfall
monthlySold comps — $/sqft
last 12 mo · ≤1 miLoading sold comps…