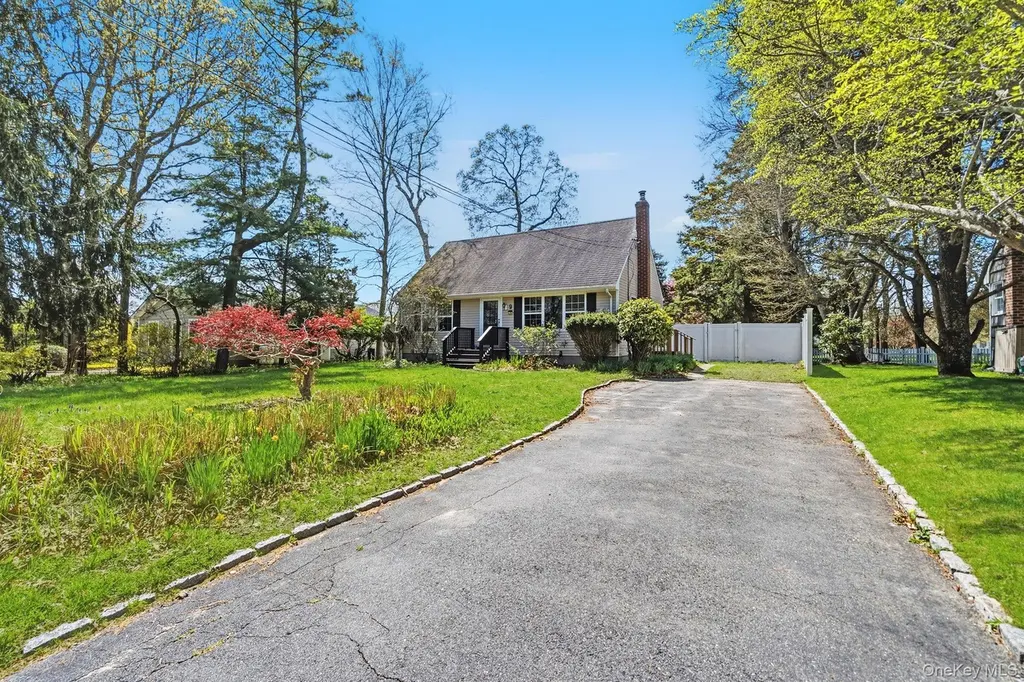
9 White Birch Ln · Remsenburg-Speonk, NY
Flood risk 1/10 · Minimal
- FEMA flood zone
- X (unshaded)
- Chance of flooding over 30 yrs
- 0.0%
- Est. flood insurance / yr
- $473 – $860
Fire risk 1/10 · Minimal
- Est. fire insurance / yr
- $691 – $1,283
Heat risk 4/10 · Minor
- Hot days now (above 90°F)
- 7 days/yr
- Hot days in 30 yrs
- 19 days/yr
Wind risk 8/10 · Major
- Chance of severe wind over 30 yrs
- 80.0%
Air-quality risk 4/10 · Minor
- Unhealthy air days now
- 4 days/yr
- Unhealthy air days in 30 yrs
- 5 days/yr
Risk factors via First Street. Map © Google.
Why this score? — see what drove the A grade
The composite is a weighted blend of 9 inputs, each scored 0–100. Each bar is that input's sub-score; the figure is the points it added to the 100-point composite (weight × sub-score).
- Cash flow +30.0/30.0
- ARV discount +15.0/15.0
- 1% rule +10.0/10.0
- DSCR +10.0/10.0
- Appreciation +8.9/10.0
- Schools +4.8/10.0
- Condition / age +3.8/5.0
- Rent growth +2.5/5.0
- Livability +2.5/5.0
$729,000
🖨 Deal sheet (PDF) 📄 Offer letter ✓ Due diligence
Listing remarks
Nestled in charming Remsenburg on a . 21-acre lot, this 3-4 bedroom, one-and-a-half-bath home offers a great opportunity to bring your vision and personal touch. Step through the front door into the living room featuring original hardwood flooring, which flows into the welcoming eat-in kitchen. The main floor also offers a full bath, one bedroom, and a family room with sliding doors leading to the fenced-in backyard. Upstairs, you’ll find two additional bedrooms and a half bath, with room to create a full bath. Selling as-is. The home features oil heat, 150-amp electrical service, and an unfinished basement. Plus, the fenced-in yard offers privacy. Located in the Remsenburg-Speonk Sch
Key facts
- Unfinished basement
- Fenced-in backyard
- 9,148 sq ft lot
Tags
Property features AI
Exterior
- Parking: Driveway parking for 3 vehicles
- Utilities: Electricity connected (PSEG); Water connected; Cesspool sewer
- Home design: Single family residence; Two levels
- Construction: Frame construction
- Exterior features: Back yard fencing; Not waterfront
Interior
- Kitchen: Range; Dishwasher; Refrigerator
- Bedrooms: Two-level home (bedrooms on main levels)
- Flooring: Carpet; Wood; Vinyl; Other
- Bathrooms: 1 full bathroom; 1 half bathroom
- Heating & cooling: Oil heating; No central air
- Interior features: First-floor bedroom; First-floor full bathroom; Unfinished basement
- Laundry & utility: Washer; Dryer; Tankless water heater
Neighborhood map
What this means for you Summary
Snapshot
- This is a 3-bed/1.5-bath single-family listed at $729k. Condition is rated good.
Deal economics
- At list price, monthly cash flow is $6k ($77k/yr) — positive.
- The deal already cash-flows at list — no discount required.
- Meets the 1% rule at list price ($14k rent vs $729k).
- Recommended offer: $718k (1.5% below list) — sets the bar for market timing.
- Cap rate 16.8% vs local median 6.1% in Remsenburg-Speonk — top-decile yield for the area; either an underpriced asset or a hidden risk that comps aren't pricing in. Stress-test before assuming the spread holds.
Location & tenants
- Location reads: area grade A — affects rentability + tenant quality, not the cash-flow math above.
- Remsenburg-Speonk Union Free School District (suburban): math 60% / reading 40% proficiency, ranked #389 of 755 in NY (top 52%) — acceptable for families but not a draw, mixed tenant base, ~2y average lease; only 10% free/reduced lunch — higher-income household profile.
- Zoned schools: Remsenburg-Speonk Elementary School (math 52% / reading 62%, grade C+, #842 of 2,108 statewide, top 43%, 122 students, 36% FRL) — zoned schools average 36% FRL vs 10% district-wide (27 pts higher); higher-poverty schools than district average — tighter screening recommended.
- Market conditions: 41 active listings in the ZIP; 3 comparable units currently listed for rent nearby; rentals at typical pace (median 26d on market — plan ~3-4 weeks tenant-placement turnaround); 1,366 units permitted in Suffolk County in 2024 (216 in 5+ unit buildings).
Forward outlook
- In year one you build about $62k of equity ($5k loan paydown + $57k appreciation (7.8% local appreciation)).
- Suffolk County population projected to shrink 5% by 2050 — rents likely to lag national; underwrite the cash flow, not the appreciation.
- At projected returns (7.8% appreciation + 3.0% rent growth), your $204k cash investment doubles in ~2 years — after that, you're playing with house money.
- By year 2, paydown + projected appreciation supports a ~$99k cash-out refi (75% LTV) — recoverable capital for the next deal without selling this one.
Negotiation context
- It's been on market 20 days — a 2% lower offer ($718k) is reasonable based on typical stale-listing flexibility.
Risks & watch-outs
- Climate carrying-cost: severe wind risk, 80% chance of damaging wind over 30y — expect insurance premiums to compound above CPI over the hold.
Questions for the listing agent
- Built in 1965 — when were the roof, HVAC, electrical panel, plumbing, and water heater last replaced?
- Is there a deadline driving the sale (1031 exchange, divorce, estate, relocation)? That informs how much negotiation room exists.
- What's the average days-on-market for RENTAL listings here right now (not sales)? A rising rental-DOM trend means longer vacancies and softer asking-rent achievability than the comps imply.
- What's the recent tenant-quality profile in this submarket — average credit score on applications, eviction rate, late-payment / NSF rate, and stable-employment percentage? A property-management company in the area should have these aggregated.
- How much new for-sale + rental construction is in the pipeline within 1–3 miles? Heavy new supply typically softens prices + rents 12–24 months out; constrained supply supports both.
Investment metrics
- 1% rule
- 1.98% ✓
- Cap rate
- 16.81%
- Cash-on-cash
- 37.55%
- DSCR
- 2.67
- GRM
- 4.2
CMA / ARV
- ARV (median comp)
- $1,053,734
- List price
- $729,000
- Delta
- -30.82%
- Verdict
- UNDERPRICED
- Comps
- 20 within 1.0 mi
Show comp detail 4 sales within ~0.75 mi
| Address | Dist | Beds/Ba | Sqft | Sold | Price | $/sf | Match |
|---|---|---|---|---|---|---|---|
| 15 Crest Dr | 0.08mi | 3/2.0 | 1,600 (+9%) | 7mo | $613,500 | $383 | 74 |
| 17 Heather Dr | 0.06mi | 3/2.5 | 1,650 (+12%) | 1mo | $1,350,000 | $818 | 72 |
| 29 Halsey Rd | 0.53mi | 3/2.0 | 1,480 (+1%) | 16mo | $705,000 | $476 | 59 |
| 57 Halsey Rd | 0.72mi | 2/2.0 (-1) | 1,300 (-12%) | 18mo | $800,000 | $615 | 25 |
Match score weights: distance 35% · size 25% · config 20% · recency 20%. Top-matched comps best support the ARV.
Projected returns pro-forma
7.81% appreciation · 3.0% rent growth · sell at horizon
- IRR
- 50.1%
- Equity multiple
- 4.42×
- Total profit
- $698,435
- Equity at exit
- $544,376
- IRR
- 45.5%
- Equity multiple
- 9.45×
- Total profit
- $1,724,408
- Equity at exit
- $1,071,677
Cash invested: $204,120 (down + closing). Projections, not guarantees.
Landlord ↔ Tenant lean methodology
- Overall (STATE)
- 15 Strongly Tenant-Friendly
- State New York
- 15 Strongly Tenant-Friendly · D+10
- County
- — inherits STATE
- City
- — inherits STATE
ZIP-level market 11960
- Home prices YoY
- 2.1%
- Active inventory
- 41
- Price-to-rent
- 4.2×
Monthly cashflow live
- Estimated rent
- $14,462 medium interval (Pro) →
- Mortgage (P&I)
- −$3,823
- Tax est. 1.5%
- −$911 /mo · $10,935/yr
- Insurance
- −$304
- HOA
- −$0
- Vacancy / Maint / Mgmt
- −$3,037
- Net cashflow
- $6,387
Break-even live
Sensitivity live
| Price | -10% $6,891 | -5% $6,639 | +0% $6,387 | +5% $6,135 | +10% $5,883 |
|---|---|---|---|---|---|
| Rent | -10% $5,245 | -5% $5,816 | +0% $6,387 | +5% $6,958 | +10% $7,530 |
| Rate | -1.0pp $6,754 | -0.5pp $6,573 | base $6,387 | +0.5pp $6,198 | +1.0pp $6,006 |
UW: 25.0% down · 7.5% · 30yr · 1.5% tax · 5.0% vac · 8.0% maint · 8.0% mgmt
Financing live
Cash to close
- Down payment
- $182,250
- Closing costs
- $21,870
- Reserves months
- —
- Total cash needed
- —
Loan-product check · same deal, 3 products live
Conventional
25% down · 7.5% · 30yr
- Down + closing
- —
- Monthly P&I
- —
- Monthly cashflow
- —
- DSCR
- —
- Eligible?
- —
Personal DTI + credit; lowest rate.
DSCR
20% down · 8.5% · 30yr
- Down + closing
- —
- Monthly P&I
- —
- Monthly cashflow
- —
- DSCR
- —
- Eligible?
- —
No personal income docs; deal must DSCR.
Hard money
10% down · 12.0% · 12mo
- Down + closing
- —
- Monthly P&I
- —
- Monthly cashflow
- —
- DSCR
- —
- Eligible?
- —
Short-term bridge; refi at stabilization.
Rent comps 3 comps
| Address | Beds | Baths | Sqft | Rent | $/sqft | DOM | Units | Dist |
|---|---|---|---|---|---|---|---|---|
| 70 Jagger Ln Westhampton, NY | 3.0 | 2.0 | 1850 | $20,000 | $10.81 | 0d | 1 | 0.65mi |
| 21 Summit Blvd Westhampton, NY | 2.0 | 2.0 | 1200 | $15,000 | $12.50 | 44d | 1 | 1.24mi |
| 152 Old Country Rd Westhampton, NY | 2.0 | 1.0 | 1200 | $3,500 | $2.92 | 25d | 1 | 1.26mi |
Listing history 7 events
-
2026-06-07status $729,000 Pending 20 DOM
-
2026-06-04days on market $729,000 Active 20 DOM
-
2026-06-03days on market $729,000 Active 19 DOM
-
2026-06-02days on market $729,000 Active 18 DOM
-
2026-06-01days on market $729,000 Active 17 DOM
-
2026-05-31days on market $729,000 Active 16 DOM
-
2026-05-15$729,000 Active 942-char remark
ⓘ Source: listings_history table (triggers on properties + properties_extension) + one-shot
backfill from property_details.listing_events for pre-trigger history.
Climate risk First Street
- Flood 1/10 Low FEMA zone X (unshaded) · 0% chance over 30 yrs
- Wildfire 1/10 Low
- Heat 4/10 Moderate 7 d/yr ≥90°F today · 19 d/yr by 30 yrs out
- Wind 8/10 Severe 80% chance of damaging wind over 30 yrs
- Air quality 4/10 Moderate 4 unhealthy d/yr today · 5 by 30 yrs out
Nearby sold comps map
Loading sold comps map…
Walkable amenities ~0.75 mi
Loading nearby amenities…
Taxation est. · year 1
- Rental income
- $173,547
- − Mortgage interest
- −$40,835
- − Property taxes
- −$10,935
- − Insurance
- −$3,645
- − Repairs & maintenance
- −$13,884
- − Management
- −$13,884
- − Depreciation
- −$21,207
- Taxable income
- $69,157
- Est. tax owed @ 24.0%
- −$16,598
- After-tax cash flow
- $60,049/yr
For passive investors: Depreciation is non-cash, so a rental often shows a tax loss while cash-flowing — sheltering income. Rental losses are passive: they offset passive income freely, and up to $25,000/yr can offset ordinary (W-2) income if you actively participate and your MAGI is under $100k (phasing out to $0 by $150k); unused losses carry forward. On sale, claimed depreciation is recaptured at up to 25%, and gains may owe capital-gains tax (a 1031 exchange can defer both). Figures are a year-1 estimate at your 24.0% rate — not tax advice; consult a CPA.
Condition & rehab AI · 20 photos
This charming 3-bedroom home is in good condition with a good condition score of 75. It offers a great opportunity to bring your vision and personal touch. The home is move-in ready with minor cosmetic updates that would significantly increase its resale and rental value.
Value-add opportunities
- Resale Paint exterior — Enhances curb appeal and home value
- Both Replace windows — Improves energy efficiency and aesthetics
- Resale Update kitchen backsplash — Modernizes kitchen and adds value
- Both Install smart home devices — Enhances comfort and energy efficiency
Renovation cost estimate screening
Value-add ROI direction
- Resale Paint exterior — Enhances curb appeal and home value ↑
- Both Replace windows — Improves energy efficiency and aesthetics ↑
- Resale Update kitchen backsplash — Modernizes kitchen and adds value ↑
- Both Install smart home devices — Enhances comfort and energy efficiency ↑
ⓘ Cost ranges are severity-bucket heuristics (US national rule-of-thumb). Get contractor quotes + a written scope before underwriting a rehab budget.
Schools (NCES district)
- District
- Remsenburg-Speonk Union Free School District
- NCES district ID
- 3624420
- Math proficiency
- 60% ▲ 10.00%
- Reading proficiency
- 40% ▼ -10.00%
- Median HH income
- $79,972
- Composite
- 47.7/100
- National rank
- #4915
- State rank
- #389 of 755 in NY
Livability — Remsenburg-Speonk
No livability data for this city. (Only ~50 U.S. cities are tracked.)
Census & demographics
- Census place
- Remsenburg-Speonk, NY
- City population
- 1,346
- Population (ZIP)
- 1,037
Population outlook (Suffolk County) Hauer SSP2
- Today (2025)
- 1,505,262 people
- By 2030
- 1,498,318 · -0.5%
- By 2040
- 1,471,101 · -2.3%
- By 2050
- 1,424,848 · -5.3%
- By 2075
- 1,337,157 · -11.2%
- By 2100
- 1,217,720 · -19.1%
Race, ethnicity, and origin ACS 2023
- Neighborhood character
- Predominantly White (100%)
- Race & ethnicity
- White 100%
- Common ancestry
- Iranian 9% Romanian 8% Scotch-Irish 1%
- Foreign-born
- 3%
Political lean MEDSL · Suffolk
- 2024 margin
- Lean R (+10.0) · D 45.0% · R 55.0%
- 2008→2024 swing
- -16.0pp toward R · 2008: 6.0pp · 2024: -10.0pp
- All cycles
- 2024: R+10.0 2020: R+0.0 2016: R+8.2 2012: D+2.9 2008: D+6.0
Not yet ingested
- Civics
- —
Market trends
- HPI YoY
- ▲ 7.81%
- Current HPI
- 386.454
- Rent YoY
- —
- Metro
- —
- State GDP YoY
- ▲ 2.60%
- F500 in state
- 92
Industry mix (Fortune 500 HQ in NY)
| Industry | F500 HQs | Revenue |
|---|---|---|
| Financial Services | 10 | $950B |
|
||
| Consumer Goods | 9 | $162B |
|
||
| Insurance | 4 | $225B |
|
||
| Telecommunications | 2 | $144B |
|
||
| Pharmaceuticals | 2 | $112B |
|
||
| Media / Entertainment | 2 | $69B |
|
||
Price history
2 events — show timeline
- 2026-06-04 Pending — OneKey® MLS as Distributed by MLS Grid
- 2026-05-15 Listed $729,000 OneKey® MLS as Distributed by MLS Grid
Cash-flow waterfall
monthlySold comps — $/sqft
last 12 mo · ≤1 miLoading sold comps…