8875 Tanglewood Trl · Grand Haven, MI
Flood risk No data
- FEMA flood zone
- —
- Chance of flooding over 30 yrs
- —
- Est. flood insurance / yr
- —
Fire risk No data
- Est. fire insurance / yr
- —
Heat risk No data
- Hot days now (above threshold)
- —
- Hot days in 30 yrs
- —
Wind risk No data
- Chance of severe wind over 30 yrs
- —
Air-quality risk No data
- Unhealthy air days now
- —
- Unhealthy air days in 30 yrs
- —
Risk factors via First Street. Map © Google.
Why this score? — see what drove the B grade
The composite is a weighted blend of 9 inputs, each scored 0–100. Each bar is that input's sub-score; the figure is the points it added to the 100-point composite (weight × sub-score).
- Cash flow +30.0/30.0
- 1% rule +10.0/10.0
- DSCR +10.0/10.0
- ARV discount +7.5/15.0
- Livability +4.0/5.0
- Schools +3.9/10.0
- Condition / age +3.8/5.0
- Rent growth +2.5/5.0
- Appreciation +0.0/10.0
$120,999
🖨 Deal sheet 📄 Offer letter ✓ Due diligence
Listing remarks MLS
Welcome to this newly available 4-bedroom, 2-bathroom residence designed for comfortable and convenient living. This home features a bright, open floor plan, modern appliances, and access to the community's many amenities. It?s an ideal opportunity to find an affordable and charming place to call your own. Contact Christy today to schedule a showing! * All photos and renderings shown are for illustration purposes only. Actual home may vary.
Key facts
- Built 2026
- Listed 52 days
Neighborhood map
What this means for you Summary
Snapshot
- This is a 4-bed/2.0-bath manufactured listed at $121k. Condition is rated good.
Deal economics
- At list price, monthly cash flow is $811 ($10k/yr) — positive.
- The deal already cash-flows at list — no discount required.
- Meets the 1% rule at list price ($2k rent vs $121k).
- Recommended offer: $117k (3.0% below list) — sets the bar for market timing.
- Cap rate 14.3% vs local median 1.8% in Grand Haven — top-decile yield for the area; either an underpriced asset or a hidden risk that comps aren't pricing in. Stress-test before assuming the spread holds.
Location & tenants
- Location reads 81/100 on livability (#69 in MI, #1,467 nationally) — a professional / high-income tenant draw. Strengths: schools A+, cost of living A+, housing A+; Watch: employment C-, commute F.
- West Ottawa Public School District (suburban): math 37% / reading 52% proficiency, ranked #140 of 540 in MI (top 26%) — families likely to look elsewhere, expect single-tenant / working-renter base with shorter leases.
- Market conditions: 62 active listings in the ZIP; 2 comparable units currently listed for rent nearby; 1,237 units permitted in Ottawa County in 2024 (443 in 5+ unit buildings).
Forward outlook
- Local home prices are declining (-3.0%/yr); year-one equity from $836 of loan paydown is wiped out by about $4k of value loss. Plan a longer hold.
- Ottawa County population projected at +24% by 2050 — long-run rental-demand tailwind backs the buy-and-hold thesis.
- At projected returns (-3.0% appreciation + 3.0% rent growth), your $34k cash investment doubles in ~5 years — after that, you're playing with house money.
Negotiation context
- It's been on market 53 days — a 3% lower offer ($117k) is reasonable based on typical stale-listing flexibility.
- 2 sale attempts with the ask held roughly flat each time — persistent listings suggest the price (not the market) is what's stuck; bring a comps-based counter.
Questions for the listing agent
- It's been on market 53 days. Have you received any prior offers? Is the seller open to a 3% concession, seller financing, or rate buy-down credit?
- Is there a deadline driving the sale (1031 exchange, divorce, estate, relocation)? That informs how much negotiation room exists.
- Schools are A-rated — typically a magnet for longer-tenancy family renters. What's the average tenant stay here, and is there a school-zone premium baked into asking?
- What's the average days-on-market for RENTAL listings here right now (not sales)? A rising rental-DOM trend means longer vacancies and softer asking-rent achievability than the comps imply.
- What's the recent tenant-quality profile in this submarket — average credit score on applications, eviction rate, late-payment / NSF rate, and stable-employment percentage? A property-management company in the area should have these aggregated.
- How much new for-sale + rental construction is in the pipeline within 1–3 miles? Heavy new supply typically softens prices + rents 12–24 months out; constrained supply supports both.
Investment metrics
- 1% rule
- 1.72% ✓
- Cap rate
- 14.34%
- Cash-on-cash
- 28.73%
- DSCR
- 2.28
- GRM
- 4.8
CMA / ARV
- ARV (median comp)
- $80,000
- List price
- $120,999
- Delta
- 51.25%
- Verdict
- OVERPRICED
- Comps
- 7 within 1.0 mi
Show comp detail 6 sales within ~0.75 mi
| Address | Dist | Beds/Ba | Sqft | Sold | Price | $/sf | Match |
|---|---|---|---|---|---|---|---|
| 8687 Muirfield Dr | 0.15mi | 3/2.0 (-1) | 1,568 (0%) | 11mo | $102,000 | $65 | 79 |
| 8747 Muirfield Dr | 0.18mi | 3/2.0 (-1) | 1,486 (-5%) | 8mo | $62,000 | $42 | 71 |
| 14309 Winding Creek Ln Lot 315 | 0.41mi | 3/2.0 (-1) | 1,404 (-10%) | 3mo | $88,000 | $63 | 56 |
| 14445 Fellows Sta | 0.65mi | 3/2.0 (-1) | 1,488 (-5%) | 5mo | $79,900 | $54 | 52 |
| 9150 Stoney Sta Lot 570 | 0.67mi | 3/2.0 (-1) | 1,488 (-5%) | 7mo | $77,000 | $52 | 49 |
| 9008 Brickersville Dr | 0.46mi | 3/2.0 (-1) | 1,404 (-10%) | 12mo | $89,900 | $64 | 46 |
Match score weights: distance 35% · size 25% · config 20% · recency 20%. Top-matched comps best support the ARV.
Projected returns pro-forma
-3.0% appreciation · 3.0% rent growth · sell at horizon
- IRR
- 23.1%
- Equity multiple
- 1.95×
- Total profit
- $32,092
- Equity at exit
- $18,041
- IRR
- 31.0%
- Equity multiple
- 3.79×
- Total profit
- $94,602
- Equity at exit
- $10,462
Cash invested: $33,880 (down + closing). Projections, not guarantees.
Landlord ↔ Tenant lean methodology
- Overall (STATE)
- 62 Landlord-Friendly
- State Michigan
- 62 Landlord-Friendly · EVEN
- County
- — inherits STATE
- City
- — inherits STATE
ZIP-level market 49460
- Home prices YoY
- -30.4%
- Active inventory
- 62
- Price-to-rent
- 4.8×
Monthly cashflow live
- Estimated rent
- $2,085 medium interval (Pro) →
- Mortgage (P&I)
- −$635
- Tax est. 1.5%
- −$151 /mo · $1,815/yr
- Insurance
- −$50
- HOA
- −$0
- Vacancy / Maint / Mgmt
- −$438
- Net cashflow
- $811
Break-even live
UW: 25.0% down · 7.5% · 30yr · 1.5% tax · 5.0% vac · 8.0% maint · 8.0% mgmt
Financing live
Cash to close
- Down payment
- $30,250
- Closing costs
- $3,630
- Reserves months
- —
- Total cash needed
- —
Loan-product check · same deal, 3 products live
Conventional
25% down · 7.5% · 30yr
- Down + closing
- —
- Monthly P&I
- —
- Monthly cashflow
- —
- DSCR
- —
- Eligible?
- —
Personal DTI + credit; lowest rate.
DSCR
20% down · 8.5% · 30yr
- Down + closing
- —
- Monthly P&I
- —
- Monthly cashflow
- —
- DSCR
- —
- Eligible?
- —
No personal income docs; deal must DSCR.
Hard money
10% down · 12.0% · 12mo
- Down + closing
- —
- Monthly P&I
- —
- Monthly cashflow
- —
- DSCR
- —
- Eligible?
- —
Short-term bridge; refi at stabilization.
Rent comps 2 comps
| Address | Beds | Baths | Sqft | Rent | $/sqft | DOM | Units | Dist |
|---|---|---|---|---|---|---|---|---|
| 8930 146th Ave West Olive, MI | 3.0–4.0 | 2.0 | 1424 | $1,899 | $1.33 | 2d | 1 | 0.45mi |
| 14869 Camino CT West Olive, MI | 3.0 | 2.5 | 1498 | $2,460 | $1.64 | 2d | 2 | 0.96mi |
Listing history 12 events
-
2026-06-10days on market $120,999 Active 53 DOM
-
2026-06-09days on market $120,999 Active 52 DOM
-
2026-06-08days on market $120,999 Active 51 DOM
-
2026-06-07days on market $120,999 Active 50 DOM
-
2026-06-05days on market $120,999 Active 47 DOM
-
2026-06-03days on market $120,999 Active 45 DOM
-
2026-06-01days on market $120,999 Active 44 DOM
-
2026-05-31days on market $120,999 Active 43 DOM
-
2026-05-12price $120,999 444-char remark
Show marketing remark (444 chars)
Welcome to this newly available 4-bedroom, 2-bathroom residence designed for comfortable and convenient living. This home features a bright, open floor plan, modern appliances, and access to the community's many amenities. It?s an ideal opportunity to find an affordable and charming place to call your own. Contact Christy today to schedule a showing! * All photos and renderings shown are for illustration purposes only. Actual home may vary.
-
2026-04-23status Active 444-char remark
Show marketing remark (444 chars)
Welcome to this newly available 4-bedroom, 2-bathroom residence designed for comfortable and convenient living. This home features a bright, open floor plan, modern appliances, and access to the community's many amenities. It?s an ideal opportunity to find an affordable and charming place to call your own. Contact Christy today to schedule a showing! * All photos and renderings shown are for illustration purposes only. Actual home may vary.
-
2026-04-08historical 444-char remark
Show marketing remark (444 chars)
Welcome to this newly available 4-bedroom, 2-bathroom residence designed for comfortable and convenient living. This home features a bright, open floor plan, modern appliances, and access to the community's many amenities. It?s an ideal opportunity to find an affordable and charming place to call your own. Contact Christy today to schedule a showing! * All photos and renderings shown are for illustration purposes only. Actual home may vary.
-
2026-04-02$119,999 Active 444-char remark
Show marketing remark (444 chars)
Welcome to this newly available 4-bedroom, 2-bathroom residence designed for comfortable and convenient living. This home features a bright, open floor plan, modern appliances, and access to the community's many amenities. It?s an ideal opportunity to find an affordable and charming place to call your own. Contact Christy today to schedule a showing! * All photos and renderings shown are for illustration purposes only. Actual home may vary.
ⓘ Source: listings_history table (triggers on properties + properties_extension) + one-shot
backfill from property_details.listing_events for pre-trigger history.
Nearby sold comps map
Loading sold comps map…
Walkable amenities ~0.75 mi
Loading nearby amenities…
Taxation est. · year 1
- Rental income
- $25,024
- − Mortgage interest
- −$6,778
- − Property taxes
- −$1,815
- − Insurance
- −$605
- − Repairs & maintenance
- −$2,002
- − Management
- −$2,002
- − Depreciation
- −$3,520
- Taxable income
- $8,302
- Est. tax owed @ 24.0%
- −$1,993
- After-tax cash flow
- $7,742/yr
For passive investors: Depreciation is non-cash, so a rental often shows a tax loss while cash-flowing — sheltering income. Rental losses are passive: they offset passive income freely, and up to $25,000/yr can offset ordinary (W-2) income if you actively participate and your MAGI is under $100k (phasing out to $0 by $150k); unused losses carry forward. On sale, claimed depreciation is recaptured at up to 25%, and gains may owe capital-gains tax (a 1031 exchange can defer both). Figures are a year-1 estimate at your 24.0% rate — not tax advice; consult a CPA.
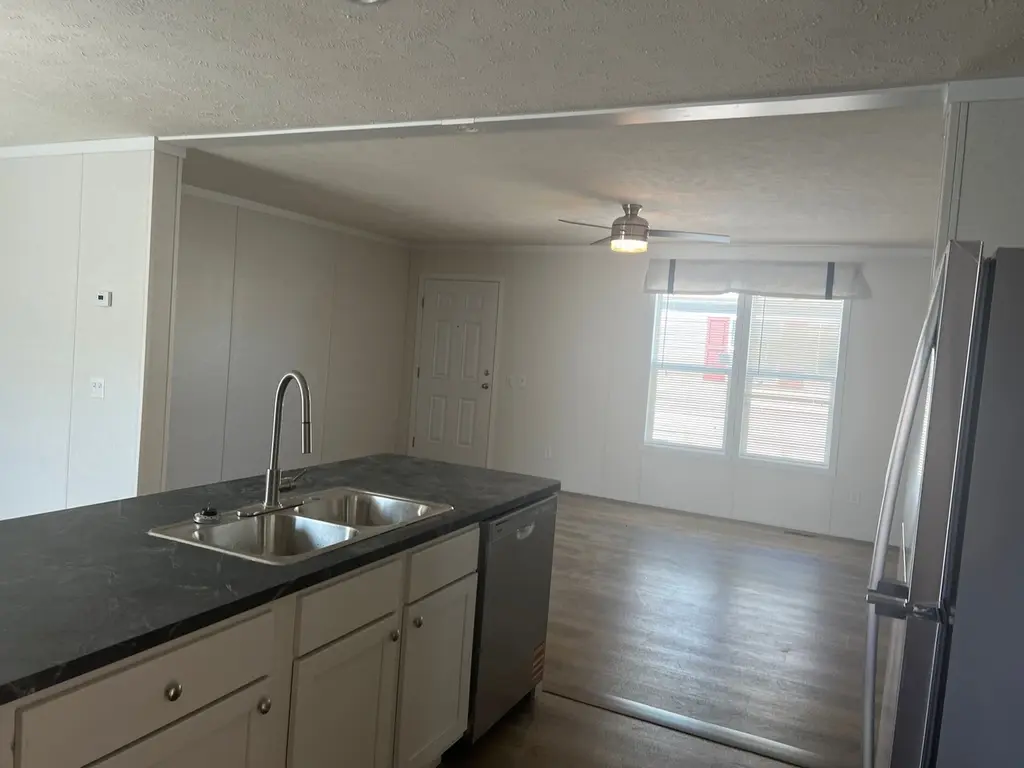
Condition & rehab AI · 1 photo
This 4-bedroom, 2-bathroom home in Grand Haven, MI, is in good condition with a fresh paint job and modern appliances. It offers a good investment opportunity with minimal needed improvements.
Value-add opportunities
- Both Paint touch-ups — Fresh paint enhances curb appeal and interior aesthetics.
- Both Lighting upgrades — Modern lighting fixtures can improve the home's ambiance and energy efficiency.
- Both Appliance upgrades — Upgrading to more energy-efficient or modern appliances can increase both resale and rental value.
- Both Landscaping improvements — Enhancing the landscaping can improve curb appeal and attract more potential buyers or renters.
Renovation cost estimate screening
Value-add ROI direction
- Both Paint touch-ups — Fresh paint enhances curb appeal and interior aesthetics. ↑
- Both Lighting upgrades — Modern lighting fixtures can improve the home's ambiance and energy efficiency. ↑
- Both Appliance upgrades — Upgrading to more energy-efficient or modern appliances can increase both resale and rental value. ↑
- Both Landscaping improvements — Enhancing the landscaping can improve curb appeal and attract more potential buyers or renters. ↑
ⓘ Cost ranges are severity-bucket heuristics (US national rule-of-thumb). Get contractor quotes + a written scope before underwriting a rehab budget.
Schools (NCES district)
- District
- West Ottawa Public School District
- NCES district ID
- 2635910
- Math proficiency
- 37% ▼ -4.00%
- Reading proficiency
- 52% ▼ -4.00%
- Median HH income
- $58,127
- Composite
- 38.94/100
- National rank
- #4087
- State rank
- #140 of 540 in MI
Livability — Grand Haven
- Score
- 81/100
- State rank
- #69
- US rank
- #1467
Category grades
Schools grade is shown separately in the Schools card above.
Census & demographics
- City population
- 33,878
- Population (ZIP)
- 8,891
Population outlook (Ottawa County) Hauer SSP2
- Today (2025)
- 313,561 people
- By 2030
- 330,027 · +5.3%
- By 2040
- 361,118 · +15.2%
- By 2050
- 388,414 · +23.9%
- By 2075
- 452,175 · +44.2%
- By 2100
- 473,041 · +50.9%
Race, ethnicity, and origin ACS 2023
- Neighborhood character
- Predominantly White (75%)
- Race & ethnicity
- White 75% Hispanic / Latino 12% Two or more races 7% Asian 6% Black 2%
- Hispanic origin (detail)
- Mexican 8% Puerto Rican 2%
- Common ancestry
- Iranian 24% Romanian 5% Italian 3%
- Foreign-born
- 10% · Canada
- Languages at home
- 89% English-only · Spanish 6% Other Indo-European 2% Other Asian/Pacific 2%
Political lean MEDSL · Ottawa
- 2024 margin
- Strong R (+20.4) · D 39.0% · R 59.5% · Other 1.5%
- 2008→2024 swing
- +3.4pp toward D · 2008: -23.9pp · 2024: -20.4pp
- All cycles
- 2024: R+20.4 2020: R+21.5 2016: R+30.4 2012: R+34.2 2008: R+23.9
Not yet ingested
- Civics
- —
Market trends
- HPI YoY
- ▼ -129.51%
- Current HPI
- 297.0617
- Rent YoY
- —
- Metro
- —
- State GDP YoY
- ▲ 1.37%
- F500 in state
- 28
Industry mix (Fortune 500 HQ in MI)
| Industry | F500 HQs | Revenue |
|---|---|---|
| Automotive Parts | 3 | $48B |
|
||
| Automotive | 2 | $372B |
|
||
| Chemicals | 1 | $45B |
|
||
| Automotive Retail | 1 | $29B |
|
||
| Healthcare / Medical Devices | 1 | $23B |
|
||
| Automotive Technology | 1 | $20B |
|
||
Price history
+0.8% since first listed4 events — show timeline
- 2026-05-12 Price Changed $120,999 Zillow
- 2026-04-23 Relisted — Zillow
- 2026-04-08 Delisted — Zillow
- 2026-04-02 Listed $119,999 Zillow
Cash-flow waterfall
monthlySold comps — $/sqft
last 12 mo · ≤1 miLoading sold comps…