507 Suwanee Dr · North Fort Myers, FL
Flood risk No data
- FEMA flood zone
- —
- Chance of flooding over 30 yrs
- —
- Est. flood insurance / yr
- —
Fire risk No data
- Est. fire insurance / yr
- —
Heat risk No data
- Hot days now (above threshold)
- —
- Hot days in 30 yrs
- —
Wind risk No data
- Chance of severe wind over 30 yrs
- —
Air-quality risk No data
- Unhealthy air days now
- —
- Unhealthy air days in 30 yrs
- —
Risk factors via First Street. Map © Google.
Why this score? — see what drove the B grade
The composite is a weighted blend of 9 inputs, each scored 0–100. Each bar is that input's sub-score; the figure is the points it added to the 100-point composite (weight × sub-score).
- Cash flow +30.0/30.0
- 1% rule +10.0/10.0
- DSCR +10.0/10.0
- ARV discount +7.5/15.0
- Schools +4.1/10.0
- Condition / age +4.0/5.0
- Livability +3.7/5.0
- Rent growth +3.2/5.0
- Appreciation +0.0/10.0
$59,900
🖨 Deal sheet 📄 Offer letter ✓ Due diligence
Listing remarks
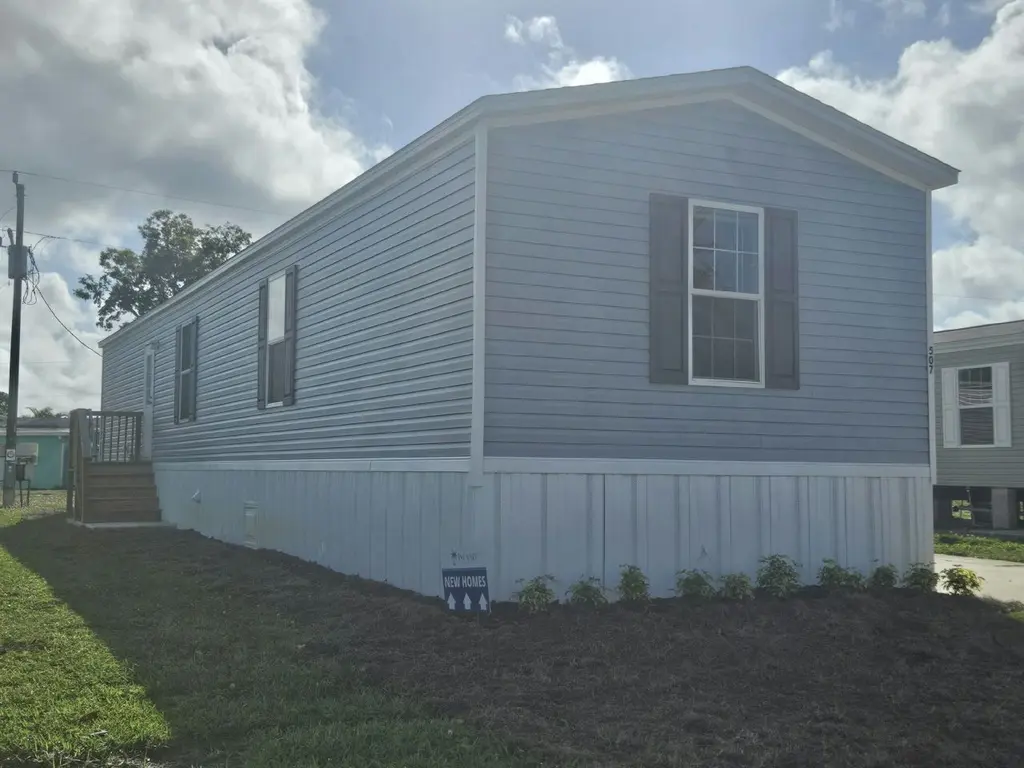
Own your own 3 bed/2 bath home! Make an appointment now to see this spacious brand new home with plenty of space for you and your family. Low monthly payments available. Call us to schedule your viewing of this feature-packed home in Eagle Estates, a well-maintained, professionally managed manufactured home community!
Key facts
- Built 2026
- Listed 16 days
Property features AI
Finance
- Financial info: List price $59,900
Exterior
- Home design: Single-family property (spec/new construction plan: 507 Suwanee Drive)
- Construction: Built/new construction listing year 2026
Interior
- Bedrooms: 3 bedrooms
- Bathrooms: 2 full bathrooms
- Interior features: Living area approximately 1,056
Neighborhood map
What this means for you Summary
Snapshot
- This is a 3-bed/2.0-bath manufactured listed at $60k. Condition is rated good.
Deal economics
- At list price, monthly cash flow is $913 ($11k/yr) — positive.
- The deal already cash-flows at list — no discount required.
- Meets the 1% rule at list price ($2k rent vs $60k).
- Recommended offer: $59k (1.5% below list) — sets the bar for market timing.
- Cap rate 24.6% vs local median 3.6% in North Fort Myers — top-decile yield for the area; either an underpriced asset or a hidden risk that comps aren't pricing in. Stress-test before assuming the spread holds.
Location & tenants
- Location reads 74/100 on livability (#269 in FL, #4,409 nationally) — a middle-class / working-renter tenant base. Strengths: cost of living A+, housing A+, health & safety A+; Watch: employment C-, amenities F, commute F.
- Lee (suburban): math 47% / reading 50% proficiency, ranked #42 of 73 in FL (top 58%) — families likely to look elsewhere, expect single-tenant / working-renter base with shorter leases.
- Market conditions: Rents rising (+2.6%/yr); 841 active listings in the ZIP; 19 comparable units currently listed for rent nearby; rentals at typical pace (median 24d on market — plan ~3-4 weeks tenant-placement turnaround); 15,411 units permitted in Lee County in 2024 (4,686 in 5+ unit buildings).
- This rent runs 37% of the median local income ($55k/yr) — at the standard rent-burdened threshold; future hikes will face affordability resistance.
Forward outlook
- Local home prices are declining (-3.0%/yr); year-one equity from $414 of loan paydown is wiped out by about $2k of value loss. Plan a longer hold.
- Lee County population projected at +44% by 2050 — long-run rental-demand tailwind backs the buy-and-hold thesis.
- At projected returns (-3.0% appreciation + 2.6% rent growth), your $17k cash investment doubles in ~2 years — after that, you're playing with house money.
Negotiation context
- It's been on market 16 days — a 2% lower offer ($59k) is reasonable based on typical stale-listing flexibility.
Questions for the listing agent
- Is there a deadline driving the sale (1031 exchange, divorce, estate, relocation)? That informs how much negotiation room exists.
- What's the average days-on-market for RENTAL listings here right now (not sales)? A rising rental-DOM trend means longer vacancies and softer asking-rent achievability than the comps imply.
- What's the recent tenant-quality profile in this submarket — average credit score on applications, eviction rate, late-payment / NSF rate, and stable-employment percentage? A property-management company in the area should have these aggregated.
- How much new for-sale + rental construction is in the pipeline within 1–3 miles? Heavy new supply typically softens prices + rents 12–24 months out; constrained supply supports both.
Investment metrics
- 1% rule
- 2.80% ✓
- Cap rate
- 24.59%
- Cash-on-cash
- 65.35%
- DSCR
- 3.91
- GRM
- 3.0
CMA / ARV
No comps found within radius.
Projected returns pro-forma
-3.0% appreciation · 2.63% rent growth · sell at horizon
- IRR
- 64.1%
- Equity multiple
- 3.85×
- Total profit
- $47,865
- Equity at exit
- $8,931
- IRR
- 68.4%
- Equity multiple
- 7.81×
- Total profit
- $114,148
- Equity at exit
- $5,179
Cash invested: $16,772 (down + closing). Projections, not guarantees.
Landlord ↔ Tenant lean methodology
- Overall (STATE)
- 87 Strongly Landlord-Friendly
- State Florida
- 87 Strongly Landlord-Friendly · R+3
- County
- — inherits STATE
- City
- — inherits STATE
ZIP-level market 33917
- Home prices YoY
- -30.2%
- Rents YoY
- 2.6%
- Active inventory
- 841
- Price-to-rent
- 3.0×
Monthly cashflow live
- Estimated rent
- $1,680 high interval (Pro) →
- Mortgage (P&I)
- −$314
- Tax est. 1.5%
- −$75 /mo · $898/yr
- Insurance
- −$25
- HOA
- −$0
- Vacancy / Maint / Mgmt
- −$353
- Net cashflow
- $913
Break-even live
UW: 25.0% down · 7.5% · 30yr · 1.5% tax · 5.0% vac · 8.0% maint · 8.0% mgmt
Financing live
Cash to close
- Down payment
- $14,975
- Closing costs
- $1,797
- Reserves months
- —
- Total cash needed
- —
Loan-product check · same deal, 3 products live
Conventional
25% down · 7.5% · 30yr
- Down + closing
- —
- Monthly P&I
- —
- Monthly cashflow
- —
- DSCR
- —
- Eligible?
- —
Personal DTI + credit; lowest rate.
DSCR
20% down · 8.5% · 30yr
- Down + closing
- —
- Monthly P&I
- —
- Monthly cashflow
- —
- DSCR
- —
- Eligible?
- —
No personal income docs; deal must DSCR.
Hard money
10% down · 12.0% · 12mo
- Down + closing
- —
- Monthly P&I
- —
- Monthly cashflow
- —
- DSCR
- —
- Eligible?
- —
Short-term bridge; refi at stabilization.
Rent comps 19 comps
| Address | Beds | Baths | Sqft | Rent | $/sqft | DOM | Units | Dist |
|---|---|---|---|---|---|---|---|---|
| 16900 Slater Rd North Fort Myers, FL | 2.0–4.0 | 2.0 | 1120 | $1,524 | $1.36 | 2d | 17 | 0.04mi |
| 410 Suwanee Dr North Fort Myers, FL | 3.0 | 2.0 | 1480 | $1,650 | $1.11 | 23d | 1 | 0.16mi |
| 2388 Case Ln North Fort Myers, FL | 3.0 | 2.0 | 1064 | $1,825 | $1.72 | 3d | 1 | 0.84mi |
| 8028 Breeze Dr North Fort Myers, FL | 2.0 | 1.0 | 750 | $850 | $1.13 | 23d | 1 | 0.85mi |
| 2376 Case Ln Unit A North Fort Myers, FL | 2.0 | 2.0 | 1440 | $1,800 | $1.25 | 23d | 1 | 0.86mi |
| 2500 Gail Helen Ct North Fort Myers, FL | 3.0 | 2.0 | 1296 | $1,500 | $1.16 | 23d | 1 | 0.93mi |
| 7622 Peyraud Dr North Fort Myers, FL | 3.0 | 2.0 | 1404 | $1,350 | $0.96 | 23d | 1 | 0.94mi |
| 15020 Caspian Tern Ct Unit 103 North Fort Myers, FL | 2.0 | 2.5 | 1286 | $1,600 | $1.24 | 23d | 1 | 0.95mi |
| 15050 Caspian Tern Ct #103 North Fort Myers, FL | 2.0 | 2.5 | 1365 | $1,520 | $1.11 | 23d | 1 | 0.95mi |
| 15100 Caspian Tern Ct North Fort Myers, FL | 2.0 | 2.5 | 1365 | $1,595 | $1.17 | 23d | 1 | 1.05mi |
| 106 Gaslight Ave North Fort Myers, FL | 2.0 | 2.0 | 1056 | $1,400 | $1.33 | 3d | 1 | 1.18mi |
| 226 Lamplighter Ln North Fort Myers, FL | 2.0 | 1.0 | 900 | $899 | $1.00 | 23d | 1 | 1.18mi |
| 8146 Tolles Dr North Fort Myers, FL | 2.0 | 1.0 | 784 | $850 | $1.08 | 23d | 1 | 1.19mi |
| 234 Lamplighter Ln North Fort Myers, FL | 2.0 | 2.0 | 864 | $895 | $1.04 | 14d | 1 | 1.20mi |
| 280 Flame Ln North Fort Myers, FL | 2.0 | 2.0 | 980 | $1,350 | $1.38 | 3d | 1 | 1.21mi |
| 7306 Coon Rd North Fort Myers, FL | 2.0 | 1.0 | 1000 | $1,300 | $1.30 | 11d | 1 | 1.28mi |
| 137 Lantern Pl Unit A North Fort Myers, FL | 2.0 | 1.0 | 1080 | $1,200 | $1.11 | 3d | 1 | 1.32mi |
| 1916 Flamingo Dr North Fort Myers, FL | 2.0 | 1.0 | 852 | $1,275 | $1.50 | 23d | 1 | 1.41mi |
| 1916 Flamingo Dr North Fort Myers, FL | 2.0 | 1.0 | 852 | $1,250 | $1.47 | 3d | 1 | 1.41mi |
Listing history 3 events
-
2026-06-07days on market $59,900 Active 16 DOM
-
2026-06-01days on market $59,900 Active 10 DOM
-
2026-06-01days on market $59,900 Active 9 DOM
ⓘ Source: listings_history table (triggers on properties + properties_extension) + one-shot
backfill from property_details.listing_events for pre-trigger history.
Nearby sold comps map
Loading sold comps map…
Walkable amenities ~0.75 mi
Loading nearby amenities…
Taxation est. · year 1
- Rental income
- $20,161
- − Mortgage interest
- −$3,355
- − Property taxes
- −$898
- − Insurance
- −$300
- − Repairs & maintenance
- −$1,613
- − Management
- −$1,613
- − Depreciation
- −$1,743
- Taxable income
- $10,639
- Est. tax owed @ 24.0%
- −$2,553
- After-tax cash flow
- $8,406/yr
For passive investors: Depreciation is non-cash, so a rental often shows a tax loss while cash-flowing — sheltering income. Rental losses are passive: they offset passive income freely, and up to $25,000/yr can offset ordinary (W-2) income if you actively participate and your MAGI is under $100k (phasing out to $0 by $150k); unused losses carry forward. On sale, claimed depreciation is recaptured at up to 25%, and gains may owe capital-gains tax (a 1031 exchange can defer both). Figures are a year-1 estimate at your 24.0% rate — not tax advice; consult a CPA.
Condition & rehab AI · 5 photos
This spacious, brand new manufactured home in Eagle Estates is move-in ready with a good condition score and minimal maintenance required. Potential buyers and tenants can appreciate the modern kitchen, well-maintained exterior, and neutral interior paint. Adding smart home features and upgrading the kitchen appliances can further enhance its value.
Value-add opportunities
- Both Painting the exterior and interior walls — Fresh paint can enhance curb appeal and interior aesthetics.
- Both Landscaping improvements — Enhanced landscaping can improve curb appeal and attract potential buyers/tenants.
- Both Adding smart home features — Smart home features can increase the home's value and appeal to tech-savvy buyers/tenants.
- Both Upgrading the kitchen appliances — Modern appliances can make the kitchen more functional and appealing to potential buyers/tenants.
Renovation cost estimate screening
Value-add ROI direction
- Both Painting the exterior and interior walls — Fresh paint can enhance curb appeal and interior aesthetics. ↑
- Both Landscaping improvements — Enhanced landscaping can improve curb appeal and attract potential buyers/tenants. ↑
- Both Adding smart home features — Smart home features can increase the home's value and appeal to tech-savvy buyers/tenants. ↑
- Both Upgrading the kitchen appliances — Modern appliances can make the kitchen more functional and appealing to potential buyers/tenants. ↑
ⓘ Cost ranges are severity-bucket heuristics (US national rule-of-thumb). Get contractor quotes + a written scope before underwriting a rehab budget.
Schools (NCES district)
- District
- Lee
- NCES district ID
- 1201080
- Math proficiency
- 47% ▼ -11.00%
- Reading proficiency
- 50% ▼ -4.00%
- Median HH income
- $49,518
- Composite
- 41.49/100
- National rank
- #3458
- State rank
- #42 of 73 in FL
Livability — North Fort Myers
- Score
- 74/100
- State rank
- #269
- US rank
- #4409
Category grades
Schools grade is shown separately in the Schools card above.
Census & demographics
- Census place
- North Fort Myers, FL
- County
- Lee County · 788,662 people
- City population
- 57,035
- Metro
- Cape Coral-Fort Myers, FL
- Population (ZIP)
- 33,380
- Household income
- $55,000
- Rent vs Own
- Severe rent burden
- 775.0
Population outlook (Lee County) Hauer SSP2
- Today (2025)
- 871,946 people
- By 2030
- 955,468 · +9.6%
- By 2040
- 1,113,587 · +27.7%
- By 2050
- 1,256,891 · +44.1%
- By 2075
- 1,560,270 · +78.9%
- By 2100
- 1,726,848 · +98.0%
Race, ethnicity, and origin ACS 2023
- Neighborhood character
- Predominantly White (85%)
- Race & ethnicity
- White 85% Hispanic / Latino 10% Two or more races 7% Asian 1% Black 1%
- Hispanic origin (detail)
- Mexican 2% Puerto Rican 1% Cuban 3%
- Common ancestry
- Lithuanian 3% Romanian 3% Slovak 2%
- Foreign-born
- 10% · Canada
- Languages at home
- 88% English-only · Spanish 9% Other Indo-European 1% Russian/Polish/Slavic 1%
Political lean MEDSL · Lee
- 2024 margin
- Strong R (+28.4) · D 35.5% · R 63.9%
- 2008→2024 swing
- -18.0pp toward R · 2008: -10.4pp · 2024: -28.4pp
- All cycles
- 2024: R+28.4 2020: R+19.2 2016: R+20.4 2012: R+16.6 2008: R+10.4
Not yet ingested
- Civics
- —
Market trends
- HPI YoY
- ▼ -122.28%
- Current HPI
- 282.2895
- Rent YoY
- ▲ 2.63%
- Metro
- Cape Coral-Fort Myers, FL
- State GDP YoY
- ▲ 3.28%
- F500 in state
- 36
Industry mix (Fortune 500 HQ in FL)
| Industry | F500 HQs | Revenue |
|---|---|---|
| Industrial Technology | 2 | $29B |
|
||
| Insurance | 2 | $17B |
|
||
| Retail | 1 | $60B |
|
||
| Technology Distribution | 1 | $58B |
|
||
| Homebuilding | 1 | $35B |
|
||
| Technology Manufacturing | 1 | $35B |
|
||
Cash-flow waterfall
monthlySold comps — $/sqft
last 12 mo · ≤1 miLoading sold comps…