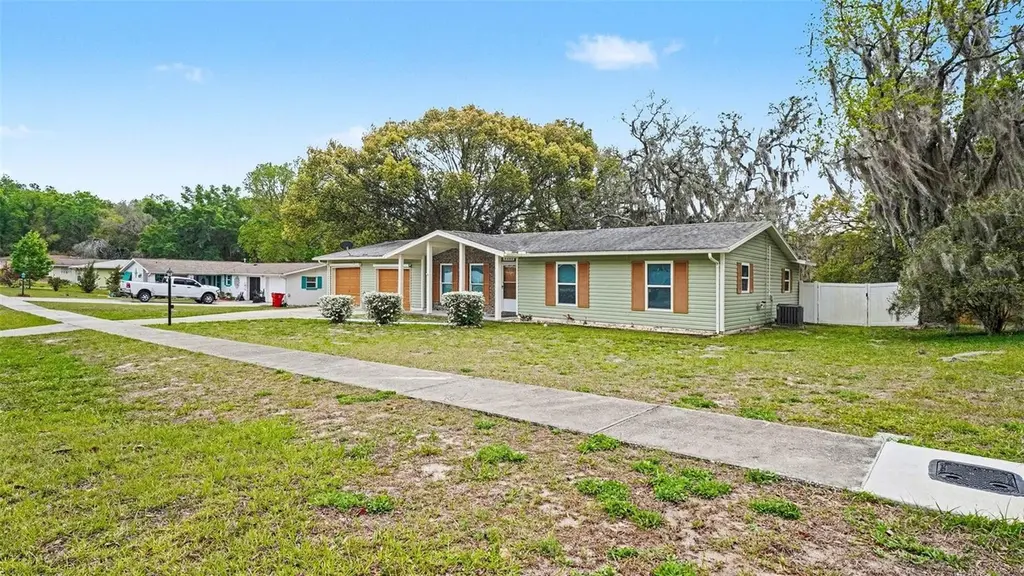
2434 W Gardenia Dr · Citrus Springs, FL
Flood risk 1/10 · Minimal
- FEMA flood zone
- X (unshaded)
- Chance of flooding over 30 yrs
- 0.0%
- Est. flood insurance / yr
- $507 – $1,088
Fire risk 3/10 · Minor
- Est. fire insurance / yr
- $947 – $1,759
Heat risk 9/10 · Severe
- Hot days now (above 107°F)
- 7 days/yr
- Hot days in 30 yrs
- 24 days/yr
Wind risk 9/10 · Severe
- Chance of severe wind over 30 yrs
- 99.0%
Air-quality risk 2/10 · Minimal
- Unhealthy air days now
- 0 days/yr
- Unhealthy air days in 30 yrs
- 1 days/yr
Risk factors via First Street. Map © Google.
Why this score? — see what drove the D grade
The composite is a weighted blend of 9 inputs, each scored 0–100. Each bar is that input's sub-score; the figure is the points it added to the 100-point composite (weight × sub-score).
- Cash flow +14.5/30.0
- ARV discount +6.6/15.0
- DSCR +4.4/10.0
- Schools +4.1/10.0
- Livability +3.4/5.0
- 1% rule +2.8/10.0
- Rent growth +2.5/5.0
- Condition / age +2.5/5.0
- Appreciation +0.1/10.0
$230,000
🖨 Deal sheet 📄 Offer letter ✓ Due diligence
Listing remarks
One or more photo(s) has been virtually staged. Welcome to 2434 W Gardenia Drive in Citrus Springs—where comfort, updates, and a scenic golf course setting come together beautifully. This well-maintained home is perfectly positioned on the 12th tee, offering peaceful views and a relaxing Florida lifestyle right from your backyard. Inside, you’ll find a newly renovated kitchen featuring granite countertops, updated cabinetry, and a functional layout ideal for both everyday living and entertaining. Crown molding throughout adds an elegant touch, enhancing the home’s character and finish. The living spaces are filled with natural light and offer a seamless flow for both daily
Key facts
- Natural light
- Granite countertops
- Updated cabinetry
Tags
Property features AI
Finance
- Other: Property is homesteaded; Zoned PDR
- HOA & community: Pets allowed (cats and dogs)
Exterior
- Parking: Attached garage (2 spaces)
- Utilities: Public water; Public sewer; Public utilities
- Home design: Single family residence; One story; North-facing
- Construction: Frame construction; Shingle roof; Block foundation; Built on lot approximately 0.34 acres (100 x 150)
- Exterior features: Covered patio/porch; Rain gutters; Sidewalk; Vinyl fencing; Trees and landscaped yard; Asphalt road access
Interior
- Kitchen: Dishwasher; Microwave; Refrigerator
- Bedrooms: 3 bedrooms
- Flooring: Vinyl
- Bathrooms: 2 full bathrooms
- Heating & cooling: Central heating; Central air conditioning
- Interior features: Crown molding; Sliding doors
- Laundry & utility: Laundry room
Neighborhood map
What this means for you Summary
Snapshot
- This is a 3-bed/2.0-bath single-family listed at $230k.
Deal economics
- At list price, monthly cash flow is $50 ($606/yr) — positive.
- The deal already cash-flows at list — no discount required.
- To meet the 1% rule (rent ≥ 1% of price), the offer needs to be $179k (22.4% below list).
- Recommended offer: $179k (22.4% below list) — sets the bar for 1% rule.
- Cap rate 6.6% vs local median 5.1% in Citrus Springs — meaningfully above typical; check what's discounted (condition, days-on-market, listing class) to confirm the premium yield is real.
Location & tenants
- Location reads 68/100 on livability (#521 in FL) — a middle-class / working-renter tenant base. Strengths: cost of living A+, housing A+; Watch: health & safety C-, employment D+, amenities F.
- Citrus (rural): math 49% / reading 50% proficiency, ranked #44 of 73 in FL (top 60%) — families likely to look elsewhere, expect single-tenant / working-renter base with shorter leases.
- Zoned schools: Citrus Springs Elementary School (math 52% / reading 48%, grade D+, #1,070 of 2,144 statewide, top 51%, 817 students, 71% FRL); Lecanto High School (math 46% / reading 53%, grade D, #179 of 667 statewide, top 29%, 1,630 students, 46% FRL) — zoned schools at 58% FRL track the district average.
- Market conditions: 1242 active listings in the ZIP; 26 comparable units currently listed for rent nearby; rentals at typical pace (median 21d on market — plan ~3-4 weeks tenant-placement turnaround); 2,443 units permitted in Citrus County in 2024 (0 in 5+ unit buildings).
- This rent runs 31% of the median local income ($69k/yr) — at the standard rent-burdened threshold; future hikes will face affordability resistance.
Forward outlook
- Local home prices are declining (-3.0%/yr); year-one equity from $2k of loan paydown is wiped out by about $7k of value loss. Plan a longer hold.
- Citrus County population projected to shrink 10% by 2050 — rents likely to lag national; underwrite the cash flow, not the appreciation.
Negotiation context
- It's been on market 69 days — a 6% lower offer ($216k) is reasonable based on typical stale-listing flexibility.
- 6 sale attempts since 18y ago; this cycle's ask has dropped $20k (8%) from the opening price — seller is motivated, your offer sets the floor, not the list.
Risks & watch-outs
- Climate carrying-cost: severe wind risk, 99% chance of damaging wind over 30y; extreme-heat days projected 7→24/yr by 2055 (HVAC capex compounding) — expect insurance premiums to compound above CPI over the hold.
Questions for the listing agent
- It's been on market 69 days. Have you received any prior offers? Is the seller open to a 22% concession, seller financing, or rate buy-down credit?
- Built in 1974 — when were the roof, HVAC, electrical panel, plumbing, and water heater last replaced?
- Why hasn't it sold? Are there any deal-killer items the seller is aware of (foundation, flood, title, zoning, code violations)?
- Is there a deadline driving the sale (1031 exchange, divorce, estate, relocation)? That informs how much negotiation room exists.
- The area grade is low — what's the realistic commute time and amenity access for the typical tenant pool here? Any planned neighborhood developments (good or bad) we should know about?
- What's the average days-on-market for RENTAL listings here right now (not sales)? A rising rental-DOM trend means longer vacancies and softer asking-rent achievability than the comps imply.
- What's the recent tenant-quality profile in this submarket — average credit score on applications, eviction rate, late-payment / NSF rate, and stable-employment percentage? A property-management company in the area should have these aggregated.
- How much new for-sale + rental construction is in the pipeline within 1–3 miles? Heavy new supply typically softens prices + rents 12–24 months out; constrained supply supports both.
Investment metrics
- 1% rule
- 0.78% ✗
- Cap rate
- 6.56%
- Cash-on-cash
- 0.94%
- DSCR
- 1.04
- GRM
- 10.7
CMA / ARV
- ARV (on-the-fly)
- $225,262
- Comps found
- 12
Show comp detail 12 sales within ~0.75 mi
| Address | Dist | Beds/Ba | Sqft | Sold | Price | $/sf | Match |
|---|---|---|---|---|---|---|---|
| 9074 N Golfview Dr | 0.16mi | 3/2.0 | 1,465 (+8%) | 1mo | $220,000 | $150 | 78 |
| 2420 W Menores Dr | 0.52mi | 3/2.0 | 1,264 (-7%) | 3mo | $213,900 | $169 | 62 |
| 1926 W Belgrade Dr | 0.56mi | 4/2.0 (+1) | 1,397 (+3%) | 2mo | $220,000 | $157 | 62 |
| 2434 W Menores Dr | 0.51mi | 3/2.0 | 1,264 (-7%) | 3mo | $205,000 | $162 | 62 |
| 8830 N Salina Dr | 0.34mi | 4/2.0 (+1) | 1,503 (+11%) | 1mo | $245,000 | $163 | 60 |
| 1774 W Water Lily Dr | 0.71mi | 3/2.0 | 1,402 (+3%) | 2mo | $239,900 | $171 | 60 |
| 2275 W Eric Dr | 0.57mi | 3/2.0 | 1,264 (-7%) | 3mo | $213,900 | $169 | 59 |
| 2306 W Menores Dr | 0.58mi | 3/2.0 | 1,264 (-7%) | 3mo | $210,000 | $166 | 59 |
| 2276 W Menores Dr | 0.60mi | 3/2.0 | 1,264 (-7%) | 3mo | $213,900 | $169 | 58 |
| 8354 N Saxon Way | 0.69mi | 3/2.0 | 1,466 (+8%) | 1mo | $200,000 | $136 | 54 |
| 1952 W Beach Plum Dr | 0.55mi | 3/2.0 | 1,529 (+13%) | 1mo | $260,000 | $170 | 52 |
| 9138 N Alpinia Dr | 0.69mi | 3/2.0 | 1,554 (+14%) | 2mo | $239,990 | $154 | 42 |
Match score weights: distance 35% · size 25% · config 20% · recency 20%. Top-matched comps best support the ARV.
Projected returns pro-forma
-3.0% appreciation · 3.0% rent growth · sell at horizon
- IRR
- -14.9%
- Equity multiple
- 0.47×
- Total profit
- $-34,170
- Equity at exit
- $34,294
- IRR
- -6.3%
- Equity multiple
- 0.60×
- Total profit
- $-26,080
- Equity at exit
- $19,886
Cash invested: $64,400 (down + closing). Projections, not guarantees.
Landlord ↔ Tenant lean methodology
- Overall (STATE)
- 87 Strongly Landlord-Friendly
- State Florida
- 87 Strongly Landlord-Friendly · R+3
- County
- — inherits STATE
- City
- — inherits STATE
ZIP-level market 34434
- Home prices YoY
- -2.9%
- Active inventory
- 1242
- Price-to-rent
- 10.7×
Monthly cashflow live
- Estimated rent
- $1,785 high interval (Pro) →
- Mortgage (P&I)
- −$1,206
- Tax from tax record
- −$58 /mo · $693/yr
- Insurance
- −$96
- HOA
- −$0
- Vacancy / Maint / Mgmt
- −$375
- Net cashflow
- $50
Break-even live
UW: 25.0% down · 7.5% · 30yr · 1.5% tax · 5.0% vac · 8.0% maint · 8.0% mgmt
Financing live
Cash to close
- Down payment
- $57,500
- Closing costs
- $6,900
- Reserves months
- —
- Total cash needed
- —
Loan-product check · same deal, 3 products live
Conventional
25% down · 7.5% · 30yr
- Down + closing
- —
- Monthly P&I
- —
- Monthly cashflow
- —
- DSCR
- —
- Eligible?
- —
Personal DTI + credit; lowest rate.
DSCR
20% down · 8.5% · 30yr
- Down + closing
- —
- Monthly P&I
- —
- Monthly cashflow
- —
- DSCR
- —
- Eligible?
- —
No personal income docs; deal must DSCR.
Hard money
10% down · 12.0% · 12mo
- Down + closing
- —
- Monthly P&I
- —
- Monthly cashflow
- —
- DSCR
- —
- Eligible?
- —
Short-term bridge; refi at stabilization.
Rent comps 26 comps
| Address | Beds | Baths | Sqft | Rent | $/sqft | DOM | Units | Dist |
|---|---|---|---|---|---|---|---|---|
| 9081 N Golfview Dr Citrus Springs, FL | 3.0 | 1.5 | 1374 | $1,400 | $1.02 | 21d | 1 | 0.23mi |
| 9305 N Citrus Springs Blvd Citrus Springs, FL | 3.0 | 2.0 | 1411 | $1,800 | $1.28 | 21d | 1 | 0.26mi |
| 2330 W Juan Vega Ln Dunnellon, FL | 3.0 | 2.0 | 1204 | $1,675 | $1.39 | 21d | 1 | 0.34mi |
| 9205 N Fawn Way Citrus Springs, FL | 3.0 | 2.0 | 1428 | $1,750 | $1.23 | 21d | 1 | 0.41mi |
| 2907 W Camilo Dr Citrus Springs, FL | 4.0 | 2.0 | 1449 | $1,795 | $1.24 | 21d | 1 | 0.57mi |
| 9127 N Justa Dr Citrus Springs, FL | 3.0 | 2.0 | 1453 | $1,800 | $1.24 | 21d | 1 | 0.82mi |
| 9730 N Elkcam Blvd Citrus Springs, FL | 4.0 | 2.0 | 1672 | $1,785 | $1.07 | 21d | 1 | 0.84mi |
| 3036 W Akron Pl Citrus Springs, FL | 4.0 | 2.0 | 1833 | $2,000 | $1.09 | 21d | 1 | 0.90mi |
| 8596 N Spartan Dr Citrus Springs, FL | 4.0 | 2.0 | 1833 | $2,000 | $1.09 | 21d | 1 | 0.92mi |
| 8006 N Voyager Dr Citrus Springs, FL | 4.0 | 2.0 | 1636 | $1,899 | $1.16 | 21d | 1 | 1.02mi |
| 8267 N Santos Dr Citrus Springs, FL | 3.0 | 2.0 | 1453 | $1,800 | $1.24 | 21d | 1 | 1.12mi |
| 9545 N Travis Dr Unit A Citrus Springs, FL | 3.0 | 2.0 | 1000 | $1,350 | $1.35 | 21d | 1 | 1.12mi |
| 9543B N Travis Dr Unit A Citrus Springs, FL | 3.0 | 2.0 | 1000 | $1,350 | $1.35 | 21d | 1 | 1.16mi |
| 3584 W Burgandy Dr Citrus Springs, FL | 3.0 | 2.0 | 1413 | $1,699 | $1.20 | 21d | 1 | 1.17mi |
| 9475 N Camel Dr Dunnellon, FL | 3.0 | 2.0 | 1670 | $1,800 | $1.08 | 21d | 1 | 1.22mi |
| 8715 N Paradisea Dr Citrus Springs, FL | 3.0 | 2.0 | 1403 | $1,850 | $1.32 | 21d | 1 | 1.22mi |
| 9271 N Peachtree Way Unit 9271 Citrus Springs, FL | 2.0 | 2.0 | 900 | $1,300 | $1.44 | 21d | 1 | 1.26mi |
| 9298 N Mendoza Way Citrus Springs, FL | 3.0 | 2.0 | 1350 | $1,800 | $1.33 | 21d | 1 | 1.29mi |
| 9337 N Mendoza Way Citrus Springs, FL | 2.0 | 2.0 | 984 | $1,275 | $1.30 | 21d | 1 | 1.30mi |
| 9437 N Travis Dr Citrus Springs, FL | 2.0 | 2.0 | 972 | $1,325 | $1.36 | 21d | 1 | 1.35mi |
| 9262 N Travis Dr Citrus Springs, FL | 2.0 | 2.0 | 984 | $1,395 | $1.42 | 21d | 1 | 1.37mi |
| 1912 W Quaker Ln Citrus Springs, FL | 4.0 | 2.0 | 1636 | $1,895 | $1.16 | 21d | 1 | 1.39mi |
| 9018 N Mendoza Way Citrus Springs, FL | 2.0 | 2.0 | 1225 | $1,499 | $1.22 | 21d | 1 | 1.42mi |
| 9995 N Sandree Dr Citrus Springs, FL | 3.0 | 2.0 | 1453 | $1,895 | $1.30 | 21d | 1 | 1.43mi |
| 7938 N Maltese Dr Citrus Springs, FL | 4.0 | 2.0 | 1833 | $2,150 | $1.17 | 21d | 1 | 1.46mi |
| 8030 N Galena Ave Citrus Springs, FL | 4.0 | 2.0 | 1833 | $2,150 | $1.17 | 21d | 1 | 1.49mi |
Listing history 39 events
-
2026-06-19days on market $230,000 Active 69 DOM
-
2026-06-18days on market $230,000 Active 68 DOM
-
2026-06-17days on market $230,000 Active 67 DOM
-
2026-06-16days on market $230,000 Active 66 DOM
-
2026-06-15days on market $230,000 Active 65 DOM
-
2026-06-14days on market $230,000 Active 63 DOM
-
2026-06-13days on market $230,000 Active 62 DOM
-
2026-06-09days on market $230,000 Active 59 DOM
-
2026-06-08days on market $230,000 Active 58 DOM
-
2026-06-07days on market $230,000 Active 57 DOM
-
2026-06-03days on market $230,000 Active 53 DOM
-
2026-06-02days on market $230,000 Active 52 DOM
-
2026-06-01days on market $230,000 Active 51 DOM
-
2026-05-31days on market $230,000 Active 50 DOM
-
2026-05-30days on market $230,000 Active 49 DOM
-
2026-05-20status Active
-
2026-05-04status Pending
-
2026-04-24price $230,000
-
2026-04-06price $240,000
-
2026-03-26$250,000 Active
-
2026-02-11price $255,000
-
2026-02-11price $255,000
-
2026-01-26price $260,000
-
2026-01-26price $260,000
-
2026-01-19price $264,000
-
2026-01-19$264,000 Active
-
2024-03-01historical
-
2024-02-29soldstatus $233,000 Closed
-
2024-02-29soldstatus $233,000
-
2024-01-24status Pending
-
2024-01-05$232,000 Active
-
2011-04-07soldstatus $63,700
-
2011-03-31soldstatus $63,700
-
2010-05-03$65,000
-
2008-08-27historical
-
2008-03-10$103,500
-
1989-09-01soldstatus $66,000
-
1981-05-01soldstatus $55,000
-
1978-02-01soldstatus $38,000
ⓘ Source: listings_history table (triggers on properties + properties_extension) + one-shot
backfill from property_details.listing_events for pre-trigger history.
Tax reassessment forecast FL · Resets to sale price
- Current annual tax
- $693 · $58/mo
- Projected year-2 tax
- $1,909 · $159/mo
- Expected delta
- +$1,216/yr (+$101/mo · 175.4%)
ⓘ Screening estimate from a state-policy table — verify with the county assessor before closing.
Climate risk First Street
- Flood 1/10 Low FEMA zone X (unshaded) · 0% chance over 30 yrs
- Wildfire 3/10 Moderate
- Heat 9/10 Extreme 7 d/yr ≥107°F today · 24 d/yr by 30 yrs out
- Wind 9/10 Extreme 99% chance of damaging wind over 30 yrs
- Air quality 2/10 Low 0 unhealthy d/yr today · 1 by 30 yrs out
Nearby sold comps map
Loading sold comps map…
Walkable amenities ~0.75 mi
Loading nearby amenities…
Taxation est. · year 1
- Rental income
- $21,421
- − Mortgage interest
- −$12,884
- − Property taxes
- −$693
- − Insurance
- −$1,150
- − Repairs & maintenance
- −$1,714
- − Management
- −$1,714
- − Depreciation
- −$6,691
- Taxable loss
- −$3,424
- Est. tax savings @ 24.0%
- +$822
- After-tax cash flow
- $1,427/yr
For passive investors: Depreciation is non-cash, so a rental often shows a tax loss while cash-flowing — sheltering income. Rental losses are passive: they offset passive income freely, and up to $25,000/yr can offset ordinary (W-2) income if you actively participate and your MAGI is under $100k (phasing out to $0 by $150k); unused losses carry forward. On sale, claimed depreciation is recaptured at up to 25%, and gains may owe capital-gains tax (a 1031 exchange can defer both). Figures are a year-1 estimate at your 24.0% rate — not tax advice; consult a CPA.
Schools (NCES district)
- District
- Citrus
- NCES district ID
- 1200270
- Math proficiency
- 49% ▼ -10.00%
- Reading proficiency
- 50% ▼ -6.00%
- Median HH income
- $38,618
- Composite
- 41.28/100
- National rank
- #3519
- State rank
- #44 of 73 in FL
Livability — Citrus Springs
- Score
- 68/100
- State rank
- #521
- US rank
- #9598
Category grades
Schools grade is shown separately in the Schools card above.
Census & demographics
- Census place
- Citrus Springs, FL
- County
- Citrus County · 111,314 people
- City population
- 10,730
- Metro
- Homosassa Springs, FL
- Population (ZIP)
- 11,074
- Household income
- $68,939
- Rent vs Own
- Severe rent burden
- 171.0
Population outlook (Citrus County) Hauer SSP2
- Today (2025)
- 138,622 people
- By 2030
- 136,886 · -1.3%
- By 2040
- 132,009 · -4.8%
- By 2050
- 125,196 · -9.7%
- By 2075
- 108,570 · -21.7%
- By 2100
- 84,454 · -39.1%
Race, ethnicity, and origin ACS 2023
- Neighborhood character
- Predominantly White (78%)
- Race & ethnicity
- White 78% Two or more races 11% Hispanic / Latino 9% Black 6%
- Hispanic origin (detail)
- Mexican 3% Puerto Rican 4%
- Common ancestry
- Iranian 3% Romanian 2% Slovak 2%
- Foreign-born
- 4% · Canada
- Languages at home
- 93% English-only · Spanish 5% German/W. Germanic 1% Other Indo-European 1%
Political lean MEDSL · Citrus
- 2024 margin
- Solid R (+45.9) · D 26.8% · R 72.6%
- 2008→2024 swing
- -29.8pp toward R · 2008: -16.1pp · 2024: -45.9pp
- All cycles
- 2024: R+45.9 2020: R+41.0 2016: R+39.7 2012: R+21.9 2008: R+16.1
Not yet ingested
- Civics
- —
Market trends
- HPI YoY
- ▼ -9.70%
- Current HPI
- 328.2164
- Rent YoY
- —
- Metro
- Homosassa Springs, FL
- State GDP YoY
- ▲ 3.28%
- F500 in state
- 36
Industry mix (Fortune 500 HQ in FL)
| Industry | F500 HQs | Revenue |
|---|---|---|
| Industrial Technology | 2 | $29B |
|
||
| Insurance | 2 | $17B |
|
||
| Retail | 1 | $60B |
|
||
| Technology Distribution | 1 | $58B |
|
||
| Homebuilding | 1 | $35B |
|
||
| Technology Manufacturing | 1 | $35B |
|
||
Price history
+505.3% since first listed24 events — show timeline
- 2026-05-20 Relisted — Stellar MLS as Distributed by MLS Grid
- 2026-05-04 Pending — Stellar MLS as Distributed by MLS Grid
- 2026-04-24 Price Changed $230,000 Stellar MLS as Distributed by MLS Grid
- 2026-04-06 Price Changed $240,000 Stellar MLS as Distributed by MLS Grid
- 2026-03-26 Listed $250,000 Stellar MLS as Distributed by MLS Grid
- 2026-02-11 Price Changed $255,000 RACC
- 2026-02-11 Price Changed $255,000 Stellar MLS as Distributed by MLS Grid
- 2026-01-26 Price Changed $260,000 RACC
- 2026-01-26 Price Changed $260,000 Stellar MLS as Distributed by MLS Grid
- 2026-01-19 Price Changed $264,000 RACC
- 2026-01-19 Listed $264,000 Stellar MLS as Distributed by MLS Grid
- 2024-03-01 Listing Removed — Stellar MLS as Distributed by MLS Grid
- 2024-02-29 Sold (Public Records) $233,000 Public Records
- 2024-02-29 Sold (MLS) $233,000 Stellar MLS as Distributed by MLS Grid
- 2024-01-24 Pending — Stellar MLS as Distributed by MLS Grid
- 2024-01-05 Listed $232,000 Stellar MLS as Distributed by MLS Grid
- 2011-04-07 Sold (Public Records) $63,700 Public Records
- 2011-03-31 Sold (MLS) $63,700 RACC
- 2010-05-03 Listed $65,000 RACC
- 2008-08-27 Listing Removed — Stellar MLS as Distributed by MLS Grid
- 2008-03-10 Listed $103,500 Stellar MLS as Distributed by MLS Grid
- 1989-09-01 Sold (Public Records) $66,000 Public Records
- 1981-05-01 Sold (Public Records) $55,000 Public Records
- 1978-02-01 Sold (Public Records) $38,000 Public Records
Property tax history
+2.0%/yrLatest (2025): $693 · -73.0% YoY. Source: county tax records.
Cash-flow waterfall
monthlySold comps — $/sqft
last 12 mo · ≤1 miLoading sold comps…