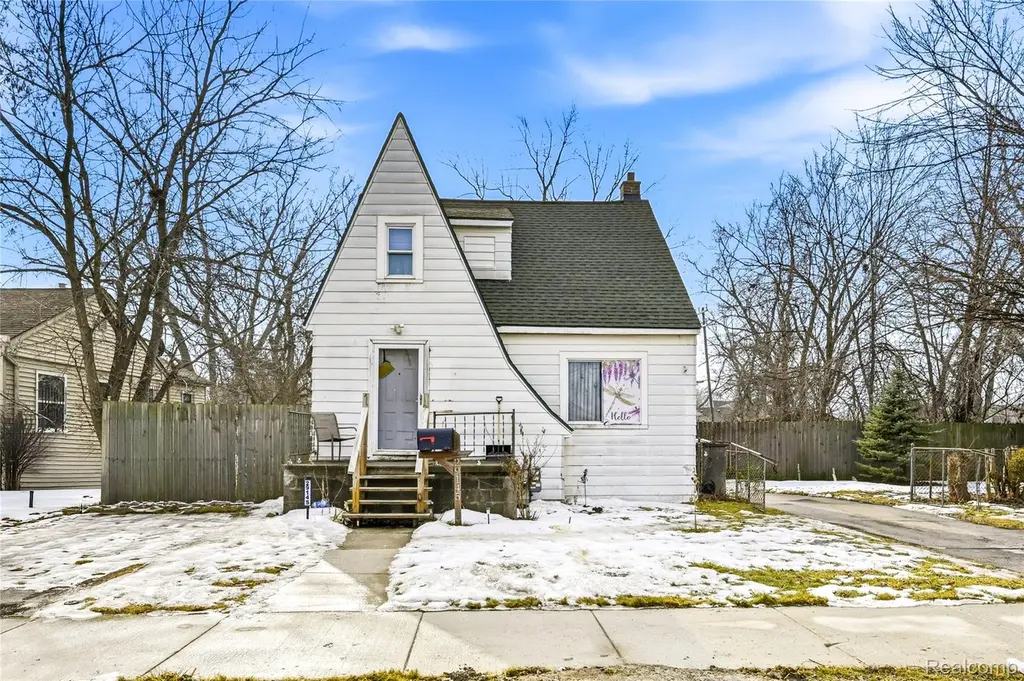
29145 Avondale St · Inkster, MI
Flood risk 1/10 · Minimal
- FEMA flood zone
- X (unshaded)
- Chance of flooding over 30 yrs
- 0.0%
- Est. flood insurance / yr
- $473 – $860
Fire risk 1/10 · Minimal
- Est. fire insurance / yr
- $784 – $1,456
Heat risk 3/10 · Minor
- Hot days now (above 98°F)
- 7 days/yr
- Hot days in 30 yrs
- 15 days/yr
Wind risk 2/10 · Minimal
- Chance of severe wind over 30 yrs
- —
Air-quality risk 2/10 · Minimal
- Unhealthy air days now
- 1 days/yr
- Unhealthy air days in 30 yrs
- 2 days/yr
Risk factors via First Street. Map © Google.
Why this score? — see what drove the D grade
The composite is a weighted blend of 9 inputs, each scored 0–100. Each bar is that input's sub-score; the figure is the points it added to the 100-point composite (weight × sub-score).
- Cash flow +20.5/30.0
- DSCR +6.5/10.0
- 1% rule +5.2/10.0
- Livability +3.4/5.0
- Rent growth +3.2/5.0
- Condition / age +2.5/5.0
- Schools +1.6/10.0
- ARV discount +0.0/15.0
- Appreciation +0.0/10.0
$150,000
🖨 Deal sheet (PDF) 📄 Offer letter ✓ Due diligence
Listing remarks MLS
ADORABLE BUNGALOW W/ DOUBLE LOT This bungalow is ready for a new owner. Features 3 bedrooms, 2 bathrooms, with a basement and 2 car garage located on a double lot. This property features an open floor plan great for entertaining guest. The kitchen includes generous cabinet space. The formal dining room has plenty of space for family dinners. The upstairs has extra space currently being used as a 4th bedroom. Located in a desirable area close to hospitals, parks, and shopping. Features include spacious basement with ample storage space, double lot with fenced in backyard, and a covered back porch. Buyer Agent to Verify All Information. Schedule your private showing today.
Key facts
- Ample storage space
- Open floor plan
- Formal dining room
Tags
Neighborhood map
What this means for you Summary
Snapshot
- This is a 3-bed/1.0-bath single-family listed at $150k.
Deal economics
- At list price, monthly cash flow is $197 ($2k/yr) — positive.
- The deal already cash-flows at list — no discount required.
- Meets the 1% rule at list price ($2k rent vs $150k).
- Recommended offer: $132k (12.0% below list) — sets the bar for market timing.
Location & tenants
- Location reads 67/100 on livability (#406 in MI) — a middle-class / working-renter tenant base. Strengths: commute A+, cost of living A+, housing A+; Watch: health & safety D, crime F, amenities F.
- Wayne-Westland Community School District (suburban): math 11% / reading 27% proficiency, ranked #474 of 540 in MI (top 88%) — low school quality limits family demand, transient renter base, plan for 1-2y turnover.
- Zoned schools: David Hicks School (math 2% / reading 8%, grade F, #1,325 of 1,397 statewide, top 99%, 407 students, 89% FRL); Wayne Memorial High School (math 12% / reading 37%, grade F, #481 of 713 statewide, top 81%, 1,361 students, 63% FRL) — zoned schools average 76% FRL vs 56% district-wide (21 pts higher); higher-poverty schools than district average — tighter screening recommended.
- Market conditions: Rents rising (+3.0%/yr); 147 active listings in the ZIP; 15 comparable units currently listed for rent nearby; rentals at typical pace (median 18d on market — plan ~3-4 weeks tenant-placement turnaround); lower-income renter base — watch delinquency; 2,639 units permitted in Wayne County in 2024 (1,216 in 5+ unit buildings).
- At $1,531/mo this rent would consume 47% of the median local household income ($39k/yr) (locally 1558% of renters already pay >50% of income on rent) — very limited rent-growth headroom before tenants either downsize or default.
Forward outlook
- Local home prices are declining (-3.0%/yr); year-one equity from $1k of loan paydown is wiped out by about $4k of value loss. Plan a longer hold.
- Wayne County population projected at -17% by 2050 — secular population decline; favor cash flow + early exit over multi-decade hold.
Negotiation context
- It's been on market 123 days — a 12% lower offer ($132k) is reasonable based on typical stale-listing flexibility.
- 11 sale attempts since 26y ago with the ask held roughly flat each time — persistent listings suggest the price (not the market) is what's stuck; bring a comps-based counter.
- Current owner paid $4k; list at $150k implies a 3233% gain — meaningful room to come down on a strong offer.
Risks & watch-outs
- Watch-outs: built in 1929 — expect roof / HVAC / electrical / plumbing capex.
Questions for the listing agent
- It's been on market 123 days. Have you received any prior offers? Is the seller open to a 12% concession, seller financing, or rate buy-down credit?
- Built in 1929 — when were the roof, HVAC, electrical panel, plumbing, and water heater last replaced?
- Why hasn't it sold? Are there any deal-killer items the seller is aware of (foundation, flood, title, zoning, code violations)?
- Is there a deadline driving the sale (1031 exchange, divorce, estate, relocation)? That informs how much negotiation room exists.
- Schools are F-rated, which usually means shorter tenancies and higher turnover. Who's the typical renter profile here, and what's been the actual vacancy rate?
- Crime grade is F in this area — have there been break-ins, vandalism, or insurance claims at this property in the last 3 years? What carrier currently insures it and at what premium?
- The area grade is low — what's the realistic commute time and amenity access for the typical tenant pool here? Any planned neighborhood developments (good or bad) we should know about?
- What's the average days-on-market for RENTAL listings here right now (not sales)? A rising rental-DOM trend means longer vacancies and softer asking-rent achievability than the comps imply.
- What's the recent tenant-quality profile in this submarket — average credit score on applications, eviction rate, late-payment / NSF rate, and stable-employment percentage? A property-management company in the area should have these aggregated.
- How much new for-sale + rental construction is in the pipeline within 1–3 miles? Heavy new supply typically softens prices + rents 12–24 months out; constrained supply supports both.
Investment metrics
- 1% rule
- 1.02% ✓
- Cap rate
- 7.87%
- Cash-on-cash
- 5.62%
- DSCR
- 1.25
- GRM
- 8.2
CMA / ARV
- ARV (median comp)
- $124,082
- List price
- $150,000
- Delta
- 20.89%
- Verdict
- OVERPRICED
- Comps
- 20 within 1.0 mi
Show comp detail 12 sales within ~0.75 mi
| Address | Dist | Beds/Ba | Sqft | Sold | Price | $/sf | Match |
|---|---|---|---|---|---|---|---|
| 29118 Avondale St | 0.04mi | 3/1.0 | 1,306 (+3%) | 3mo | $95,000 | $73 | 91 |
| 29541 Steinhauer St | 0.27mi | 3/2.0 | 1,208 (-5%) | 10mo | $175,000 | $145 | 67 |
| 28992 Kathryn St | 0.61mi | 3/1.5 | 1,254 (-1%) | 2mo | $245,000 | $195 | 66 |
| 29537 Hazelwood St | 0.26mi | 3/1.0 | 1,100 (-13%) | 0mo | $80,000 | $73 | 66 |
| 29002 Rosewood St | 0.32mi | 3/2.0 | 1,408 (+11%) | 0mo | $150,000 | $107 | 62 |
| 150 Brandt St | 0.61mi | 3/1.0 | 1,242 (-2%) | 8mo | $207,500 | $167 | 61 |
| 28951 Cherry Hill Rd | 0.51mi | 3/1.0 | 1,392 (+10%) | 1mo | $152,000 | $109 | 59 |
| 29760 Birchwood St | 0.35mi | 3/1.0 | 1,100 (-13%) | 7mo | $118,000 | $107 | 56 |
| 28503 Hazelwood St | 0.38mi | 3/1.0 | 1,092 (-14%) | 10mo | $105,000 | $96 | 51 |
| 29437 Judith St | 0.32mi | 4/1.0 (+1) | 1,077 (-15%) | 10mo | $180,000 | $167 | 46 |
| 1248 Colonial Dr | 0.70mi | 3/1.0 | 1,120 (-12%) | 6mo | $105,000 | $94 | 43 |
| 537 Helen St | 0.66mi | 3/2.0 | 1,400 (+10%) | 8mo | $155,000 | $111 | 41 |
Match score weights: distance 35% · size 25% · config 20% · recency 20%. Top-matched comps best support the ARV.
Projected returns pro-forma
-3.0% appreciation · 2.95% rent growth · sell at horizon
- IRR
- -7.6%
- Equity multiple
- 0.72×
- Total profit
- $-11,839
- Equity at exit
- $22,365
- IRR
- 1.9%
- Equity multiple
- 1.13×
- Total profit
- $5,551
- Equity at exit
- $12,969
Cash invested: $42,000 (down + closing). Projections, not guarantees.
Landlord ↔ Tenant lean methodology
- Overall (STATE)
- 62 Landlord-Friendly
- State Michigan
- 62 Landlord-Friendly · EVEN
- County
- — inherits STATE
- City
- — inherits STATE
ZIP-level market 48141
- Home prices YoY
- -2.9%
- Rents YoY
- 3.0%
- Active inventory
- 147
- Price-to-rent
- 8.2×
Monthly cashflow live
- Estimated rent
- $1,531 high interval (Pro) →
- Mortgage (P&I)
- −$787
- Tax from tax record
- −$163 /mo · $1,961/yr
- Insurance
- −$62
- HOA
- −$0
- Vacancy / Maint / Mgmt
- −$321
- Net cashflow
- $197
Break-even live
Sensitivity live
| Price | -10% $282 | -5% $239 | +0% $197 | +5% $154 | +10% $112 |
|---|---|---|---|---|---|
| Rent | -10% $76 | -5% $136 | +0% $197 | +5% $257 | +10% $318 |
| Rate | -1.0pp $272 | -0.5pp $235 | base $197 | +0.5pp $158 | +1.0pp $118 |
UW: 25.0% down · 7.5% · 30yr · 1.5% tax · 5.0% vac · 8.0% maint · 8.0% mgmt
Financing live
Cash to close
- Down payment
- $37,500
- Closing costs
- $4,500
- Reserves months
- —
- Total cash needed
- —
Loan-product check · same deal, 3 products live
Conventional
25% down · 7.5% · 30yr
- Down + closing
- —
- Monthly P&I
- —
- Monthly cashflow
- —
- DSCR
- —
- Eligible?
- —
Personal DTI + credit; lowest rate.
DSCR
20% down · 8.5% · 30yr
- Down + closing
- —
- Monthly P&I
- —
- Monthly cashflow
- —
- DSCR
- —
- Eligible?
- —
No personal income docs; deal must DSCR.
Hard money
10% down · 12.0% · 12mo
- Down + closing
- —
- Monthly P&I
- —
- Monthly cashflow
- —
- DSCR
- —
- Eligible?
- —
Short-term bridge; refi at stabilization.
Rent comps 15 comps
| Address | Beds | Baths | Sqft | Rent | $/sqft | DOM | Units | Dist |
|---|---|---|---|---|---|---|---|---|
| 29203 Oakwood St Inkster, MI | 3.0 | 1.5 | 912 | $1,600 | $1.75 | 0d | 1 | 0.07mi |
| 29800 Oakwood St Inkster, MI | 3.0 | 1.0 | 1040 | $1,400 | $1.35 | 14d | 1 | 0.25mi |
| 30010 Hazelwood St Inkster, MI | 3.0 | 1.0 | 1044 | $1,300 | $1.25 | 45d | 1 | 0.40mi |
| 30043 Grandview St Unit 1 Inkster, MI | 3.0 | 1.5 | 1004 | $1,275 | $1.27 | 45d | 1 | 0.42mi |
| 1150 Magnolia Dr Inkster, MI | 3.0 | 1.0 | 900 | $1,300 | $1.44 | 25d | 1 | 0.51mi |
| 1189 Woodland Dr Inkster, MI | 3.0 | 1.0 | 994 | $1,400 | $1.41 | 0d | 1 | 0.60mi |
| 30520 Hiveley St Westland, MI | 3.0 | 1.0 | 1105 | $1,700 | $1.54 | 23d | 1 | 0.68mi |
| 29971 Brooklane St Inkster, MI | 3.0 | 1.0 | 974 | $1,450 | $1.49 | 45d | 1 | 0.70mi |
| 130 E Tami Cir Westland, MI | 1.0–2.0 | 1.0–1.5 | 800 | $1,209 | $1.51 | 45d | 3 | 0.77mi |
| 536 N Leona Ave Garden City, MI | 3.0 | 1.0 | 1000 | $1,440 | $1.44 | 14d | 1 | 0.79mi |
| 641 Gilman St Garden City, MI | 3.0 | 1.0 | 1300 | $2,600 | $2.00 | 18d | 1 | 0.96mi |
| 27184 Lucerne Dr Inkster, MI | 3.0 | 1.0 | 1100 | $1,250 | $1.14 | 45d | 1 | 1.04mi |
| 31217 Cherry Hill Rd Westland, MI | 3.0 | 1.0 | 1100 | $1,800 | $1.64 | 5d | 1 | 1.05mi |
| 3236 Walnut St Inkster, MI | 3.0 | 1.0 | 1096 | $1,495 | $1.36 | 0d | 1 | 1.30mi |
| 31809 Tuscola Ct Westland, MI | 3.0 | 1.0 | 1078 | $1,400 | $1.30 | 0d | 1 | 1.38mi |
Listing history 36 events
-
2026-06-21days on market $150,000 Active 123 DOM
-
2026-06-18days on market $150,000 Active 120 DOM
-
2026-06-17days on market $150,000 Active 119 DOM
-
2026-06-16days on market $150,000 Active 118 DOM
-
2026-06-15days on market $150,000 Active 117 DOM
-
2026-06-13days on market $150,000 Active 115 DOM
-
2026-06-13days on market $150,000 Active 114 DOM
-
2026-06-09days on market $150,000 Active 111 DOM
-
2026-06-08days on market $150,000 Active 110 DOM
-
2026-06-07days on market $150,000 Active 109 DOM
-
2026-06-04days on market $150,000 Active 106 DOM
-
2026-06-03days on market $150,000 Active 105 DOM
-
2026-06-02days on market $150,000 Active 104 DOM
-
2026-06-01days on market $150,000 Active 103 DOM
-
2026-05-31days on market $150,000 Active 102 DOM
-
2026-02-18$150,000 Active 679-char remark
Show marketing remark (679 chars)
ADORABLE BUNGALOW W/ DOUBLE LOT This bungalow is ready for a new owner. Features 3 bedrooms, 2 bathrooms, with a basement and 2 car garage located on a double lot. This property features an open floor plan great for entertaining guest. The kitchen includes generous cabinet space. The formal dining room has plenty of space for family dinners. The upstairs has extra space currently being used as a 4th bedroom. Located in a desirable area close to hospitals, parks, and shopping. Features include spacious basement with ample storage space, double lot with fenced in backyard, and a covered back porch. Buyer Agent to Verify All Information. Schedule your private showing today.
-
2011-11-02soldstatus $4,500
-
2011-10-21historical
-
2011-05-06$4,900
-
2011-05-06$4,900
-
2011-04-25historical
-
2011-03-11historical
-
2010-10-28$8,900
-
2010-10-28$8,900
-
2010-09-30historical
-
2010-09-30historical
-
2010-09-13historical
-
2010-06-16$13,900
-
2010-06-16$13,900
-
2010-06-16$13,900
-
2001-01-25soldstatus $91,500
-
2000-12-07soldstatus $86,000
-
2000-12-07soldstatus $86,000
-
2000-09-19$89,900
-
2000-09-19$89,900
ⓘ Source: listings_history table (triggers on properties + properties_extension) + one-shot
backfill from property_details.listing_events for pre-trigger history.
Tax reassessment forecast MI · Partial reset (capped growth)
- Current annual tax
- $1,961 · $163/mo
- Projected year-2 tax
- $2,136 · $178/mo
- Expected delta
- +$174/yr (+$15/mo · 8.9%)
ⓘ Screening estimate from a state-policy table — verify with the county assessor before closing.
Climate risk First Street
- Flood 1/10 Low FEMA zone X (unshaded) · 0% chance over 30 yrs
- Wildfire 1/10 Low
- Heat 3/10 Moderate 7 d/yr ≥98°F today · 15 d/yr by 30 yrs out
- Wind 2/10 Low
- Air quality 2/10 Low 1 unhealthy d/yr today · 2 by 30 yrs out
Nearby sold comps map
Loading sold comps map…
Walkable amenities ~0.75 mi
Loading nearby amenities…
Taxation est. · year 1
- Rental income
- $18,370
- − Mortgage interest
- −$8,402
- − Property taxes
- −$1,961
- − Insurance
- −$750
- − Repairs & maintenance
- −$1,470
- − Management
- −$1,470
- − Depreciation
- −$4,364
- Taxable loss
- −$46
- Est. tax savings @ 24.0%
- +$11
- After-tax cash flow
- $2,373/yr
For passive investors: Depreciation is non-cash, so a rental often shows a tax loss while cash-flowing — sheltering income. Rental losses are passive: they offset passive income freely, and up to $25,000/yr can offset ordinary (W-2) income if you actively participate and your MAGI is under $100k (phasing out to $0 by $150k); unused losses carry forward. On sale, claimed depreciation is recaptured at up to 25%, and gains may owe capital-gains tax (a 1031 exchange can defer both). Figures are a year-1 estimate at your 24.0% rate — not tax advice; consult a CPA.
Schools (NCES district)
- District
- Wayne-Westland Community School District
- NCES district ID
- 2600015
- Math proficiency
- 11% ▼ -6.00%
- Reading proficiency
- 27% ▼ -2.00%
- Median HH income
- $43,524
- Composite
- 16.4/100
- National rank
- #9195
- State rank
- #474 of 540 in MI
Livability — Inkster
- Score
- 67/100
- State rank
- #406
- US rank
- #11087
Category grades
Schools grade is shown separately in the Schools card above.
Census & demographics
- Census place
- Inkster, MI
- County
- Wayne County · 1,562,939 people
- City population
- 25,428
- Metro
- Detroit-Warren-Dearborn, MI
- Population (ZIP)
- 25,428
- Household income
- $39,252
- Rent vs Own
- Severe rent burden
- 1558.0
Population outlook (Wayne County) Hauer SSP2
- Today (2025)
- 1,675,273 people
- By 2030
- 1,620,300 · -3.3%
- By 2040
- 1,502,341 · -10.3%
- By 2050
- 1,384,039 · -17.4%
- By 2075
- 1,124,592 · -32.9%
- By 2100
- 881,193 · -47.4%
Race, ethnicity, and origin ACS 2023
- Neighborhood character
- Predominantly Black (72%)
- Race & ethnicity
- Black 72% White 17% Two or more races 7% Hispanic / Latino 2% Asian 1%
- Common ancestry
- Romanian 3% Slovak 1% Italian 1%
- Foreign-born
- 5% · Canada, China
- Languages at home
- 92% English-only · Arabic 3% Other Asian/Pacific 1% Spanish 1%
Political lean MEDSL · Wayne
- 2024 margin
- Strong D (+29.0) · D 62.7% · R 33.7% · Other 3.6%
- 2008→2024 swing
- -20.5pp toward R · 2008: 49.5pp · 2024: 29.0pp
- All cycles
- 2024: D+29.0 2020: D+38.1 2016: D+37.3 2012: D+46.9 2008: D+49.5
Not yet ingested
- Civics
- —
Market trends
- HPI YoY
- ▼ -11.74%
- Current HPI
- 390.2139
- Rent YoY
- ▲ 2.95%
- Metro
- Detroit-Warren-Dearborn, MI
- State GDP YoY
- ▲ 1.37%
- F500 in state
- 28
Industry mix (Fortune 500 HQ in MI)
| Industry | F500 HQs | Revenue |
|---|---|---|
| Automotive Parts | 3 | $48B |
|
||
| Automotive | 2 | $372B |
|
||
| Chemicals | 1 | $45B |
|
||
| Automotive Retail | 1 | $29B |
|
||
| Healthcare / Medical Devices | 1 | $23B |
|
||
| Automotive Technology | 1 | $20B |
|
||
Price history
+66.9% since first listed21 events — show timeline
- 2026-02-18 Listed $150,000 REALCOMP
- 2026-02-18 Listed $150,000 MiRealSource-MiMLS
- 2011-11-02 Sold (MLS) $4,500 REALCOMP
- 2011-10-21 Listing Removed — MiRealSource-MiMLS
- 2011-05-06 Listed $4,900 MiRealSource-MiMLS
- 2011-05-06 Listed $4,900 REALCOMP
- 2011-04-25 Listing Removed — MiRealSource-MiMLS
- 2011-03-11 Listing Removed — REALCOMP
- 2010-10-28 Listed $8,900 REALCOMP
- 2010-10-28 Listed $8,900 MiRealSource-MiMLS
- 2010-09-30 Listing Removed — MiRealSource-MiMLS
- 2010-09-30 Listing Removed — REALCOMP
- 2010-09-13 Listing Removed — MiRealSource-MiMLS
- 2010-06-16 Listed $13,900 MiRealSource-MiMLS
- 2010-06-16 Listed $13,900 MiRealSource-MiMLS
- 2010-06-16 Listed $13,900 REALCOMP
- 2001-01-25 Sold (Public Records) $91,500 Public Records
- 2000-12-07 Sold (MLS) $86,000 REALCOMP
- 2000-12-07 Sold (MLS) $86,000 MiRealSource-MiMLS
- 2000-09-19 Listed $89,900 REALCOMP
- 2000-09-19 Listed $89,900 MiRealSource-MiMLS
Property tax history
+2.4%/yrLatest (2025): $1,961 · -34.8% YoY. Source: county tax records.
Cash-flow waterfall
monthlySold comps — $/sqft
last 12 mo · ≤1 miLoading sold comps…