316 7th St · LaSalle, IL
Flood risk 1/10 · Minimal
- FEMA flood zone
- X (unshaded)
- Chance of flooding over 30 yrs
- 0.0%
- Est. flood insurance / yr
- $473 – $860
Fire risk 1/10 · Minimal
- Est. fire insurance / yr
- $804 – $1,492
Heat risk 3/10 · Minor
- Hot days now (above 104°F)
- 7 days/yr
- Hot days in 30 yrs
- 16 days/yr
Wind risk 2/10 · Minimal
- Chance of severe wind over 30 yrs
- 1.0%
Air-quality risk 2/10 · Minimal
- Unhealthy air days now
- 1 days/yr
- Unhealthy air days in 30 yrs
- 1 days/yr
Risk factors via First Street. Map © Google.
Why this score? — see what drove the D grade
The composite is a weighted blend of 9 inputs, each scored 0–100. Each bar is that input's sub-score; the figure is the points it added to the 100-point composite (weight × sub-score).
- Cash flow +12.9/30.0
- ARV discount +12.1/15.0
- 1% rule +4.1/10.0
- DSCR +3.9/10.0
- Livability +3.2/5.0
- Rent growth +2.5/5.0
- Condition / age +2.5/5.0
- Schools +1.7/10.0
- Appreciation +0.0/10.0
$129,900
🖨 Deal sheet 📄 Offer letter ✓ Due diligence
Listing remarks MLS
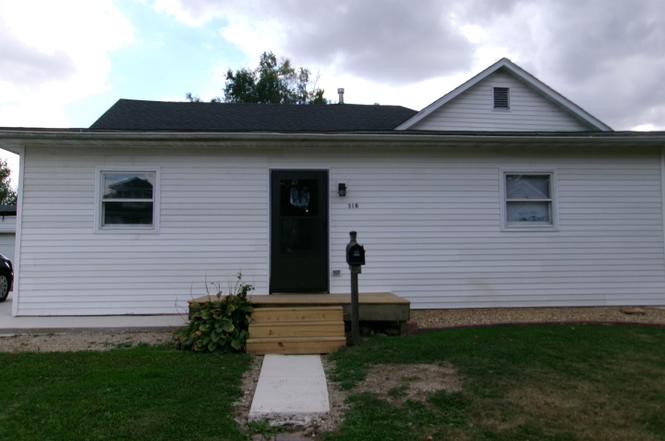
Remodeled 1 story home with 3 bedrooms, 1 bath, main level laundry, deck. Master bedroom has huge walk-in closet. Stove and refrigerator included. Preapproved buyers only. Listing office does not hold earnest money.
Key facts
- Huge walk-in closet
- Main level laundry
- Deck
Tags
Property features AI
Finance
- HOA & community: No master association fees required
Exterior
- Parking: 2 parking spaces; Concrete parking surface
- Utilities: Public water; Public sewer
- Home design: Detached single-family home; One-story layout; Fee simple ownership; Over 100 years old; Built before 1978; Vinyl siding exterior
- Construction: Vinyl siding construction
- Exterior features: Lot dimensions approximately 60 x 120; Lot is less than 0.25 acre
Interior
- Kitchen: Range; Refrigerator; Kitchen on main level (12 x 12)
- Bedrooms: Master bedroom on main level (13 x 18); Bedroom on main level (11 x 12); Bedroom on main level (10 x 15)
- Flooring: Wood laminate flooring in living room, master bedroom, and other bedrooms
- Bathrooms: 1 full bath
- Heating & cooling: Natural gas heating; Central air conditioning
- Interior features: 5 total rooms; Partial cellar basement
- Laundry & utility: Laundry area in bathroom
Neighborhood map
What this means for you Summary
Snapshot
- This is a 3-bed/1.0-bath single-family listed at $130k.
Deal economics
- At list price, monthly cash flow is $-10 ($-117/yr) — negative.
- To cash-flow at today's rent, offer at most $128k (1.3% below list).
- To meet the 1% rule (rent ≥ 1% of price), the offer needs to be $118k (9.3% below list).
- Recommended offer: $118k (9.3% below list) — sets the bar for 1% rule.
Location & tenants
- Location reads 64/100 on livability (#718 in IL) — a middle-class / working-renter tenant base. Strengths: crime A+, cost of living A+, housing A+; Watch: health & safety C-, employment D+, schools F.
- La Salle-Peru Twp Hsd 120 (town): math 15% / reading 26% proficiency, ranked #427 of 620 in IL (top 69%) — low school quality limits family demand, transient renter base, plan for 1-2y turnover.
- Market conditions: 68 active listings in the ZIP; 82 units permitted in LaSalle County in 2024 (0 in 5+ unit buildings).
Forward outlook
- Local home prices are declining (-3.0%/yr); year-one equity from $898 of loan paydown is wiped out by about $4k of value loss. Plan a longer hold.
- LaSalle County population projected at -16% by 2050 — secular population decline; favor cash flow + early exit over multi-decade hold.
Negotiation context
- It's been on market 106 days — a 9% lower offer ($118k) is reasonable based on typical stale-listing flexibility.
- 7 sale attempts since 12y ago with the ask held roughly flat each time — persistent listings suggest the price (not the market) is what's stuck; bring a comps-based counter.
- Current owner paid $14k; list at $130k implies a 862% gain — meaningful room to come down on a strong offer.
Risks & watch-outs
- Watch-outs: built in 1923 — expect roof / HVAC / electrical / plumbing capex.
Questions for the listing agent
- What do current leases actually rent for vs. the listed asking? Can we see a recent rent roll and the last 12 months of T-12 income?
- It's been on market 106 days. Have you received any prior offers? Is the seller open to a 9% concession, seller financing, or rate buy-down credit?
- Built in 1923 — when were the roof, HVAC, electrical panel, plumbing, and water heater last replaced?
- Why hasn't it sold? Are there any deal-killer items the seller is aware of (foundation, flood, title, zoning, code violations)?
- Is there a deadline driving the sale (1031 exchange, divorce, estate, relocation)? That informs how much negotiation room exists.
- Schools are F-rated, which usually means shorter tenancies and higher turnover. Who's the typical renter profile here, and what's been the actual vacancy rate?
- The area grade is low — what's the realistic commute time and amenity access for the typical tenant pool here? Any planned neighborhood developments (good or bad) we should know about?
- What's the average days-on-market for RENTAL listings here right now (not sales)? A rising rental-DOM trend means longer vacancies and softer asking-rent achievability than the comps imply.
- What's the recent tenant-quality profile in this submarket — average credit score on applications, eviction rate, late-payment / NSF rate, and stable-employment percentage? A property-management company in the area should have these aggregated.
- How much new for-sale + rental construction is in the pipeline within 1–3 miles? Heavy new supply typically softens prices + rents 12–24 months out; constrained supply supports both.
Investment metrics
- 1% rule
- 0.91% ✗
- Cap rate
- 6.20%
- Cash-on-cash
- -0.32%
- DSCR
- 0.99
- GRM
- 9.2
CMA / ARV
- ARV (on-the-fly)
- $144,585
- Comps found
- 12
Show comp detail 12 sales within ~0.75 mi
| Address | Dist | Beds/Ba | Sqft | Sold | Price | $/sf | Match |
|---|---|---|---|---|---|---|---|
| 508 7th St | 0.14mi | 2/2.0 (-1) | 1,183 (-3%) | 3mo | $121,000 | $102 | 77 |
| 748 7th St | 0.31mi | 3/1.0 | 1,146 (-6%) | 1mo | $135,900 | $119 | 75 |
| 418 6th St | 0.60mi | 3/1.0 | 1,236 (+2%) | 1mo | $176,000 | $142 | 69 |
| 43 Westclox Ave | 0.38mi | 2/1.0 (-1) | 1,164 (-4%) | 4mo | $33,000 | $28 | 67 |
| 422 Chartres St | 0.24mi | 2/1.0 (-1) | 1,096 (-10%) | 4mo | $120,000 | $109 | 64 |
| 1532 Illinois St | 0.68mi | 3/1.0 | 1,180 (-3%) | 0mo | $162,000 | $137 | 63 |
| 748 Laharpe St | 0.65mi | 3/1.0 | 1,121 (-8%) | 2mo | $89,000 | $79 | 55 |
| 748 Laharpe St | 0.65mi | 3/1.0 | 1,121 (-8%) | 2mo | $89,000 | $79 | 55 |
| 719 12th St | 0.71mi | 3/2.5 | 1,180 (-3%) | 2mo | $140,000 | $119 | 54 |
| 904 9th St | 0.45mi | 4/2.0 (+1) | 1,322 (+9%) | 6mo | $70,000 | $53 | 50 |
| 1445 Linden Ave | 0.60mi | 2/1.0 (-1) | 1,108 (-9%) | 7mo | $159,900 | $144 | 47 |
| 432 Roosevelt Rd | 0.73mi | 2/1.0 (-1) | 1,088 (-10%) | 3mo | $132,500 | $122 | 41 |
Match score weights: distance 35% · size 25% · config 20% · recency 20%. Top-matched comps best support the ARV.
Projected returns pro-forma
-3.0% appreciation · 3.0% rent growth · sell at horizon
- IRR
- -16.8%
- Equity multiple
- 0.41×
- Total profit
- $-21,628
- Equity at exit
- $19,369
- IRR
- -8.6%
- Equity multiple
- 0.47×
- Total profit
- $-19,456
- Equity at exit
- $11,231
Cash invested: $36,372 (down + closing). Projections, not guarantees.
Landlord ↔ Tenant lean methodology
- Overall (STATE)
- 43 Moderately Tenant-Leaning
- State Illinois
- 43 Moderately Tenant-Leaning · D+7
- County
- — inherits STATE
- City
- — inherits STATE
ZIP-level market 61301
- Home prices YoY
- -24.3%
- Active inventory
- 68
- Price-to-rent
- 9.2×
Monthly cashflow live
- Estimated rent
- $1,178 medium interval (Pro) →
- Mortgage (P&I)
- −$681
- Tax from tax record
- −$205 /mo · $2,462/yr
- Insurance
- −$54
- HOA
- −$0
- Vacancy / Maint / Mgmt
- −$247
- Net cashflow
- $-10
Break-even live
UW: 25.0% down · 7.5% · 30yr · 1.5% tax · 5.0% vac · 8.0% maint · 8.0% mgmt
Financing live
Cash to close
- Down payment
- $32,475
- Closing costs
- $3,897
- Reserves months
- —
- Total cash needed
- —
Loan-product check · same deal, 3 products live
Conventional
25% down · 7.5% · 30yr
- Down + closing
- —
- Monthly P&I
- —
- Monthly cashflow
- —
- DSCR
- —
- Eligible?
- —
Personal DTI + credit; lowest rate.
DSCR
20% down · 8.5% · 30yr
- Down + closing
- —
- Monthly P&I
- —
- Monthly cashflow
- —
- DSCR
- —
- Eligible?
- —
No personal income docs; deal must DSCR.
Hard money
10% down · 12.0% · 12mo
- Down + closing
- —
- Monthly P&I
- —
- Monthly cashflow
- —
- DSCR
- —
- Eligible?
- —
Short-term bridge; refi at stabilization.
Listing history 32 events
-
2026-06-19days on market $129,900 Active 106 DOM
-
2026-06-18days on market $129,900 Active 105 DOM
-
2026-06-17days on market $129,900 Active 104 DOM
-
2026-06-16days on market $129,900 Active 103 DOM
-
2026-06-16days on market $129,900 Active 102 DOM
-
2026-06-15days on market $129,900 Active 251 DOM
-
2026-06-14days on market $129,900 Active 249 DOM
-
2026-06-12days on market $129,900 Active 248 DOM
-
2026-06-09days on market $129,900 Active 245 DOM
-
2026-06-08days on market $129,900 Active 244 DOM
-
2026-06-07days on market $129,900 Active 243 DOM
-
2026-06-02days on market $129,900 Active 238 DOM
-
2026-06-01days on market $129,900 Active 237 DOM
-
2026-05-31days on market $129,900 Active 236 DOM
-
2026-05-30days on market $129,900 Active 235 DOM
-
2026-05-01status Active 215-char remark
Show marketing remark (215 chars)
Remodeled 1 story home with 3 bedrooms, 1 bath, main level laundry, deck. Master bedroom has huge walk-in closet. Stove and refrigerator included. Preapproved buyers only. Listing office does not hold earnest money.
-
2026-03-23status Active
-
2026-03-17status Pending 215-char remark
Show marketing remark (215 chars)
Remodeled 1 story home with 3 bedrooms, 1 bath, main level laundry, deck. Master bedroom has huge walk-in closet. Stove and refrigerator included. Preapproved buyers only. Listing office does not hold earnest money.
-
2026-03-17historical Contingent - Continue to Show
Show marketing remark (215 chars)
Remodeled 1 story home with 3 bedrooms, 1 bath, main level laundry, deck. Master bedroom has huge walk-in closet. Stove and refrigerator included. Preapproved buyers only. Listing office does not hold earnest money.
-
2025-11-13price $129,900
-
2025-10-06$129,900 Active 215-char remark
Show marketing remark (215 chars)
Remodeled 1 story home with 3 bedrooms, 1 bath, main level laundry, deck. Master bedroom has huge walk-in closet. Stove and refrigerator included. Preapproved buyers only. Listing office does not hold earnest money.
-
2025-10-06$134,900 Active
Show marketing remark (215 chars)
Remodeled 1 story home with 3 bedrooms, 1 bath, main level laundry, deck. Master bedroom has huge walk-in closet. Stove and refrigerator included. Preapproved buyers only. Listing office does not hold earnest money.
-
2015-07-21historical
-
2015-03-25New
-
2014-09-19soldstatus $13,500 Closed Sale
-
2014-08-19status Pending
-
2014-08-08price $20,000 Price Change
-
2014-07-01status Reactivated
-
2014-06-23status Pending
-
2014-05-21$38,000 New
-
2006-08-07soldstatus $75,000
-
2001-03-05soldstatus $20,000
ⓘ Source: listings_history table (triggers on properties + properties_extension) + one-shot
backfill from property_details.listing_events for pre-trigger history.
Tax reassessment forecast IL · Partial reset (capped growth)
- Current annual tax
- $2,462 · $205/mo
- Projected year-2 tax
- $2,705 · $225/mo
- Expected delta
- +$243/yr (+$20/mo · 9.9%)
ⓘ Screening estimate from a state-policy table — verify with the county assessor before closing.
Climate risk First Street
- Flood 1/10 Low FEMA zone X (unshaded) · 0% chance over 30 yrs
- Wildfire 1/10 Low
- Heat 3/10 Moderate 7 d/yr ≥104°F today · 16 d/yr by 30 yrs out
- Wind 2/10 Low 100% chance of damaging wind over 30 yrs
- Air quality 2/10 Low 1 unhealthy d/yr today · 1 by 30 yrs out
Nearby sold comps map
Loading sold comps map…
Walkable amenities ~0.75 mi
Loading nearby amenities…
Taxation est. · year 1
- Rental income
- $14,137
- − Mortgage interest
- −$7,276
- − Property taxes
- −$2,462
- − Insurance
- −$650
- − Repairs & maintenance
- −$1,131
- − Management
- −$1,131
- − Depreciation
- −$3,779
- Taxable loss
- −$2,291
- Est. tax savings @ 24.0%
- +$550
- After-tax cash flow
- $433/yr
For passive investors: Depreciation is non-cash, so a rental often shows a tax loss while cash-flowing — sheltering income. Rental losses are passive: they offset passive income freely, and up to $25,000/yr can offset ordinary (W-2) income if you actively participate and your MAGI is under $100k (phasing out to $0 by $150k); unused losses carry forward. On sale, claimed depreciation is recaptured at up to 25%, and gains may owe capital-gains tax (a 1031 exchange can defer both). Figures are a year-1 estimate at your 24.0% rate — not tax advice; consult a CPA.
Schools (NCES district)
- District
- La Salle-Peru Twp Hsd 120
- NCES district ID
- 1722110
- Math proficiency
- 15% ▼ -11.00%
- Reading proficiency
- 26% ▼ -11.00%
- Median HH income
- $40,449
- Composite
- 17.37/100
- National rank
- #9070
- State rank
- #427 of 620 in IL
Livability — LaSalle
- Score
- 64/100
- State rank
- #718
- US rank
- #14579
Category grades
Schools grade is shown separately in the Schools card above.
Census & demographics
- Census place
- LaSalle, IL
- Population (ZIP)
- 10,312
Population outlook (LaSalle County) Hauer SSP2
- Today (2025)
- 107,080 people
- By 2030
- 104,196 · -2.7%
- By 2040
- 97,413 · -9.0%
- By 2050
- 90,294 · -15.7%
- By 2075
- 76,252 · -28.8%
- By 2100
- 61,339 · -42.7%
Race, ethnicity, and origin ACS 2023
- Neighborhood character
- Predominantly White (74%)
- Race & ethnicity
- White 74% Hispanic / Latino 18% Two or more races 8% Black 5%
- Hispanic origin (detail)
- Mexican 18%
- Common ancestry
- Romanian 9% Lithuanian 3% Scotch-Irish 1%
- Foreign-born
- 6% · Canada
- Languages at home
- 87% English-only · Spanish 10% German/W. Germanic 1% Other Indo-European 1%
Political lean MEDSL · LaSalle
- 2024 margin
- R (+18.5) · D 40.1% · R 58.6% · Other 1.3%
- 2008→2024 swing
- -29.6pp toward R · 2008: 11.1pp · 2024: -18.5pp
- All cycles
- 2024: R+18.5 2020: R+14.3 2016: R+14.4 2012: R+0.4 2008: D+11.1
Not yet ingested
- Civics
- —
Market trends
- HPI YoY
- ▼ -52.46%
- Current HPI
- 163.091
- Rent YoY
- —
- Metro
- —
- State GDP YoY
- ▲ 1.59%
- F500 in state
- 60
Industry mix (Fortune 500 HQ in IL)
| Industry | F500 HQs | Revenue |
|---|---|---|
| Insurance | 4 | $201B |
|
||
| Consumer Goods | 4 | $87B |
|
||
| Industrial Machinery | 3 | $64B |
|
||
| Healthcare | 2 | $55B |
|
||
| Retail / Pharmacy | 1 | $148B |
|
||
| Agriculture / Food | 1 | $86B |
|
||
Price history
+549.5% since first listed17 events — show timeline
- 2026-05-01 Relisted — NWIAR
- 2026-03-23 Relisted — MRED as Distributed by MLS Grid
- 2026-03-17 Pending — NWIAR
- 2026-03-17 Contingent — MRED as Distributed by MLS Grid
- 2025-11-13 Price Changed $129,900 MRED as Distributed by MLS Grid
- 2025-10-06 Listed $134,900 MRED as Distributed by MLS Grid
- 2025-10-06 Listed $129,900 NWIAR
- 2015-07-21 Listing Removed — MRED as Distributed by MLS Grid
- 2015-03-25 Listed — MRED as Distributed by MLS Grid
- 2014-09-19 Sold (MLS) $13,500 MRED as Distributed by MLS Grid
- 2014-08-19 Pending — MRED as Distributed by MLS Grid
- 2014-08-08 Price Changed $20,000 MRED as Distributed by MLS Grid
- 2014-07-01 Relisted — MRED as Distributed by MLS Grid
- 2014-06-23 Pending — MRED as Distributed by MLS Grid
- 2014-05-21 Listed $38,000 MRED as Distributed by MLS Grid
- 2006-08-07 Sold (Public Records) $75,000 Public Records
- 2001-03-05 Sold (Public Records) $20,000 Public Records
Property tax history
+3.4%/yrLatest (2024): $2,462 · +6.1% YoY. Source: county tax records.
Cash-flow waterfall
monthlySold comps — $/sqft
last 12 mo · ≤1 miLoading sold comps…