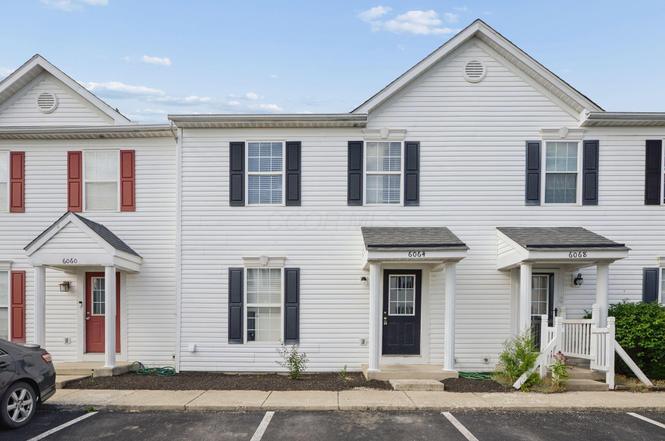
6064 Georges Park Dr Unit 4D · Columbus, OH
Flood risk 1/10 · Minimal
- FEMA flood zone
- X (unshaded)
- Chance of flooding over 30 yrs
- 0.0%
- Est. flood insurance / yr
- $507 – $1,088
Fire risk 1/10 · Minimal
- Est. fire insurance / yr
- $713 – $1,323
Heat risk 4/10 · Minor
- Hot days now (above 99°F)
- 7 days/yr
- Hot days in 30 yrs
- 18 days/yr
Wind risk 2/10 · Minimal
- Chance of severe wind over 30 yrs
- 1.0%
Air-quality risk 2/10 · Minimal
- Unhealthy air days now
- 1 days/yr
- Unhealthy air days in 30 yrs
- 2 days/yr
Risk factors via First Street. Map © Google.
Why this score? — see what drove the C grade
The composite is a weighted blend of 9 inputs, each scored 0–100. Each bar is that input's sub-score; the figure is the points it added to the 100-point composite (weight × sub-score).
- Cash flow +25.3/30.0
- DSCR +8.3/10.0
- 1% rule +7.9/10.0
- ARV discount +7.5/15.0
- Livability +4.0/5.0
- Condition / age +2.5/5.0
- Rent growth +2.4/5.0
- Schools +1.7/10.0
- Appreciation +0.0/10.0
$160,000
🖨 Deal sheet 📄 Offer letter ✓ Due diligence
Listing remarks MLS
This bright, recently updated, light and airy condo could be exactly what you are looking for! Located in the Brice Green community, 6064 Georges Park is a 3 bedroom, 1.5 bathroom home that has gone though a total facelift within the last year. Flooring, kitchen appliances and baths have all been updated and entire condo has been painted a fresh, neutral color. All you need to do is move into this great, spacious condo! Please see A2A
Key facts
- Fresh paint
- New carpet
- $190 HOA
Tags
Property features AI
Finance
- HOA & community: Homeowners association with a $190 monthly fee; Subdivision: Brice Green Condominium
Exterior
- Parking: Assigned parking
- Utilities: Public water; Public sewer
- Home design: Condominium; Two-story building; Two or more common walls; Built in 1999
- Exterior features: Poured foundation
Interior
- Flooring: Laminate flooring; Carpeted areas
- Bathrooms: 1 full bathroom; 1 half bathroom (total 1.5 bathrooms)
- Heating & cooling: Central air conditioning
- Interior features: Insulated windows throughout
Neighborhood map
What this means for you Summary
Snapshot
- This is a 3-bed/1.5-bath condo listed at $160k.
Deal economics
- At list price, monthly cash flow is $365 ($4k/yr) — positive.
- The deal already cash-flows at list — no discount required.
- Meets the 1% rule at list price ($2k rent vs $160k).
- Cap rate 9.0% vs local median 3.8% in Columbus — top-decile yield for the area; either an underpriced asset or a hidden risk that comps aren't pricing in. Stress-test before assuming the spread holds.
Location & tenants
- Location reads 81/100 on livability (#97 in OH, #1,491 nationally) — a professional / high-income tenant draw. Strengths: commute A+, cost of living A+, housing A+; Watch: employment C-, crime F.
- Columbus City School District (urban): math 15% / reading 26% proficiency, ranked #626 of 656 in OH (top 95%) — low school quality limits family demand, transient renter base, plan for 1-2y turnover; 72% free/reduced lunch — lower-income household profile, screen leases tightly.
- Market conditions: Rents soft (-0.5%/yr); 209 active listings in the ZIP; 15 comparable units currently listed for rent nearby; rentals leasing fast (median 2d on market — plan ~1-2 weeks tenant-placement turnaround); solid renter incomes; 8,139 units permitted in Franklin County in 2024 (5,940 in 5+ unit buildings).
- This rent runs 32% of the median local income ($77k/yr) — at the standard rent-burdened threshold; future hikes will face affordability resistance.
Forward outlook
- Local home prices are declining (-3.0%/yr); year-one equity from $1k of loan paydown is wiped out by about $5k of value loss. Plan a longer hold.
- Franklin County population projected at +34% by 2050 — long-run rental-demand tailwind backs the buy-and-hold thesis.
Negotiation context
- Only 1 days on market — expect competitive offers; lowballing is unlikely to land.
- 6 sale attempts since 22y ago with the ask held roughly flat each time — persistent listings suggest the price (not the market) is what's stuck; bring a comps-based counter.
- Current owner paid $83k; list at $160k implies a 93% gain — meaningful room to come down on a strong offer.
Questions for the listing agent
- What does the HOA fee cover, when was the last increase, and are there any pending special assessments or reserve-fund shortfalls?
- Any open or pending special assessments — roof, HVAC, plumbing, elevator, façade? What's the per-unit balance and payoff schedule, and is the seller paying it off at close or rolling it to the buyer?
- Is there a deadline driving the sale (1031 exchange, divorce, estate, relocation)? That informs how much negotiation room exists.
- Crime grade is F in this area — have there been break-ins, vandalism, or insurance claims at this property in the last 3 years? What carrier currently insures it and at what premium?
- What's the average days-on-market for RENTAL listings here right now (not sales)? A rising rental-DOM trend means longer vacancies and softer asking-rent achievability than the comps imply.
- What's the recent tenant-quality profile in this submarket — average credit score on applications, eviction rate, late-payment / NSF rate, and stable-employment percentage? A property-management company in the area should have these aggregated.
- How much new apartment / multifamily construction is in the pipeline within 1–3 miles? Heavy new supply (>2% of stock underway) typically softens rents 12–24 months out; light construction supports rent growth.
Investment metrics
- 1% rule
- 1.29% ✓
- Cap rate
- 9.03%
- Cash-on-cash
- 9.77%
- DSCR
- 1.43
- GRM
- 6.4
CMA / ARV
No comps found within radius.
Projected returns pro-forma
-3.0% appreciation · 0.0% rent growth · sell at horizon
- IRR
- -5.4%
- Equity multiple
- 0.81×
- Total profit
- $-8,626
- Equity at exit
- $23,857
- IRR
- -0.2%
- Equity multiple
- 0.99×
- Total profit
- $-505
- Equity at exit
- $13,834
Cash invested: $44,800 (down + closing). Projections, not guarantees.
Landlord ↔ Tenant lean methodology
- Overall (STATE)
- 73 Landlord-Friendly
- State Ohio
- 73 Landlord-Friendly · R+6
- County
- — inherits STATE
- City
- — inherits STATE
ZIP-level market 43110
- Home prices YoY
- -32.0%
- Rents YoY
- -0.5%
- Active inventory
- 209
- Price-to-rent
- 6.4×
Monthly cashflow live
- Estimated rent
- $2,071 high interval (Pro) →
- Mortgage (P&I)
- −$839
- Tax from tax record
- −$176 /mo · $2,107/yr
- Insurance
- −$67
- HOA
- −$190
- Vacancy / Maint / Mgmt
- −$435
- Net cashflow
- $365
Break-even live
UW: 25.0% down · 7.5% · 30yr · 1.5% tax · 5.0% vac · 8.0% maint · 8.0% mgmt
Financing live
Cash to close
- Down payment
- $40,000
- Closing costs
- $4,800
- Reserves months
- —
- Total cash needed
- —
Loan-product check · same deal, 3 products live
Conventional
25% down · 7.5% · 30yr
- Down + closing
- —
- Monthly P&I
- —
- Monthly cashflow
- —
- DSCR
- —
- Eligible?
- —
Personal DTI + credit; lowest rate.
DSCR
20% down · 8.5% · 30yr
- Down + closing
- —
- Monthly P&I
- —
- Monthly cashflow
- —
- DSCR
- —
- Eligible?
- —
No personal income docs; deal must DSCR.
Hard money
10% down · 12.0% · 12mo
- Down + closing
- —
- Monthly P&I
- —
- Monthly cashflow
- —
- DSCR
- —
- Eligible?
- —
Short-term bridge; refi at stabilization.
Rent comps 15 comps
| Address | Beds | Baths | Sqft | Rent | $/sqft | DOM | Units | Dist |
|---|---|---|---|---|---|---|---|---|
| 6060 Rossi Dr Canal Winchester, OH | 1.0–3.0 | 1.0–2.5 | 1186 | $2,312 | $1.95 | 1d | 19 | 0.09mi |
| 4020 Brice Rd Canal Winchester, OH | 1.0–3.0 | 1.0–2.0 | 953 | $1,920 | $2.01 | 1d | 1 | 0.31mi |
| 4843 Ballentine Dr Canal Winchester, OH | 4.0 | 2.5 | 1808 | $2,250 | $1.24 | 10d | 1 | 0.34mi |
| 4900 Gender Rd Canal Winchester, OH | 1.0–2.0 | 1.0–2.0 | 819 | $1,475 | $1.80 | 1d | 1 | 0.49mi |
| 6460 Chelsea Glen Dr Canal Winchester, OH | 1.0–2.0 | 1.0–2.5 | 1028 | $1,825 | $1.78 | 1d | 22 | 0.50mi |
| 6400 Birch Trail Ln Canal Winchester, OH | 2.0 | 2.0 | 1192 | $1,975 | $1.66 | 1d | 6 | 0.53mi |
| 6471 Crab Apple Dr Canal Winchester, OH | 2.0 | 2.5 | 1680 | $1,899 | $1.13 | 3d | 1 | 0.59mi |
| 6117 Bristol Ridge Dr Canal Winchester, OH | 3.0 | 2.0 | 1274 | $2,160 | $1.70 | 7d | 1 | 0.71mi |
| 6820 Axtel Dr Unit 22D Canal Winchester, OH | 2.0 | 1.5 | 1280 | $1,695 | $1.32 | 43d | 1 | 0.75mi |
| 4540 Gender Rd Canal Winchester, OH | 1.0–2.0 | 1.0–2.0 | 829 | $1,475 | $1.78 | 2d | 19 | 0.87mi |
| 6340 Saddler Way Canal Winchester, OH | 1.0–2.0 | 1.0–1.5 | 872 | $1,461 | $1.68 | 1d | 22 | 0.98mi |
| 6671 Warriner Way Canal Winchester, OH | 3.0 | 2.5 | 1224 | $1,975 | $1.61 | 43d | 1 | 1.16mi |
| 5724 Bixby Rd Canal Winchester, OH | 1.0–3.0 | 1.0–2.0 | 953 | $1,950 | $2.05 | 1d | 1 | 1.19mi |
| 7127 Emerald Tree Dr Canal Winchester, OH | 3.0 | 2.0 | 1838 | $2,296 | $1.25 | 21d | 1 | 1.19mi |
| 3995 Cracker Cove Ln Canal Winchester, OH | 1.0–2.0 | 1.0–2.0 | 914 | $1,485 | $1.62 | 2d | 13 | 1.46mi |
HOA detail condo
- Monthly dues
- $190 · $2,280/yr
- Assessments
- None detected in remarks — confirm with the listing agent.
Listing history 2 events
-
2026-06-18remarks 222-char remark
-
2026-06-18$160,000 Active 1 DOM
ⓘ Source: listings_history table (triggers on properties + properties_extension) + one-shot
backfill from property_details.listing_events for pre-trigger history.
Tax reassessment forecast OH · Partial reset (capped growth)
- Current annual tax
- $2,107 · $176/mo
- Projected year-2 tax
- $2,301 · $192/mo
- Expected delta
- +$195/yr (+$16/mo · 9.2%)
ⓘ Screening estimate from a state-policy table — verify with the county assessor before closing.
Climate risk First Street
- Flood 1/10 Low FEMA zone X (unshaded) · 0% chance over 30 yrs
- Wildfire 1/10 Low
- Heat 4/10 Moderate 7 d/yr ≥99°F today · 18 d/yr by 30 yrs out
- Wind 2/10 Low 100% chance of damaging wind over 30 yrs
- Air quality 2/10 Low 1 unhealthy d/yr today · 2 by 30 yrs out
Nearby sold comps map
Loading sold comps map…
Walkable amenities ~0.75 mi
Loading nearby amenities…
Taxation est. · year 1
- Rental income
- $24,853
- − Mortgage interest
- −$8,962
- − Property taxes
- −$2,107
- − Insurance
- −$800
- − Repairs & maintenance
- −$1,988
- − Management
- −$1,988
- − HOA
- −$2,280
- − Depreciation
- −$4,655
- Taxable income
- $2,073
- Est. tax owed @ 24.0%
- −$497
- After-tax cash flow
- $3,881/yr
For passive investors: Depreciation is non-cash, so a rental often shows a tax loss while cash-flowing — sheltering income. Rental losses are passive: they offset passive income freely, and up to $25,000/yr can offset ordinary (W-2) income if you actively participate and your MAGI is under $100k (phasing out to $0 by $150k); unused losses carry forward. On sale, claimed depreciation is recaptured at up to 25%, and gains may owe capital-gains tax (a 1031 exchange can defer both). Figures are a year-1 estimate at your 24.0% rate — not tax advice; consult a CPA.
Schools (NCES district)
- District
- Columbus City School District
- NCES district ID
- 3904380
- Math proficiency
- 15% ▼ -17.00%
- Reading proficiency
- 26% ▼ -12.00%
- Median HH income
- $38,483
- Composite
- 17.19/100
- National rank
- #9105
- State rank
- #626 of 656 in OH
Livability — Columbus
- Score
- 81/100
- State rank
- #97
- US rank
- #1491
Category grades
Schools grade is shown separately in the Schools card above.
Census & demographics
- Census place
- Columbus, OH
- County
- Franklin County · 1,351,780 people
- City population
- 612,189
- Metro
- Columbus, OH
- Population (ZIP)
- 43,544
- Household income
- $77,442
- Rent vs Own
- Severe rent burden
- 1240.0
Population outlook (Franklin County) Hauer SSP2
- Today (2025)
- 1,456,139 people
- By 2030
- 1,556,890 · +6.9%
- By 2040
- 1,757,349 · +20.7%
- By 2050
- 1,950,539 · +34.0%
- By 2075
- 2,376,171 · +63.2%
- By 2100
- 2,636,796 · +81.1%
Race, ethnicity, and origin ACS 2023
- Neighborhood character
- Diverse neighborhood (Simpson 0.60)
- Race & ethnicity
- White 54% Black 32% Two or more races 8% Asian 4% Hispanic / Latino 3%
- Common ancestry
- Romanian 2% Italian 2% Slovak 2%
- Foreign-born
- 11% · India, Canada, China
- Languages at home
- 87% English-only · French/Haitian/Cajun 3% Other Indo-European 3% Spanish 1%
Political lean MEDSL · Franklin
- 2024 margin
- Strong D (+28.4) · D 63.7% · R 35.3% · Other 1.0%
- 2008→2024 swing
- +7.7pp toward D · 2008: 20.7pp · 2024: 28.4pp
- All cycles
- 2024: D+28.4 2020: D+31.4 2016: D+25.9 2012: D+21.7 2008: D+20.7
Not yet ingested
- Civics
- —
Market trends
- HPI YoY
- ▼ -105.16%
- Current HPI
- 223.7824
- Rent YoY
- ▼ -0.54%
- Metro
- Columbus, OH
- State GDP YoY
- ▲ 1.98%
- F500 in state
- 48
Industry mix (Fortune 500 HQ in OH)
| Industry | F500 HQs | Revenue |
|---|---|---|
| Insurance | 3 | $145B |
|
||
| Industrial Machinery | 3 | $49B |
|
||
| Financial Services | 3 | $24B |
|
||
| Consumer Goods | 2 | $93B |
|
||
| Aerospace / Defense | 2 | $47B |
|
||
| Utilities | 2 | $33B |
|
||
Price history
+100.3% since first listed15 events — show timeline
- 2026-06-17 Listed $160,000 CBRMLS
- 2018-06-21 Sold (Public Records) $82,700 Public Records
- 2018-06-11 Sold (MLS) $82,700 CBRMLS
- 2018-04-30 Contingent — CBRMLS
- 2018-04-25 Listed $79,900 CBRMLS
- 2017-03-24 Sold (MLS) $56,000 CBRMLS
- 2017-02-05 Pending — CBRMLS
- 2017-01-26 Relisted — CBRMLS
- 2016-12-10 Pending — CBRMLS
- 2016-11-26 Relisted — CBRMLS
- 2016-10-18 Pending — CBRMLS
- 2016-09-20 Listed $59,900 CBRMLS
- 2005-05-18 Sold (Public Records) $79,900 Public Records
- 2005-05-09 Sold (MLS) $79,900 CBRMLS
- 2004-10-11 Listed $79,900 CBRMLS
Property tax history
+8.0%/yrLatest (2024): $2,107 · +1.3% YoY. Source: county tax records.
Cash-flow waterfall
monthlySold comps — $/sqft
last 12 mo · ≤1 miLoading sold comps…