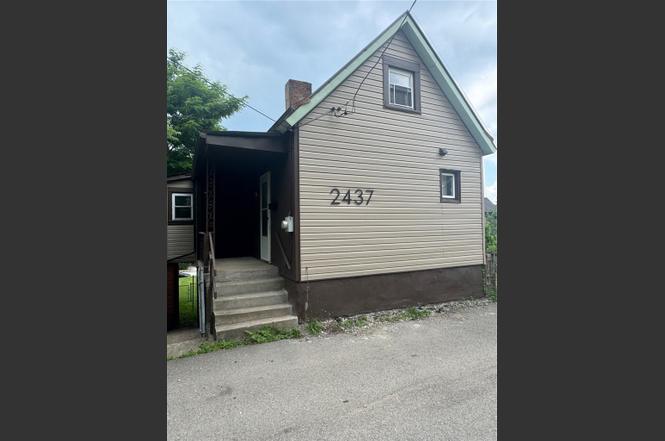
2437 Bruce Way · Swissvale, PA
Flood risk 1/10 · Minimal
- FEMA flood zone
- X (unshaded)
- Chance of flooding over 30 yrs
- 0.0%
- Est. flood insurance / yr
- $473 – $860
Fire risk 1/10 · Minimal
- Est. fire insurance / yr
- $511 – $949
Heat risk 4/10 · Minor
- Hot days now (above 98°F)
- 7 days/yr
- Hot days in 30 yrs
- 18 days/yr
Wind risk 2/10 · Minimal
- Chance of severe wind over 30 yrs
- 0.0%
Air-quality risk 4/10 · Minor
- Unhealthy air days now
- 4 days/yr
- Unhealthy air days in 30 yrs
- 5 days/yr
Risk factors via First Street. Map © Google.
Why this score? — see what drove the C- grade
The composite is a weighted blend of 9 inputs, each scored 0–100. Each bar is that input's sub-score; the figure is the points it added to the 100-point composite (weight × sub-score).
- Cash flow +24.5/30.0
- DSCR +7.9/10.0
- 1% rule +5.5/10.0
- ARV discount +4.3/15.0
- Livability +4.2/5.0
- Rent growth +4.0/5.0
- Condition / age +2.5/5.0
- Schools +1.8/10.0
- Appreciation +0.0/10.0
$99,900
🖨 Deal sheet (PDF) 📄 Offer letter ✓ Due diligence
Listing remarks
Welcome to 2437 Bruce Way, Pittsburgh, PA! This move-in-ready frame home features numerous recent updates, including brand-new quartz countertops, a ceramic tile backsplash, new carpeting, fresh paint throughout, and new flooring. The functional layout offers comfortable living spaces, a finished lower-level area that provides additional versatility, and a convenient powder room in the lower level. Enjoy outdoor living on the back porch, perfect for relaxing or entertaining. Conveniently located near shopping, dining, schools, parks, and major commuter routes, this home offers easy access to everyday amenities and destinations throughout Pittsburgh. A wonderful opportunity for an owner-occu
Key facts
- Quartz countertops
- Back porch
- 3,998 sq ft lot
Tags
Property features AI
Exterior
- Utilities: Public water; Public sewer
- Home design: Frame construction
- Construction: Frame construction
- Exterior features: Property listed as resale
Interior
- Kitchen: Kitchen (upper level, 9 x 11)
- Bedrooms: Upper bedroom (8 x 14)
- Flooring: Carpet; Hardwood
- Bathrooms: 1 full bathroom; 1 half bathroom
- Heating & cooling: Central air cooling
- Interior features: Carpet and hardwood flooring; Basement
Neighborhood map
What this means for you Summary
Snapshot
- This is a 1-bed/1.0-bath single-family listed at $100k.
Deal economics
- At list price, monthly cash flow is $205 ($2k/yr) — positive.
- The deal already cash-flows at list — no discount required.
- Meets the 1% rule at list price ($1k rent vs $100k).
- Cap rate 8.8% vs local median 6.3% in Swissvale — top-decile yield for the area; either an underpriced asset or a hidden risk that comps aren't pricing in. Stress-test before assuming the spread holds.
Location & tenants
- Location reads 84/100 on livability (#95 in PA, #694 nationally) — a professional / high-income tenant draw. Strengths: commute A+, cost of living A+, housing A+; Watch: crime C-, amenities D+.
- Woodland Hills SD (suburban): math 13% / reading 30% proficiency, ranked #486 of 539 in PA (top 90%) — low school quality limits family demand, transient renter base, plan for 1-2y turnover; 69% free/reduced lunch — lower-income household profile, screen leases tightly.
- Zoned schools: Edgewood El Steam Academy (math 12% / reading 32%, grade F, #1,221 of 1,518 statewide, top 81%, 531 students, 100% FRL); Dickson Prep Steam Academy (math 8% / reading 27%, grade F, #455 of 512 statewide, top 89%, 642 students, 100% FRL); Woodland Hills Hs (math 37% / reading 30%, grade F, #323 of 437 statewide, top 74%, 949 students, 89% FRL) — zoned schools average 96% FRL vs 69% district-wide (27 pts higher); higher-poverty schools than district average — tighter screening recommended.
- Market conditions: Rents rising fast (+6.0%/yr); 79 active listings in the ZIP; 22 comparable units currently listed for rent nearby; rentals at typical pace (median 25d on market — plan ~3-4 weeks tenant-placement turnaround); 2,996 units permitted in Allegheny County in 2024 (1,588 in 5+ unit buildings).
Forward outlook
- Local home prices are declining (-3.0%/yr); year-one equity from $691 of loan paydown is wiped out by about $3k of value loss. Plan a longer hold.
- At projected returns (-3.0% appreciation + 6.0% rent growth), your $28k cash investment doubles in ~9 years — after that, you're playing with house money.
Negotiation context
- Only 4 days on market — expect competitive offers; lowballing is unlikely to land.
- Current owner paid $25k; list at $100k implies a 300% gain — meaningful room to come down on a strong offer.
Risks & watch-outs
- Watch-outs: built in 1908 — expect roof / HVAC / electrical / plumbing capex.
Questions for the listing agent
- Built in 1908 — when were the roof, HVAC, electrical panel, plumbing, and water heater last replaced?
- Is there a deadline driving the sale (1031 exchange, divorce, estate, relocation)? That informs how much negotiation room exists.
- Schools are B-rated — typically a magnet for longer-tenancy family renters. What's the average tenant stay here, and is there a school-zone premium baked into asking?
- What's the average days-on-market for RENTAL listings here right now (not sales)? A rising rental-DOM trend means longer vacancies and softer asking-rent achievability than the comps imply.
- What's the recent tenant-quality profile in this submarket — average credit score on applications, eviction rate, late-payment / NSF rate, and stable-employment percentage? A property-management company in the area should have these aggregated.
- How much new for-sale + rental construction is in the pipeline within 1–3 miles? Heavy new supply typically softens prices + rents 12–24 months out; constrained supply supports both.
Investment metrics
- 1% rule
- 1.05% ✓
- Cap rate
- 8.75%
- Cash-on-cash
- 8.79%
- DSCR
- 1.39
- GRM
- 8.0
CMA / ARV
- ARV (on-the-fly)
- $93,357
- Comps found
- 10
Show comp detail 10 sales within ~0.75 mi
| Address | Dist | Beds/Ba | Sqft | Sold | Price | $/sf | Match |
|---|---|---|---|---|---|---|---|
| 2324 Buena Vista St | 0.17mi | 2/1.0 (+1) | 825 (+9%) | 13mo | $103,000 | $125 | 62 |
| 6 Farkas Pl | 0.34mi | 2/2.0 (+1) | 768 (+1%) | 19mo | $170,000 | $221 | 58 |
| 7637 Roslyn St | 0.39mi | 2/1.0 (+1) | 842 (+11%) | 6mo | $130,000 | $154 | 53 |
| 2003 Lafayette St | 0.65mi | 2/1.0 (+1) | 800 (+5%) | 3mo | $98,500 | $123 | 53 |
| 213 Fleet St | 0.62mi | 2/2.0 (+1) | 792 (+4%) | 11mo | $77,216 | $97 | 46 |
| 7216 Schley Ct | 0.61mi | 2/1.0 (+1) | 850 (+12%) | 12mo | $80,000 | $94 | 37 |
| 7912 Lloyd Ave | 0.51mi | 2/1.5 (+1) | 856 (+13%) | 20mo | $136,000 | $159 | 32 |
| 7212 Schley Ct | 0.61mi | 2/1.0 (+1) | 850 (+12%) | 18mo | $92,500 | $109 | 32 |
| 2523 Columbia Ave | 0.45mi | 2/1.0 (+1) | 655 (-14%) | 24mo | $20,000 | $31 | 32 |
| 1922 Lafayette St | 0.69mi | 2/1.0 (+1) | 850 (+12%) | 14mo | $83,500 | $98 | 32 |
Match score weights: distance 35% · size 25% · config 20% · recency 20%. Top-matched comps best support the ARV.
Projected returns pro-forma
-3.0% appreciation · 6.02% rent growth · sell at horizon
- IRR
- 0.1%
- Equity multiple
- 1.00×
- Total profit
- $108
- Equity at exit
- $14,895
- IRR
- 12.4%
- Equity multiple
- 2.11×
- Total profit
- $31,072
- Equity at exit
- $8,638
Cash invested: $27,972 (down + closing). Projections, not guarantees.
Landlord ↔ Tenant lean methodology
- Overall (STATE)
- 62 Landlord-Friendly
- State Pennsylvania
- 62 Landlord-Friendly · EVEN
- County
- — inherits STATE
- City
- — inherits STATE
ZIP-level market 15218
- Rents YoY
- 6.0%
- Active inventory
- 79
- Price-to-rent
- 8.0×
Monthly cashflow live
- Estimated rent
- $1,045 high interval (Pro) →
- Mortgage (P&I)
- −$524
- Tax from tax record
- −$55 /mo · $659/yr
- Insurance
- −$42
- HOA
- −$0
- Vacancy / Maint / Mgmt
- −$219
- Net cashflow
- $205
Break-even live
Sensitivity live
| Price | -10% $261 | -5% $233 | +0% $205 | +5% $177 | +10% $148 |
|---|---|---|---|---|---|
| Rent | -10% $122 | -5% $164 | +0% $205 | +5% $246 | +10% $287 |
| Rate | -1.0pp $255 | -0.5pp $230 | base $205 | +0.5pp $179 | +1.0pp $153 |
UW: 25.0% down · 7.5% · 30yr · 1.5% tax · 5.0% vac · 8.0% maint · 8.0% mgmt
Financing live
Cash to close
- Down payment
- $24,975
- Closing costs
- $2,997
- Reserves months
- —
- Total cash needed
- —
Loan-product check · same deal, 3 products live
Conventional
25% down · 7.5% · 30yr
- Down + closing
- —
- Monthly P&I
- —
- Monthly cashflow
- —
- DSCR
- —
- Eligible?
- —
Personal DTI + credit; lowest rate.
DSCR
20% down · 8.5% · 30yr
- Down + closing
- —
- Monthly P&I
- —
- Monthly cashflow
- —
- DSCR
- —
- Eligible?
- —
No personal income docs; deal must DSCR.
Hard money
10% down · 12.0% · 12mo
- Down + closing
- —
- Monthly P&I
- —
- Monthly cashflow
- —
- DSCR
- —
- Eligible?
- —
Short-term bridge; refi at stabilization.
Rent comps 22 comps
| Address | Beds | Baths | Sqft | Rent | $/sqft | DOM | Units | Dist |
|---|---|---|---|---|---|---|---|---|
| 2319 S Braddock Ave Unit 2 Pittsburgh, PA | 1.0 | 1.0 | 600 | $1,090 | $1.82 | 25d | 1 | 0.18mi |
| 2255 Hawthorne Ave Unit 2255 Swissvale, PA | 2.0 | 1.0 | 1020 | $1,000 | $0.98 | 14d | 1 | 0.29mi |
| 7801 Lloyd Ave Unit 105 Pittsburgh, PA | 1.0 | 1.0 | 750 | $970 | $1.29 | 25d | 1 | 0.40mi |
| 2121 Milligan Ave Unit 6 Pittsburgh, PA | 2.0 | 1.0 | 800 | $1,300 | $1.62 | 6d | 1 | 0.41mi |
| 2121 Milligan Ave Unit 3 Pittsburgh, PA | 2.0 | 1.0 | 800 | $1,195 | $1.49 | 45d | 1 | 0.41mi |
| 207 Montana Ave Pittsburgh, PA | 2.0 | 1.0 | 840 | $1,000 | $1.19 | 25d | 1 | 0.44mi |
| 1003 Smokey Wood Dr Swissvale, PA | 1.0–2.0 | 1.0 | 874 | $1,140 | $1.30 | 6d | 4 | 0.58mi |
| 7467 Schoyer Ave Pittsburgh, PA | 1.0 | 1.0 | 900 | $895 | $0.99 | 4d | 1 | 0.71mi |
| 7340 Whipple St Swissvale, PA | 1.0 | 1.0 | 685 | $920 | $1.34 | 25d | 2 | 0.87mi |
| 7338 Whipple St Unit 10 Swissvale, PA | 1.0 | 1.0 | 685 | $920 | $1.34 | 25d | 1 | 0.87mi |
| 235 Edgewood Ave Pittsburgh, PA | 1.0 | 1.0 | 712 | $925 | $1.30 | 5d | 1 | 0.94mi |
| 233-241 Edgewood Ave Unit B06 Pittsburgh, PA | 2.0 | 1.0 | 726 | $1,250 | $1.72 | 25d | 1 | 0.95mi |
| 233-241 Edgewood Ave Unit B09 Pittsburgh, PA | 1.0 | 1.0 | 712 | $1,050 | $1.47 | 45d | 1 | 0.95mi |
| 233-241 Edgewood Ave Unit B10 Pittsburgh, PA | 2.0 | 1.0 | 726 | $1,250 | $1.72 | 45d | 1 | 0.95mi |
| 241 Edgewood Ave Unit C12 Pittsburgh, PA | 1.0 | 1.0 | 712 | $925 | $1.30 | 21d | 1 | 0.95mi |
| 7122 Harrison Ave Unit 1 Pittsburgh, PA | 1.0 | 1.0 | 820 | $1,100 | $1.34 | 18d | 1 | 0.95mi |
| 214 Vine St Homestead, PA | 2.0 | 1.0 | 1034 | $1,150 | $1.11 | 45d | 1 | 1.10mi |
| 1635 Ardmore Blvd Pittsburgh, PA | 1.0 | 1.0 | 650 | $800 | $1.23 | 23d | 1 | 1.17mi |
| 1305 Walnut St Unit B Pittsburgh, PA | 1.0 | 1.0 | 840 | $1,000 | $1.19 | 25d | 1 | 1.19mi |
| 817 Kirkpatrick Ave Unit 8171-A Braddock, PA | 2.0 | 1.0 | 866 | $800 | $0.92 | 45d | 1 | 1.34mi |
| 519 E 9th Ave Fl 1 Homestead, PA | 1.0 | 1.0 | 900 | $995 | $1.11 | 12d | 1 | 1.43mi |
| 100 Bryn Mawr Ct W Pittsburgh, PA | 1.0–2.0 | 1.0–2.0 | 975 | $1,210 | $1.24 | 4d | 15 | 1.45mi |
Listing history 3 events
-
2026-06-21days on market $99,900 Active 4 DOM
-
2026-06-17remarks 699-char remark
-
2026-06-17$99,900 Active 1 DOM
ⓘ Source: listings_history table (triggers on properties + properties_extension) + one-shot
backfill from property_details.listing_events for pre-trigger history.
Tax reassessment forecast PA · Partial reset (capped growth)
- Current annual tax
- $659 · $55/mo
- Projected year-2 tax
- $1,119 · $93/mo
- Expected delta
- +$459/yr (+$38/mo · 69.7%)
ⓘ Screening estimate from a state-policy table — verify with the county assessor before closing.
Climate risk First Street
- Flood 1/10 Low FEMA zone X (unshaded) · 0% chance over 30 yrs
- Wildfire 1/10 Low
- Heat 4/10 Moderate 7 d/yr ≥98°F today · 18 d/yr by 30 yrs out
- Wind 2/10 Low 0% chance of damaging wind over 30 yrs
- Air quality 4/10 Moderate 4 unhealthy d/yr today · 5 by 30 yrs out
Nearby sold comps map
Loading sold comps map…
Walkable amenities ~0.75 mi
Loading nearby amenities…
Taxation est. · year 1
- Rental income
- $12,538
- − Mortgage interest
- −$5,596
- − Property taxes
- −$659
- − Insurance
- −$500
- − Repairs & maintenance
- −$1,003
- − Management
- −$1,003
- − Depreciation
- −$2,906
- Taxable income
- $871
- Est. tax owed @ 24.0%
- −$209
- After-tax cash flow
- $2,250/yr
For passive investors: Depreciation is non-cash, so a rental often shows a tax loss while cash-flowing — sheltering income. Rental losses are passive: they offset passive income freely, and up to $25,000/yr can offset ordinary (W-2) income if you actively participate and your MAGI is under $100k (phasing out to $0 by $150k); unused losses carry forward. On sale, claimed depreciation is recaptured at up to 25%, and gains may owe capital-gains tax (a 1031 exchange can defer both). Figures are a year-1 estimate at your 24.0% rate — not tax advice; consult a CPA.
Schools (NCES district)
- District
- Woodland Hills SD
- NCES district ID
- 4216500
- Math proficiency
- 13% ▼ -13.00%
- Reading proficiency
- 30% ▼ -10.00%
- Median HH income
- $41,803
- Composite
- 18.31/100
- National rank
- #8954
- State rank
- #486 of 539 in PA
Livability — Swissvale
- Score
- 84/100
- State rank
- #95
- US rank
- #694
Category grades
Schools grade is shown separately in the Schools card above.
Census & demographics
- Census place
- Swissvale, PA
- County
- Allegheny County · 1,022,028 people
- City population
- 13,443
- Metro
- Pittsburgh, PA
- Population (ZIP)
- 13,379
- Household income
- $67,960
- Rent vs Own
- Severe rent burden
- 605.0
Population outlook (Allegheny County) Hauer SSP2
- Today (2025)
- 1,250,282 people
- By 2030
- 1,256,482 · +0.5%
- By 2040
- 1,256,318 · +0.5%
- By 2050
- 1,244,169 · -0.5%
- By 2075
- 1,197,693 · -4.2%
- By 2100
- 1,093,187 · -12.6%
Race, ethnicity, and origin ACS 2023
- Neighborhood character
- Predominantly White (69%)
- Race & ethnicity
- White 69% Black 19% Two or more races 7% Hispanic / Latino 4% Asian 3%
- Common ancestry
- Romanian 6% Serbian 2% Lithuanian 2%
- Foreign-born
- 6% · Canada, China
- Languages at home
- 94% English-only · Spanish 2% Other Indo-European 1% Chinese 1%
Political lean MEDSL · Allegheny
- 2024 margin
- Strong D (+20.3) · D 59.7% · R 39.4%
- 2008→2024 swing
- +4.8pp toward D · 2008: 15.5pp · 2024: 20.3pp
- All cycles
- 2024: D+20.3 2020: D+20.4 2016: D+16.4 2012: D+14.4 2008: D+15.5
Not yet ingested
- Civics
- —
Market trends
- HPI YoY
- ▼ -188.20%
- Current HPI
- 297.8483
- Rent YoY
- ▲ 6.02%
- Metro
- Pittsburgh, PA
- State GDP YoY
- ▲ 1.68%
- F500 in state
- 34
Industry mix (Fortune 500 HQ in PA)
| Industry | F500 HQs | Revenue |
|---|---|---|
| Healthcare | 2 | $309B |
|
||
| Insurance | 2 | $27B |
|
||
| Telecommunications / Media | 1 | $124B |
|
||
| Industrial Distribution | 1 | $22B |
|
||
| Financial Services | 1 | $20B |
|
||
| Chemicals / Materials | 1 | $18B |
|
||
Price history
+256.8% since first listed5 events — show timeline
- 2026-06-15 Listed $99,900 West Penn MLS
- 2025-09-16 Sold (Public Records) $25,000 Public Records
- 2013-04-08 Sold (Public Records) $8,000 Public Records
- 1991-05-16 Sold (Public Records) $10,000 Public Records
- 1985-12-26 Sold (Public Records) $28,000 Public Records
Property tax history
+2.1%/yrLatest (2026): $659 · +5.6% YoY. Source: county tax records.
Cash-flow waterfall
monthlySold comps — $/sqft
last 12 mo · ≤1 miLoading sold comps…