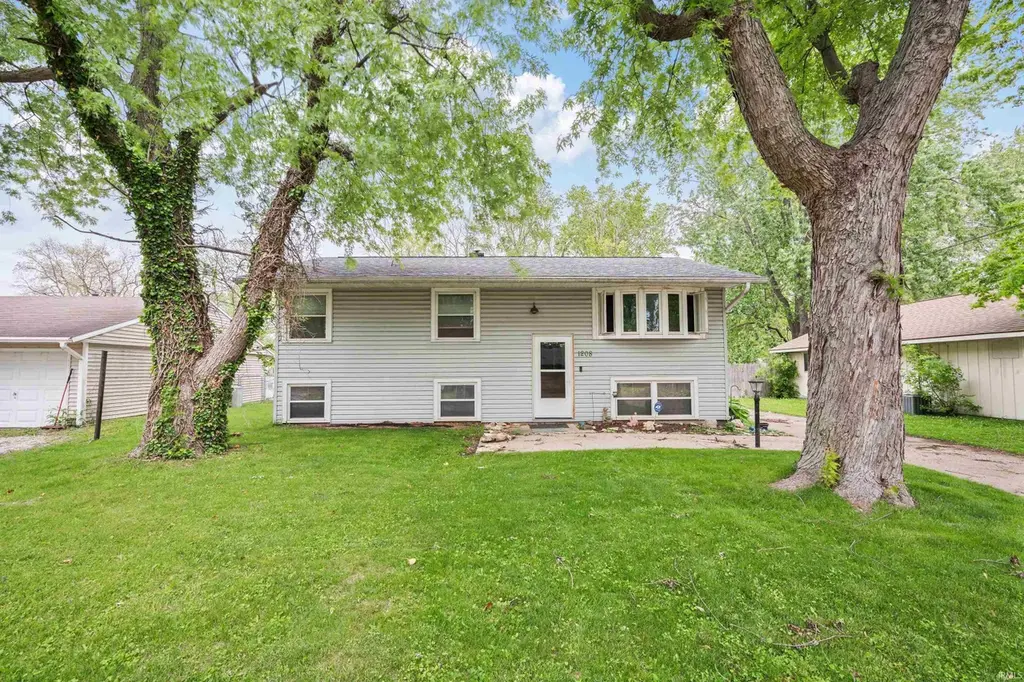
1208 Wigwam Dr · Kokomo, IN
Flood risk 1/10 · Minimal
- FEMA flood zone
- X (unshaded)
- Chance of flooding over 30 yrs
- 0.0%
- Est. flood insurance / yr
- $507 – $1,088
Fire risk 1/10 · Minimal
- Est. fire insurance / yr
- $717 – $1,331
Heat risk 3/10 · Minor
- Hot days now (above 101°F)
- 7 days/yr
- Hot days in 30 yrs
- 16 days/yr
Wind risk 2/10 · Minimal
- Chance of severe wind over 30 yrs
- 0.0%
Air-quality risk 3/10 · Minor
- Unhealthy air days now
- 2 days/yr
- Unhealthy air days in 30 yrs
- 4 days/yr
Risk factors via First Street. Map © Google.
Why this score? — see what drove the C+ grade
The composite is a weighted blend of 9 inputs, each scored 0–100. Each bar is that input's sub-score; the figure is the points it added to the 100-point composite (weight × sub-score).
- Cash flow +24.2/30.0
- ARV discount +15.0/15.0
- DSCR +7.8/10.0
- 1% rule +5.6/10.0
- Livability +3.4/5.0
- Rent growth +3.0/5.0
- Condition / age +2.5/5.0
- Schools +1.8/10.0
- Appreciation +0.0/10.0
$150,000
🖨 Deal sheet 📄 Offer letter ✓ Due diligence
Listing remarks MLS
Over 2000 sq ft just waiting for a new family. 4 bedroom 2 bath home has new bamboo flooring, fresh paint and big heated inground pool with privacy fence. Roof only 1 yr old, windows have been updated. Large family room with gas fireplace.
Key facts
- In-ground pool
- Wooden fenced yard
- Finished basement
Tags
Property features AI
Finance
- Other: Located in the Indian Heights subdivision
Exterior
- Utilities: Public water; Public sewer
- Home design: Single-family site-built home; Residential property
- Construction: Vinyl siding
- Exterior features: In-ground private pool; Shed(s) on the property; Lot dimensions approximately 62 x 114
Interior
- Kitchen: Refrigerator; Electric range
- Bedrooms: Total of 10 rooms (includes bedrooms and living spaces)
- Bathrooms: 2 full bathrooms; 1 main-level bathroom
- Heating & cooling: Central air conditioning; Forced air heating
- Interior features: Basement is full; One fireplace located in the basement
- Laundry & utility: Laundry located in the basement
Neighborhood map
What this means for you Summary
Snapshot
- This is a 5-bed/2.0-bath single-family listed at $150k.
Deal economics
- At list price, monthly cash flow is $299 ($4k/yr) — positive.
- The deal already cash-flows at list — no discount required.
- Meets the 1% rule at list price ($2k rent vs $150k).
- Recommended offer: $146k (3.0% below list) — sets the bar for market timing.
- Cap rate 8.7% vs local median 5.2% in Kokomo — top-decile yield for the area; either an underpriced asset or a hidden risk that comps aren't pricing in. Stress-test before assuming the spread holds.
Location & tenants
- Location reads 68/100 on livability (#227 in IN) — a middle-class / working-renter tenant base. Strengths: cost of living A+, housing A+, health & safety A; Watch: crime D, amenities F, commute F.
- Taylor Community School Corporation (rural): math 17% / reading 23% proficiency, ranked #272 of 301 in IN (top 90%) — low school quality limits family demand, transient renter base, plan for 1-2y turnover.
- Zoned schools: Taylor Elementary School (math 19% / reading 19%, grade F, #829 of 994 statewide, top 84%, 513 students, 78% FRL); Taylor Middle School (math 13% / reading 20%, grade F, #287 of 330 statewide, top 88%, 413 students, 76% FRL); Taylor High School (math 32% / reading 52%, grade F, #197 of 369 statewide, top 57%, 374 students, 67% FRL) — zoned schools average 74% FRL vs 45% district-wide (29 pts higher); higher-poverty schools than district average — tighter screening recommended.
- Market conditions: Rents rising (+1.8%/yr); 232 active listings in the ZIP; 194 units permitted in Howard County in 2024 (0 in 5+ unit buildings).
- This rent runs 31% of the median local income ($62k/yr) — at the standard rent-burdened threshold; future hikes will face affordability resistance.
Forward outlook
- Local home prices are declining (-3.0%/yr); year-one equity from $1k of loan paydown is wiped out by about $4k of value loss. Plan a longer hold.
- Howard County population projected at -11% by 2050 — secular population decline; favor cash flow + early exit over multi-decade hold.
Negotiation context
- It's been on market 32 days — a 3% lower offer ($146k) is reasonable based on typical stale-listing flexibility.
- 2 sale attempts since 12y ago; this cycle's ask has dropped $10k (6%) from the opening price — seller is motivated, your offer sets the floor, not the list.
- Current owner paid $86k; list at $150k implies a 74% gain — meaningful room to come down on a strong offer.
Questions for the listing agent
- It's been on market 32 days. Have you received any prior offers? Is the seller open to a 3% concession, seller financing, or rate buy-down credit?
- Built in 1965 — when were the roof, HVAC, electrical panel, plumbing, and water heater last replaced?
- Is there a deadline driving the sale (1031 exchange, divorce, estate, relocation)? That informs how much negotiation room exists.
- Schools are F-rated, which usually means shorter tenancies and higher turnover. Who's the typical renter profile here, and what's been the actual vacancy rate?
- Crime grade is D in this area — have there been break-ins, vandalism, or insurance claims at this property in the last 3 years? What carrier currently insures it and at what premium?
- What's the average days-on-market for RENTAL listings here right now (not sales)? A rising rental-DOM trend means longer vacancies and softer asking-rent achievability than the comps imply.
- What's the recent tenant-quality profile in this submarket — average credit score on applications, eviction rate, late-payment / NSF rate, and stable-employment percentage? A property-management company in the area should have these aggregated.
- How much new for-sale + rental construction is in the pipeline within 1–3 miles? Heavy new supply typically softens prices + rents 12–24 months out; constrained supply supports both.
Investment metrics
- 1% rule
- 1.06% ✓
- Cap rate
- 8.68%
- Cash-on-cash
- 8.54%
- DSCR
- 1.38
- GRM
- 7.8
CMA / ARV
- ARV (on-the-fly)
- $220,480
- Comps found
- 12
Show comp detail 12 sales within ~0.75 mi
| Address | Dist | Beds/Ba | Sqft | Sold | Price | $/sf | Match |
|---|---|---|---|---|---|---|---|
| 1113 Tepee Dr | 0.08mi | 4/2.0 (-1) | 2,080 (0%) | 19mo | $170,000 | $82 | 76 |
| 5513 Council Ring Blvd | 0.10mi | 5/2.0 | 1,842 (-11%) | 11mo | $182,000 | $99 | 67 |
| 849 Lando Creek Dr | 0.38mi | 4/2.5 (-1) | 2,160 (+4%) | 5mo | $315,000 | $146 | 64 |
| 2127 Upland Ridge Way | 0.43mi | 4/2.5 (-1) | 2,176 (+5%) | 3mo | $325,000 | $149 | 63 |
| 1008 Tepee Dr | 0.17mi | 4/2.0 (-1) | 1,908 (-8%) | 12mo | $188,000 | $99 | 63 |
| 3128 Springwater Ct | 0.49mi | 4/2.5 (-1) | 2,064 (-1%) | 11mo | $213,000 | $103 | 60 |
| 728 Springwater Dr | 0.29mi | 4/2.5 (-1) | 1,981 (-5%) | 15mo | $216,000 | $109 | 59 |
| 5914 Monona Dr | 0.43mi | 5/1.5 | 2,361 (+14%) | 0mo | $195,000 | $83 | 55 |
| 2150 Upland Ridge Way | 0.41mi | 4/2.5 (-1) | 2,232 (+7%) | 14mo | $270,000 | $121 | 50 |
| 4707 Orleans Dr | 0.67mi | 4/2.0 (-1) | 2,080 (0%) | 19mo | $200,000 | $96 | 48 |
| 913 Highland Springs Ln | 0.27mi | 4/2.5 (-1) | 2,343 (+13%) | 17mo | $306,995 | $131 | 45 |
| 912 Waterfront Dr | 0.36mi | 4/2.5 (-1) | 2,350 (+13%) | 12mo | $250,000 | $106 | 45 |
Match score weights: distance 35% · size 25% · config 20% · recency 20%. Top-matched comps best support the ARV.
Projected returns pro-forma
-3.0% appreciation · 1.8% rent growth · sell at horizon
- IRR
- -4.6%
- Equity multiple
- 0.83×
- Total profit
- $-7,205
- Equity at exit
- $22,365
- IRR
- 3.6%
- Equity multiple
- 1.25×
- Total profit
- $10,510
- Equity at exit
- $12,969
Cash invested: $42,000 (down + closing). Projections, not guarantees.
Landlord ↔ Tenant lean methodology
- Overall (STATE)
- 90 Strongly Landlord-Friendly
- State Indiana
- 90 Strongly Landlord-Friendly · R+11
- County
- — inherits STATE
- City
- — inherits STATE
ZIP-level market 46902
- Home prices YoY
- -20.7%
- Rents YoY
- 1.8%
- Active inventory
- 232
- Price-to-rent
- 7.8×
Monthly cashflow live
- Estimated rent
- $1,596 medium interval (Pro) →
- Mortgage (P&I)
- −$787
- Tax from tax record
- −$113 /mo · $1,358/yr
- Insurance
- −$62
- HOA
- −$0
- Vacancy / Maint / Mgmt
- −$335
- Net cashflow
- $299
Break-even live
UW: 25.0% down · 7.5% · 30yr · 1.5% tax · 5.0% vac · 8.0% maint · 8.0% mgmt
Financing live
Cash to close
- Down payment
- $37,500
- Closing costs
- $4,500
- Reserves months
- —
- Total cash needed
- —
Loan-product check · same deal, 3 products live
Conventional
25% down · 7.5% · 30yr
- Down + closing
- —
- Monthly P&I
- —
- Monthly cashflow
- —
- DSCR
- —
- Eligible?
- —
Personal DTI + credit; lowest rate.
DSCR
20% down · 8.5% · 30yr
- Down + closing
- —
- Monthly P&I
- —
- Monthly cashflow
- —
- DSCR
- —
- Eligible?
- —
No personal income docs; deal must DSCR.
Hard money
10% down · 12.0% · 12mo
- Down + closing
- —
- Monthly P&I
- —
- Monthly cashflow
- —
- DSCR
- —
- Eligible?
- —
Short-term bridge; refi at stabilization.
Listing history 22 events
-
2026-06-19days on market $150,000 Active 32 DOM
-
2026-06-18days on market $150,000 Active 31 DOM
-
2026-06-17days on market $150,000 Active 30 DOM
-
2026-06-17price $150,000 Active 29 DOM
-
2026-06-16days on market $160,000 Active 29 DOM
-
2026-06-15days on market $160,000 Active 28 DOM
-
2026-06-14days on market $160,000 Active 26 DOM
-
2026-06-13days on market $160,000 Active 25 DOM
-
2026-06-10days on market $160,000 Active 23 DOM
-
2026-06-09days on market $160,000 Active 22 DOM
-
2026-06-08days on market $160,000 Active 21 DOM
-
2026-06-07days on market $160,000 Active 20 DOM
-
2026-06-05days on market $160,000 Active 17 DOM
-
2026-06-03days on market $160,000 Active 16 DOM
-
2026-06-02days on market $160,000 Active 15 DOM
-
2026-06-01days on market $160,000 Active 14 DOM
-
2026-05-31days on market $160,000 Active 13 DOM
-
2026-05-30days on market $160,000 Active 12 DOM
-
2026-05-18$160,000 Active
-
2014-12-29soldstatus $86,000 239-char remark
Show marketing remark (239 chars)
Over 2000 sq ft just waiting for a new family. 4 bedroom 2 bath home has new bamboo flooring, fresh paint and big heated inground pool with privacy fence. Roof only 1 yr old, windows have been updated. Large family room with gas fireplace.
-
2014-09-02$99,900 239-char remark
Show marketing remark (239 chars)
Over 2000 sq ft just waiting for a new family. 4 bedroom 2 bath home has new bamboo flooring, fresh paint and big heated inground pool with privacy fence. Roof only 1 yr old, windows have been updated. Large family room with gas fireplace.
-
2003-04-30soldstatus $85,700
ⓘ Source: listings_history table (triggers on properties + properties_extension) + one-shot
backfill from property_details.listing_events for pre-trigger history.
Tax reassessment forecast IN · Partial reset (capped growth)
- Current annual tax
- $1,358 · $113/mo
- Projected year-2 tax
- $1,358 · $113/mo
- Expected delta
- $0/yr ($0/mo · 0.0%)
ⓘ Screening estimate from a state-policy table — verify with the county assessor before closing.
Climate risk First Street
- Flood 1/10 Low FEMA zone X (unshaded) · 0% chance over 30 yrs
- Wildfire 1/10 Low
- Heat 3/10 Moderate 7 d/yr ≥101°F today · 16 d/yr by 30 yrs out
- Wind 2/10 Low 0% chance of damaging wind over 30 yrs
- Air quality 3/10 Moderate 2 unhealthy d/yr today · 4 by 30 yrs out
Nearby sold comps map
Loading sold comps map…
Walkable amenities ~0.75 mi
Loading nearby amenities…
Taxation est. · year 1
- Rental income
- $19,155
- − Mortgage interest
- −$8,402
- − Property taxes
- −$1,358
- − Insurance
- −$750
- − Repairs & maintenance
- −$1,532
- − Management
- −$1,532
- − Depreciation
- −$4,364
- Taxable income
- $1,216
- Est. tax owed @ 24.0%
- −$292
- After-tax cash flow
- $3,293/yr
For passive investors: Depreciation is non-cash, so a rental often shows a tax loss while cash-flowing — sheltering income. Rental losses are passive: they offset passive income freely, and up to $25,000/yr can offset ordinary (W-2) income if you actively participate and your MAGI is under $100k (phasing out to $0 by $150k); unused losses carry forward. On sale, claimed depreciation is recaptured at up to 25%, and gains may owe capital-gains tax (a 1031 exchange can defer both). Figures are a year-1 estimate at your 24.0% rate — not tax advice; consult a CPA.
Schools (NCES district)
- District
- Taylor Community School Corporation
- NCES district ID
- 1811250
- Math proficiency
- 17% ▼ -10.00%
- Reading proficiency
- 23% ▼ -9.00%
- Median HH income
- $52,382
- Composite
- 18.12/100
- National rank
- #8969
- State rank
- #272 of 301 in IN
Livability — Kokomo
- Score
- 68/100
- State rank
- #227
- US rank
- #9912
Category grades
Schools grade is shown separately in the Schools card above.
Census & demographics
- Census place
- Kokomo, IN
- County
- Howard County · 75,099 people
- City population
- 75,099
- Metro
- Kokomo, IN
- Population (ZIP)
- 37,017
- Household income
- $62,126
- Rent vs Own
- Severe rent burden
- 1262.0
Population outlook (Howard County) Hauer SSP2
- Today (2025)
- 81,522 people
- By 2030
- 80,104 · -1.7%
- By 2040
- 76,708 · -5.9%
- By 2050
- 72,880 · -10.6%
- By 2075
- 64,016 · -21.5%
- By 2100
- 51,705 · -36.6%
Race, ethnicity, and origin ACS 2023
- Neighborhood character
- Predominantly White (81%)
- Race & ethnicity
- White 81% Black 9% Two or more races 5% Hispanic / Latino 4% Asian 3%
- Common ancestry
- Italian 2% Lithuanian 1% Slovak 1%
- Foreign-born
- 3% · Canada, Vietnam, China
- Languages at home
- 96% English-only · Vietnamese 1% Other Asian/Pacific 1% Spanish 1%
Political lean MEDSL · Howard
- 2024 margin
- Solid R (+35.3) · D 31.4% · R 66.7% · Other 1.8%
- 2008→2024 swing
- -29.1pp toward R · 2008: -6.2pp · 2024: -35.3pp
- All cycles
- 2024: R+35.3 2020: R+32.4 2016: R+33.9 2012: R+14.3 2008: R+6.2
Not yet ingested
- Civics
- —
Market trends
- HPI YoY
- ▼ -61.76%
- Current HPI
- 236.8237
- Rent YoY
- ▲ 1.80%
- Metro
- Kokomo, IN
- State GDP YoY
- ▲ 2.90%
- F500 in state
- 18
Industry mix (Fortune 500 HQ in IN)
| Industry | F500 HQs | Revenue |
|---|---|---|
| Industrial Machinery | 2 | $37B |
|
||
| Healthcare | 1 | $177B |
|
||
| Pharmaceuticals | 1 | $45B |
|
||
| Metals / Steel | 1 | $18B |
|
||
| Agriculture | 1 | $17B |
|
||
| Packaging | 1 | $12B |
|
||
Price history
+86.7% since first listed4 events — show timeline
- 2026-05-18 Listed $160,000 IRMLS
- 2014-12-29 Sold (MLS) $86,000 IRMLS
- 2014-09-02 Listed $99,900 IRMLS
- 2003-04-30 Sold (Public Records) $85,700 Public Records
Property tax history
+0.0%/yrLatest (2024): $1,358 · +14.1% YoY. Source: county tax records.
Cash-flow waterfall
monthlySold comps — $/sqft
last 12 mo · ≤1 miLoading sold comps…